40 period HMA with volume markers40 period Hull Moving Average with volume markers
This indicator puts a 40 period Hull Moving Average in the chart with the additional feature of colored stretches which mark a volume event, i.e. a rize in volume higher than 150% of the recently normal volume, for which the median volume in the previous 10 periods;
strategy
You can use this indicator in any timeframe. Prices higher than the line predict a coming rise, below the line a drop. The direction of the line points in the direction of the price movements. Tops and bottoms lag about 6 periods. volume events occur often at the beginning or the end of a trend.
ابحث في النصوص البرمجية عن "泰国一寺庙被曝藏有40多具尸体"

40 DOMINANT ALTCOINS BINANCEThis indicator is a combination of 40 different altcoins which are found on Binance exchange.
I have listed all Binance altcoins in the order of the oldest listed and the newest.
Due to limitations on TV for calling only 40 securities at the same time, I have limited myself with adding only the oldest ones (9+ months) and some 8+ to make up at least 40 for more data.
I have excluded BTC, BCC, ETH, USDT, BNB from list as these are the trading pairs.
I have some updates in mind and will try to add more options in coming months
Regularly updating 40 altcoins list by sorting them by market cap and available historical data from Binance
Adding Bitfinex, Bittrex and other exchanges separetly, as there is only 40 security call limit
Adding ETH; USDT pairs for all above exchanges.
You can add any indicator to this indicator - such as MACD, RSI, EMA and so on to help you analyse it more deeper
When you load this indicator, it takes about 1 min wait as it takes and calculates a lot of data. After it is loaded, it works perfectly.
Currently there is only 40 oldest altcoins to gather enough data, but as time passes, I will change some of them to create better picture of alt coins.
Please report any problems and give feedback.
Any idea of improvement is welcome and I will try my best.
Please support me an consider to give a small tip to addresses bellow. It would greatly help me to free more time for improvements as I am working to support family and my time is limited for markets.
ETH: 0xac290B4A721f5ef75b0971F1102e01E1942A4578
BTC: 39p3rKuJYKGqph1Qs35yEfNWoPvpUJBBcy
This will greatly help me to keep update this indicator and give me more time to analyse and sort out all altcoins my their market cap, volume and influence.

40 Ticker Cross-Sectional Z-Scores [BackQuant]40 Ticker Cross-Sectional Z-Scores
BackQuant’s 40 Ticker Cross-Sectional Z-Scores is a powerful portfolio management strategy that analyzes the relative performance of up to 40 different assets, comparing them on a cross-sectional basis to identify the top and bottom performers. This indicator computes Z-scores for each asset based on their log returns and evaluates them relative to the mean and standard deviation over a rolling window. The Z-scores represent how far an asset's return deviates from the average, and these values are used to rank the assets, allowing for dynamic asset allocation based on performance.
By focusing on the strongest-performing assets and avoiding the weakest, this strategy aims to enhance returns while managing risk. Additionally, by adjusting for standard deviations, the system offers a risk-adjusted method of ranking assets, making it suitable for traders who want to dynamically allocate capital based on performance metrics rather than just price movements.
Key Features
1. Cross-Sectional Z-Score Calculation:
The system calculates Z-scores for 40 different assets, evaluating their log returns against the mean and standard deviation over a rolling window. This enables users to assess the relative performance of each asset dynamically, highlighting which assets are performing better or worse compared to their historical norms. The Z-score is a useful statistical tool for identifying outliers in asset performance.
2. Asset Ranking and Allocation:
The system ranks assets based on their Z-scores and allocates capital to the top performers. It identifies the top and bottom assets, and traders can allocate capital to the top-performing assets, ensuring that their portfolio is aligned with the best performers. Conversely, the bottom assets are removed from the portfolio, reducing exposure to underperforming assets.
3. Rolling Window for Mean and Standard Deviation Calculations:
The Z-scores are calculated based on rolling means and standard deviations, making the system adaptive to changing market conditions. This rolling calculation window allows the strategy to adjust to recent performance trends and minimize the impact of outdated data.
4. Mean and Standard Deviation Visualization:
The script provides real-time visualizations of the mean (x̄) and standard deviation (σ) of asset returns, helping traders quickly identify trends and volatility in their portfolio. These visual indicators are useful for understanding the current market environment and making more informed allocation decisions.
5. Top & Bottom Performer Tables:
The system generates tables that display the top and bottom performers, ranked by their Z-scores. Traders can quickly see which assets are outperforming and underperforming. These tables provide clear and actionable insights, helping traders make informed decisions about which assets to include in their portfolio.
6. Customizable Parameters:
The strategy allows traders to customize several key parameters, including:
Rolling Calculation Window: Set the window size for the rolling mean and standard deviation calculations.
Top & Bottom Tickers: Choose how many of the top and bottom assets to display and allocate capital to.
Table Orientation: Select between vertical or horizontal table formats to suit the user’s preference.
7. Forward Test & Out-of-Sample Testing:
The system includes out-of-sample forward tests, ensuring that the strategy is evaluated based on real-time performance, not just historical data. This forward testing approach helps validate the robustness of the strategy in dynamic market conditions.
8. Visual Feedback and Alerts:
The system provides visual feedback on the current asset rankings and allocations, with dynamic labels and plots on the chart. Additionally, users receive alerts when allocations change, keeping them informed of important adjustments.
9. Risk Management via Z-Scores and Std Dev:
The system’s approach to asset selection is based on Z-scores, which normalize performance relative to the historical mean. By incorporating standard deviation, it accounts for the volatility and risk associated with each asset. This allows for more precise risk management and portfolio construction.
10. Note on Mean Reversion Strategy:
If you take the inverse of the signals provided by this indicator, the strategy can be used for mean-reversion rather than trend-following. This would involve buying the underperforming assets and selling the outperforming ones. However, it's important to note that this approach does not work well with highly correlated assets, as the relationship between the assets could result in the same directional movement, undermining the effectiveness of the mean-reversion strategy.
References
www.uts.edu.au
onlinelibrary.wiley.com
www.cmegroup.com
Final Thoughts
The 40 Ticker Cross-Sectional Z-Scores strategy offers a data-driven approach to portfolio management, dynamically allocating capital based on the relative performance of assets. By using Z-scores and standard deviations, this strategy ensures that capital is directed to the strongest performers while avoiding weaker assets, ultimately improving the risk-adjusted returns of the portfolio. Whether you’re focused on trend-following or looking to explore mean-reversion strategies, this flexible system can be tailored to suit your investment goals.

40+ Coin Screener (workaround to 40 Security Limit Per Script) This is a far inferior method for a screener/scanner (compared to my first publication) but after looking at that script from a noobs eyes again, I could see how this form would be a lot easier to take in/understand so wanted to publish it. Everything that I could think of to mention about this is in my 1st pub so ill leave it to you to check it out...though I did include some comments in the script. It is pretty straight forward but if you have any questions don't hold them in. I'll answer them if I can. The only thing that is not in this one is setting up the alert feature so that you only have to create 1 alert per iteration of the script and it takes care of all of the coins for that iteration/set that is chosen in the settings (so please see previous script if would like to do this for your screener/scanner).
To be PERFECTLY CLEAR, the workaround is to the issue of not being able to scan but only 40 coins per script. You can scan more than 40 per script but only if you create "batches" or "sets" that the user can select within the settings which set to use for each iteration of the script on the chart. That being, you have to the script multiple times to the chart and merge them into 1 window and merge the scales (instructions in first publications). Here in this script I am scanning 72 different coins that are the Margin Coins on KUCOIN. I have split them up into 3 sets (24 coins per set). I could have made 2 sets but the script will be slower to load and to respond (like, when it comes to receiving alerts), thus I split them up the way I did. If you want to change any of this there are slightly more details in the previous script.
One great use-case that I LOVE about this particular version (and the way I use it) is right at the end of when I see a whole market dump/pump coming to an end and want to know which horse to bet on. Used to think whichever coin come out the fastest from the dump was the one to bet on but quickly learned that 1-2 (or even a few) hrs needs to go by first bc the ones that look the strongest in the beginning are NOT the ones to have performed the best when viewing the results 12 hrs later. IN FACT, many instances of using this exact script for reasons as such has taught me that the manipulators (I believe this to be the case as least) WANT everyone to bet on these that come out the gate the hardest and thus they make them move REALLY hard in the beginning then they QUICKLY become stagnant (moreso, they become WORSE than stagnant, they actually quickly retrace to put you into the negative so that you get out to get into the others now moving (to provide the market with more liquidity. They WANT you to get into a coin thats moving crazy hard so that they can then cease that movement once many fall for the trick just to then make that once strong looking coin now stagnant and make others move crazy hard. They wait for you to get out of the 1st and into the next set of movers just to do this time and time again bc hey, what are we sheep good for other than to provide the big guns with liquidity, am I right? Thats rhetorical, which you would know if you've ever had this happen to you (without a doubt MANY of you have). Let this script (above all other things) provide good evidence to back up this cynical way of viewing the markets to anyone that is questioning it.
This prolonged time between when the dump is over and when the ACTUAL movers REALLY start moving can actually be of great benefit to us sheep if used correctly, Firstly, it gives us some time to determine if when we thought was the bottom, ACTUALLY was the bottom. That bottom is easily determined if there are no (or very few) coins that went any lower than the point in time that the script began calculating on. Secondly, it allows us time to wait for the REAL movers and shakers to start moving and shaking.
One new feature that I LOVE that TV has implemented is the ability (once the script is added to the chart) to be able to click a point in time on the chart where you want the script to begin its calculations. If this point needs to be changed at any point in time then you can either go into the setting and input the time you wish or simply remove the script and add it again so that you are prompted to select another point in time. Ok, I think that everything I wanted to say. The next version that I will add will be probably my favorite and most used by yours truly...not to mention unique in a way that I have yet to see an implementation anything like it in all of TV's public library. Not to say its not there, but I have yet to come across it and I have DEFINITELY done my fair share of searching for it when I couldn't figure out how to code it for the longest time (though, I was and still am a noob so might get some great feedback on better ways to approach it, but we'll save that jabbering for the next of the publications.
I hope each and every one of ya'll (yes, Im from the South) have the GREATEST of Thanksgivings (if in the US that is...I graced my parents with the best gift anyone could have given them 35 years ago on Thanksgiving....MEEEE ;) So I will sure as hell be having a great holiday. Thanks for checking out my script...you can "like" and leave a comment if you so feel the urge to...or not. Im not doing this for me, but rather to stretch my arms out as far as possible to benefit the most people as possible and more people would see the script if it has more likes/comments/traffic pointing towards it...not to mention as other publishers have...it IS gratifying to see a few likes in my side window, which btw, I have MANY more variations and completely diff types of scanners/screeners Ill be publishing in the future and to know that they've become of use....I"VE become of use to the community is very....pleasing to me and does (as I've also seen many publishers mention as well) drive me to want to publish ones that I originally thought I would keep for myself. Peace out people.

EMA SMA Dynamic/Static 40*MultiCombo40 individual customizeable MovingAverage Indicators + PHP-Source Script for adapting it

Scanner/Screener of Over 40 Coins Per Script I am very scatter-brained by nature and sporadic in my thought processes but if these benefit the community and ya'll ask for more perhaps I will get better and even out a tad....probably not....but you never know. Firstly, allow me to apologize to all the vet/more sophisticated coders out there whose eyes and brains might just be overly taxed due to my poor coding structure. Im just getting started for the first time in ANY sort of coding...so cut me a little slack. Also, if anyone sees any mistakes or the functionality is not as I proclaimed, PLEASE do let me know. In these past 12mo of me learning my 1st coding language (Pinescript) I would say that I have been intently focused on creating all types/sorts of scanners/screeners. Ive always hoped to be a benefit to the community as I was always SO grateful to those who have come before me that have led me to the little bit of progress I have made with Pinescript. This script is not necessarily something that should be traded with as it is just a thrown together example showing a scanner/screener whose results produce plot outputs (ie, Rate of Change / oscillators as well / etc) and how they can be used in the alert system so that only 1 alert has to be set per iteration of the script but more importantly how to use/scan/screen with over 40 coins per script. My intent is not to trick anyone here. So to be PERFECTLY CLEAR, more than 40 coins CAN in fact be screened/scanned from one script (here I am doing all of KUCOIN's Margin Coins...72 total I look at)...BUT...(heres the catch) it must be added to the chart however many times EQUAL to the amount of "sets" you have in your script. (Heres the limitation by TV) There cannot be more than 40 coins in each "set". The less coins you have per set, the quicker the script will startup and run, thus, the quicker alerts will be received if automating the process. Though, if you only have the free plan and can only have MAX 3 indicators per chart then the MAX you can screen at a time is 120 coins if you use 40 coins per set. So, this is the first one I would like to introduce. For this one your screener/scanner must be using some sort of plots as output that is being screened for. (original inspiration of ALL my variations mainly come from @QuantNomad, @daveatt, and @LonesomeTheBlue (and a few others I may be forgetting at the moment). Thanks for the inspiration through countless publications that ya'll have created for us in the community.
Some of my variations are more complex/elegant than others but there are MANY very different ones that I would like to share with the community. If you leave a comment and wonder why I have not responded but did so to every comment around yours...see if you are one of the individuals in this next few sentences...and if you are then perhaps someone else would like to waste their time responding to your comment...but basically, if you don't want to spend the time helping yourself by reading the title, description section, AND the comments section (at least scanning them) then I am MOST DEFINITELY not going to help you down your path of destruction that is most likely soon to be your blown-up trading account. I was called a "masochist" after asking for guidance on if its worth the headache to publish anything on TV bc there will NO DOUBT be comments that'll make me wish I didn't (ie. someone CLEARLY not reading the description (or seemingly even the title sometimes) bc they make a comment that has been explicitly addressed, or someone asking to rebuild the code compatible for another charting software or whatnot, or how about those asking if it repaints (this one is almost always addressed in the comments section but I can understand this question more than others as Im only 1 yr into learning any sort of coding for the first time in the beginning I saw people ask on EVERY script about if it repainted and it was worrisome at the lest (esp bc I didn't even understand what it was not so long ago, or my favorite...what TF it works best on...these people CLEARLY need not be trading yet if your still asking questions as such...Ill end it there). Point being, Ive got some truly VERY useful scripts that I want to share and as long as these people don't make me regret doing so in the beginning, then whats mine...will soon be yours. Though, I will take a little time between the releases.
YOU GUYS (TV and its community) ARE AWESOME (most of you anyways ;)
MUCH LOVE,
ChasinAlts
(1) INPUTS
Here is where the "sets" come in. I am looking at all of KUCOIN's Margin Coins (72 of them at least) so am splitting them up into 3 sets/iterations and a copy of the script must be added equal to amount of "sets" you have here. This is the ONLY workaround I have found to be able to scan/screen with more than 40 coins per script (due to TV's limitation of 40 Security Calls per script) ***So for everyone saying it's impossible scan more than 40 Coins per scipt...it' MOST DEFINITELY possible....BUT ONLY by adding this script multiple times on the chart and selecting 1 of each of the "sets" in the script settings via the chart window. To save the much needed room you must push each iteration of the script into 1 window and merging the scales of each into 1 scale(ie. "Scale A") within the settings of the script name on the chart(3 horizontal dots)
(2) FUNCTION
(2.1) COLORIDs
This is just to set up all my Colors of plots which are being matched with their respective labels. I have a diff color for each of the 72 coins Im plotting so Im telling the function, "depending on which set of coins I select...give me this color out of the colors I input later into the function"
(2.2) TICKERID CONSTRUCTION
I construct the tickerID this way so that the labels on my plots have only the Coin's name vs the label having the (Exchange Name):(Coin Name)(Base Pair Name). If you are using more than 1 Base pair (ie. XRP/BTC and XRP/USDT and XRP/ETH) OR more than 1 Exchange OR want your plots to show MORE THAN just the Trading Coin's name, then the tickerID MUST BE constructed differently
(2.3) SECURITY CALL & PLOT OUTPUT VARIABLES
If using a Higher Time Frame in Security Call then it MUST BE adjusted to permit or dissallow repainting if you so wish (BEYOND THE SCOPE OF THIS PUBLICATION so Do Your Own Researh). If your MAIN LOGIC is more complex than simply using a TV built-in function), THEN it MUST BE built into its own function outside of this function and called on within the "expression" slot of this Security Call OR can also be built into this function and called on in the "expression" slot of this Security call (BEYOND THE SCOPE OF THIS PUB SO DYOR). FURTHERMORE...when you are using a series(ie high/low/close/open/hl2/etc) / bar_index / time / etc that will be specific to the Coin/tickerID, then they MUST BE explicitly used within the "expression" slot of the Security Function when calling on your Main Logic or else it will pull the series/time/bar_index/etc from the Coin that the Chart is presently on (BEYOND THE SCOPE OF THIS PUB SO DYOR)
(2.4) PLOT LABEL
This is the Plot's Label that will be next to the end of the plot on the LAST bar_index. ***Notice in the "text" slot of the label I have "_coin" (without the quotes obviously)...this is where have JUST the Coin's name comes into effect on the label vs the (Exchange Name):(Coin Name)(Base Pair Name) which looks MUCH cleaner
(2.5) ALERT LOGIC / ALERT LABEL
Your alert logic need not be as complex as this... I just wanted to create a decent enough timing for this system and wanted to simply print the labels displaying which coin produced the alert at the same time the alerts would go off. Alert is set up to Trigger Bullish when the ROC is below the Threshold and _chg > _chg X=length of bars inputted in "Rising/Falling Length" setting and vise versa for Bearish Alerts. If _chg plot only goes past threshold for a VERY few amount of bars NOT providing enough time for initial Alert to trigger, then alert/label triggers on crossing of threshold back towards 0(zero). ONLY 1 alert needs to be set per script to be able to scan ALL 72 of the coins as I have them in this script. Timing of Alert is inline with the name label printed past the thresholds.
(3) VARIABLES FROM MAIN FUNCTION
This is the tuple of the Main Function that outputs the variables from 3 lines up to be able to plot the lines and color them according to the colors on the labels. *** As of now, we CANNOT plot from within the function so MUST BE done this way to produce the variables and colors needed. The plots are the ONLY thing in this script that cannot be executed from within the function
(4) LINE PLOTS
ALL output variables from our Main Function are used here for the line plots

Top 40 High Low Strategy for SPY, 5minThis strategy is developed based on my High Low Index SPY Top 40 indicator
Notes:
- this strategy is only developed for SPY on the 5 min chart . It seems to work with QQQ as well, but it isn't optimized for it
- P/L shown is based on 10 SPY option contracts, call or put, with strike price closest to the entry SPY price and expiry of 0 to 1 day. This includes commissions (can be changed). This is only an estimate calculated using an arbitrary multiplier factor, this can be changed in the setting
- P/L is based on $5000 initial capital
- Works with both regular / extended trading session turned on/off. However, max drawdown is 1/2 with extended trading session ON
- there is still a bug that doesn't allow alert to be created due to calculation error, will update once fixed
This strategy combines signals from the following indicators to determine entry signals:
- High Low Index SPY Top 40
- MACD
- Linear Regression Slope
Entry signal is triggered when:
- High Low Index line crosses the EMA line
- MACD trending in the same direction
- Linear Regression slope is accelerating above a threshold in the same direction, indicating a strong trend
Profit target(PT) and stop loss(SL) are determined using ATR value, with 2:1 Reward to Risk ratio as default.
Exit signal may be triggered prior to PT or SL trigger when:
- High Low Index SPY Top 40 shows a reversal after overbought or oversold conditions (optional)
- Opposite entry signal is triggered
There are a number of optional settings:
- Turn on/off "option trading", P/L will be calculated using share price only without multiplication factor for trading option contracts
- # of options per trade, default to 10
- Reinvest with profit made
- Trade with trailing SL after PT hit
- Take profit early based on Top 40 overbought/oversold
- Trade 0/1 day expiry. This will signal exit by the end of the day on Mon/Wed/Fri, and only exits 1/2 of positions (if in profit) on Tues/Thurs
- Can reduce the SL level without impacting PT
- No entry between 10:05 - 10:20 (don't ask me why, but statistically it performs better)
Consider donating me some of your profit if you make $$$ hahaha~ ;)
Enjoy~~

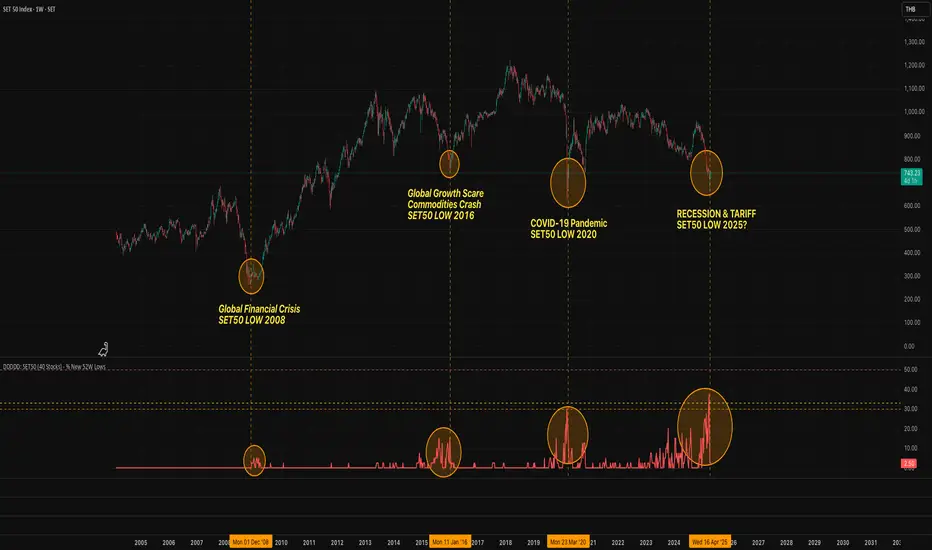
DDDDD: SET50 (40 Stocks) - % New 52W LowsDDDDD: SET50 - % New 52W Lows (40 Stocks)
This indicator measures the percentage of selected SET50 stocks making a new 52-week low, helping identify periods of extreme market fear that often align with long-term buying opportunities.
How It Works:
Tracks the daily closing prices of 40 major SET50 constituents.
A stock is counted when it closes at its lowest price over the past 252 trading days (approximately 1 year).
Calculates the percentage of new 52-week lows relative to 40 stocks.
Displays threshold lines to highlight levels of market panic.
📈 Threshold Levels:
Threshold Line Color Level (%) Interpretation Action
30% Threshold Orange 30% Early signs of stress Start monitoring opportunities
33% Threshold Yellow 33% Confirmed panic Consider gradual accumulation
50% Panic Zone Red 50% Extreme market panic Aggressive accumulation zone
📌 Important Notes:
Why not use the full 50 stocks?
Due to TradingView Pine Script's current technical limits, a script cannot request data for more than 40 symbols efficiently.
Therefore, this indicator uses 40 representative SET50 stocks to ensure optimal performance without exceeding system limits.
The selected stocks are diversified across major sectors to maintain reliability.
🔥 Key Insights:
Historically, spikes above 30%-50% of stocks making new lows have coincided with major market bottoms (e.g., 2011, 2020).
Higher simultaneous new lows = stronger potential for long-term recovery.
Volume Stack US Top 40 [Pt]█ Overview
Volume Stack US Top 40 is a versatile TradingView indicator designed to give you an at-a-glance view of market sentiment and volume dynamics across the top 40 U.S. large-cap stocks. Inspired by the popular Saty Volume Stack, this enhanced version aggregates essential volume and price strength data from major tickers on both the NYSE and NASDAQ, and works seamlessly on all timeframes.
█ Key Features
Dynamic Buy / Sell Volume Stack: This indicator dynamically stacks the volume bars so that the side with higher volume appears on top. For example, green over red signals more buy-side volume, while red over green indicates greater sell-side volume.
Cross-Market Analysis: Easily toggle between NYSE and NASDAQ to analyze the most influential U.S. stocks. The indicator automatically loads the correct set of tickers based on your selection.
Flexible Coverage: Choose from Top 10, Top 20, Top 30, or Top 40 tickers to tailor the tool to your desired scope of analysis.
Dynamic Table Display: A neat on-chart table lists the selected ticker symbols along with visual cues that reflect each stock’s strength. You can even remove exchange prefixes for a cleaner look.
█ Inputs & Settings
Market Selector: Choose whether to view data from the NYSE or NASDAQ; the indicator automatically loads the corresponding list of top tickers.
Number of Tickers: Select from ‘Top 10’, ‘Top 20’, ‘Top 30’, or ‘Top 40’ stocks to define the breadth of your analysis.
Color Options: Customize the colors for bullish and bearish histogram bars to suit your personal style.
Table Preferences: Adjust the on-chart table’s display style (grid or one row), text size, and decide whether to show exchange information alongside ticker symbols.
█ Usage & Benefits
Volume Stack US Top 40 is ideal for traders and investors who need a clear yet powerful tool to gauge overall market strength. By combining volume and price action data across multiple major stocks, it helps you:
Quickly assess whether the market sentiment is bullish or bearish.
Confirm trends by comparing volume patterns against intraday price movements.
Enhance your trading decisions with a visual representation of market breadth and dynamic buy/sell volume stacking.
Its intuitive design means you spend less time adjusting complex settings and more time making confident, informed decisions.

Market Sentiment Index US Top 40 [Pt]▮Overview
Market Sentiment Index US Top 40 [Pt} shows how the largest US stocks behave together. You pick one simple measure—High Low breakouts, Above Below moving average, or RSI overbought/oversold—and see how many of your chosen top 10/20/30/40 NYSE or NASDAQ names are bullish, neutral, or bearish.
This tool gives you a quick view of broad-market strength or weakness so you can time trades, confirm trends, and spot hidden shifts in market sentiment.
▮Key Features
► Three Simple Modes
High Low Index: counts stocks making new highs or lows over your lookback period
Above Below MA: flags stocks trading above or below their moving average
RSI Sentiment: marks overbought or oversold stocks and plots a small histogram
► Universe Selection
Top 10, 20, 30, or 40 symbols from NYSE or NASDAQ
Option to weight by market cap or treat all symbols equally
► Timeframe Choice
Use your chart’s timeframe or any intraday, daily, weekly, or monthly resolution
► Histogram Smoothing
Two optional moving averages on the sentiment bars
Markers show when the faster average crosses above or below the slower one
► Ticker Table
Optional on-chart table showing each ticker’s state in color
Grid or single-row layout with adjustable text size and color settings
▮Inputs
► Mode and Lookback
Pick High Low, Above Below MA, or RSI Sentiment
Set lookback length (for example 10 bars)
If using Above Below MA, choose the moving average type (EMA, SMA, etc.)
► Universe Setup
Market: NYSE or NASDAQ
Number of symbols: 10, 20, 30, or 40
Weights: on or off
Timeframe: blank to match chart or pick any other
► Moving Averages on Histogram
Enable fast and slow averages
Set their lengths and types
Choose colors for averages and markers
► Table Options
Show or hide the symbol table
Select text size: tiny, small, or normal
Choose layout: grid or one-row
Pick colors for bullish, neutral, and bearish cells
Show or hide exchange prefixes
▮How to Read It
► Sentiment Bars
Green means bullish
Red means bearish
Near zero means neutral
► Zero Line
Separates bullish from bearish readings
► High Low Line (High Low mode only)
Smooth ratio of highs versus lows over your lookback
► MA Crosses
Fast MA above slow MA hints rising breadth
Fast MA below slow MA hints falling breadth
► Ticker Table
Each cell colored green, gray, or red for bull, neutral, or bear
▮Use Cases
► Confirm Market Trends
Early warning when price makes highs but breadth is weak
Catch rallies when breadth turns strong while price is flat
► Spot Sector Rotation
Switch between NYSE and NASDAQ to see which group leads
Watch tech versus industrial breadth to track money flow
► Filter Trade Signals
Enter longs only when breadth is bullish
Consider shorts when breadth turns negative
► Combine with Other Indicators
Use RSI Sentiment with trend tools to spot overextended moves
Add volume indicators in High Low mode for breakout confirmation
► Timeframe Analysis
Daily for big-picture bias
Intraday (15-min) for precise entries and exits

Relative Strength Index(RSI)- Range (60-40)Custom RSI Indicator:
The Custom RSI Indicator is a technical analysis tool designed to assess the momentum of a financial instrument's price movements within a specified range. Unlike the traditional RSI, which typically operates within a range of 0 to 100, this customized version focuses on a narrower spectrum between 40 and 60, providing clearer signals for traders.
Key Features:
Bullish and Bearish Zones: The indicator delineates between bullish and bearish sentiment. When the RSI value climbs above 60, it signals bullish momentum, indicating potential uptrends in the price. Conversely, when the RSI dips below 40, it suggests bearish sentiment, signaling potential downtrends.
Overbought and Oversold Conditions: Additionally, the Custom RSI Indicator identifies extreme market conditions. When the RSI surpasses 80 , it denotes overbought territory, suggesting that the asset may be overvalued and prone to a reversal or correction. Conversely, when the RSI falls below 30 , it indicates oversold conditions, suggesting that the asset may be undervalued and ripe for a potential rebound.
Default RSI Comparison: The Custom RSI Indicator can be compared against the traditional RSI for added context. While the customized range provides more precise signals within the 60-40 spectrum, referencing the default RSI can offer broader insights into market dynamics.
Usage:
Trend Identification: Traders can utilize the Custom RSI Indicator to identify potential trend reversals or continuations based on shifts in momentum within the specified range.
Confirmation Tool: It can serve as a confirmation tool alongside other technical indicators or price action analysis, enhancing the overall reliability of trading decisions.
Risk Management: By recognizing overbought and oversold conditions, traders can implement risk management strategies such as setting stop-loss orders or adjusting position sizes to mitigate potential losses.
Conclusion:
The Custom RSI Indicator offers traders a focused perspective on market momentum within the 60-40 range, facilitating more accurate assessments of bullish and bearish sentiment as well as identifying extreme market conditions. By incorporating this tool into their analysis, traders can make informed decisions and potentially improve their trading outcomes.

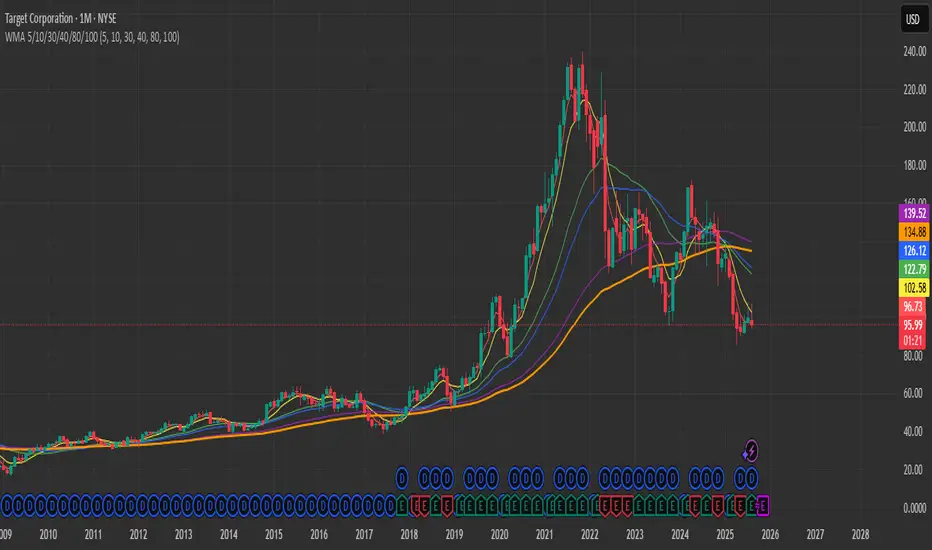
WMA 5/10/30/40/80/1006 WMAs on the chart: 5, 10, 30, 40, 80, and 100 — each in its own color.
This indicator plots multiple Weighted Moving Averages (WMA) on the price chart: 5, 10, 30, 40, 80, and 100.
Shorter WMAs (5 & 10) react quickly to price changes and are useful for short-term trend detection.
Longer WMAs (30, 40, 80, 100) help identify medium- to long-term trends and dynamic support/resistance zones.
Traders often watch for crossovers between short-term and long-term WMAs as potential trade signals.
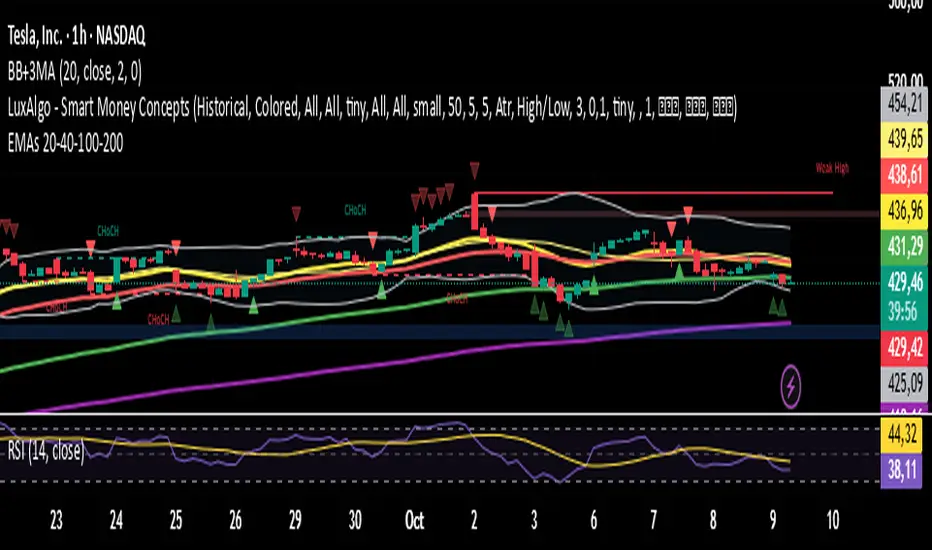
EMAs 20 - 40 - 100 - 200
This script contains the 20-40-100-200 EMAs.
EMA (Exponential)
Best for active or short-term trading because:
It adjusts more quickly to recent price changes.
It allows for earlier detection of trend reversals.
It is preferred by traders who trade calls and puts for a few days or weeks.
Example:
On 15-minute, 1-hour, or daily time frames, the 20-EMA or 40-EMA gives you early signals to open or close options.
It is good for momentum trades or quick breakouts.
指定周期 EMA (20, 40, 60, 80)This indicator allows you to display EMA (20, 40, 60, 80) from a higher timeframe directly on your current chart.
It helps you identify trend direction, confluence zones, and dynamic support/resistance based on multi-timeframe EMAs.
Features:
Choose any higher timeframe (e.g. 60 = 1H, 240 = 4H, D = 1D)
Plots 4 EMAs: 20, 40, 60, and 80
Works seamlessly across all timeframes
Ideal for trend confirmation and multi-timeframe analysis
💡 Tip:
Try viewing the 1H EMAs on a 15min chart or 4H EMAs on a 1H chart — this helps identify where price interacts with higher timeframe structure.

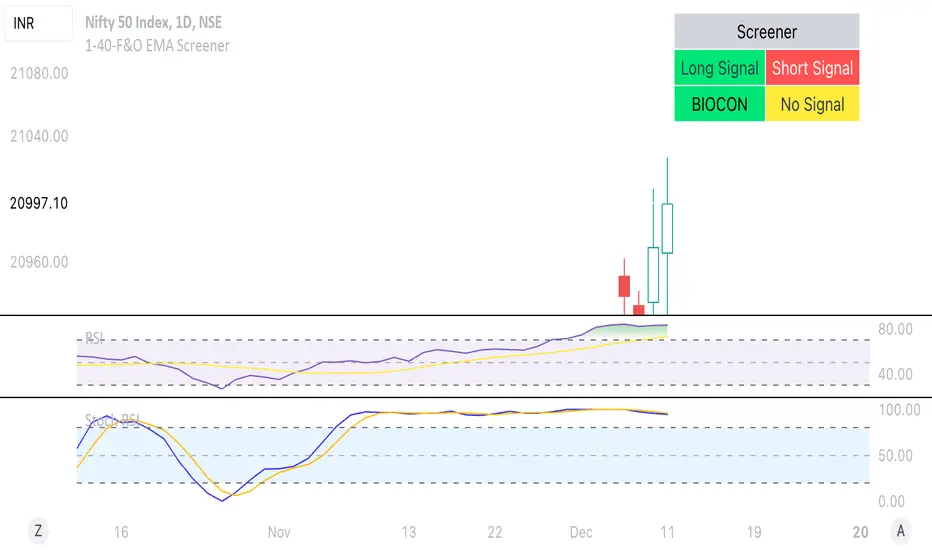
1-40-F&O EMA ScreenerThis Pine Script is a TradingView indicator named "1-40-F&O EMA Screener." It calculates and displays four moving averages (MA1, MA2, MA3, and MA4) and the Relative Strength Index (RSI) on a chart. The script generates buy and short signals based on certain conditions involving the moving averages and RSI. Additionally, it includes a screener section that displays a table of symbols with buy and short signals.
Here's a breakdown of the key components:
Moving Averages (MAs):
MA1: Simple Moving Average with length len1 (green line).
MA2: Simple Moving Average with length len2 (red line).
MA3: Simple Moving Average with length len3 (orange line).
MA4: Simple Moving Average with length len4 (black line).
Relative Strength Index (RSI):
The RSI is calculated with a length of rsiLengthInput and a source specified by rsiSourceInput.
Conditions for Buy and Short Signals:
Buy Signal: When MA1 is above MA2 and MA3, and RSI is above 50.
Short Signal: When MA1 is below MA2 and MA3, and RSI is below 50.
Signal Plots:
Buy signals are plotted as "B" below the corresponding bars.
Short signals are plotted as "S" above the corresponding bars.
Background Coloring:
Bars are colored based on their opening and closing prices.
Screener Section:
The script defines a watchlist (gticker) with 40 predefined symbols.
It then calls the getSignal function for each symbol to identify buy and short signals.
The results are displayed in a table with long signals in green and short signals in red.
Table Theming:
The script allows customization of the table's background, frame, and text colors, as well as the text size.
The table's location on the chart can also be customized.
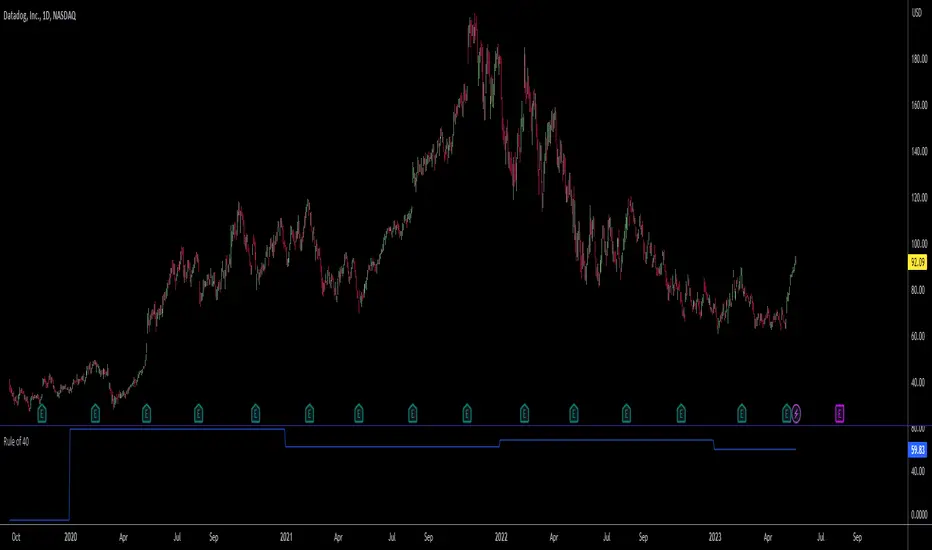
Rule of 40The rule of 40 is a popular metric for measuring the quality of SaaS companies. It measures growth and profitability. Companies are considered good if this sum is above 40.
It is the sum of the year over year sales growth and profit margin.
Rule of 40 = YoY sales growth + profit margin
EMA 5/8/13/40It contains 4 EMA lines, EMA -5/8/13/40
First 3 can be used for intraday as well as for twin trading.
EMA 40 can use used a reference to trend

Modulate 40 SymbolsModulates (multiplies) 40 securities
Useful for assessing breadth
Defaults with the Top 40 holdings in SPX
Change symbols to measure breadth in an ETF
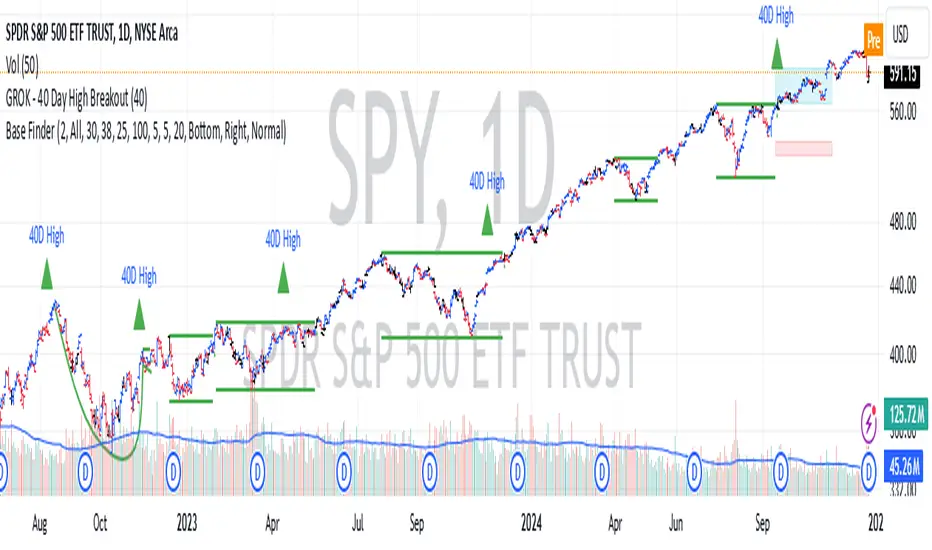
GROK - 40 Day High BreakoutTitle: GROK - Customizable High Breakout Detector
To scan base breakout with Pine Screener
Description:
This Pine Script indicator identifies high breakout patterns based on a user-defined lookback period. By default, it checks for a breakout of the 40-day high, but the period can be adjusted to suit your trading strategy. Key features include:
Custom Lookback Period: Easily modify the number of days for high breakout detection. Lookback period is length of base you want to scan using pine screener.
Visual Alerts: Displays a green triangle above the price bar when a breakout is detected.
Alert Conditions: Built-in alert notifications for automated breakout detection.
Screener Compatibility: Plots breakout signals as a histogram for screener use.
This script is ideal for traders looking to identify strong breakout patterns and incorporate them into their strategies.
How to Use:
Adjust the lookback period in the settings to match your desired breakout criteria.
Add alerts for automated notifications when a breakout is detected.
Use the visual markers and histogram to analyze breakout patterns on your chart.
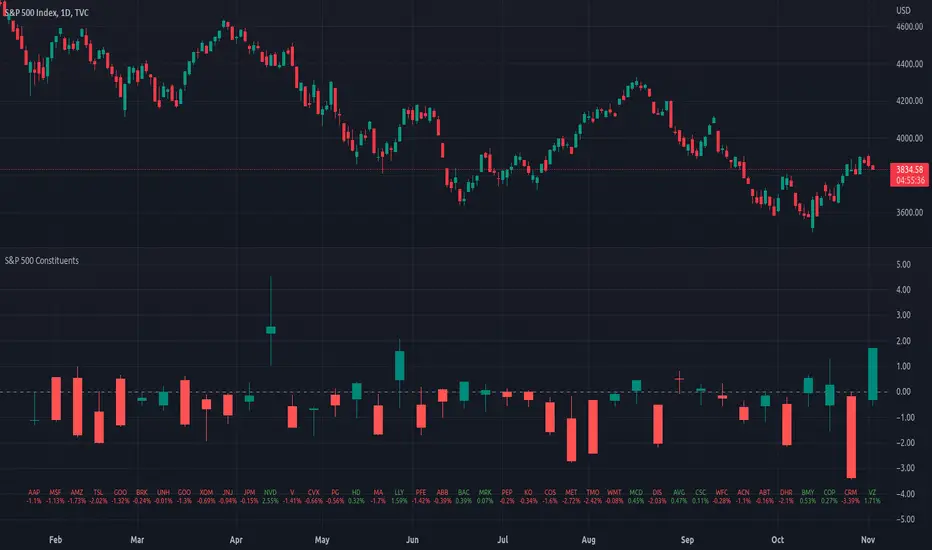
Top 40 constituents of S&P 500 IndexDisplays real-time candles of top 40 constituents of S&P 500 Index ( TVC:SPX ) for a given time frame, side-by-side. This gives an overall idea of breadth and depth of market movements in the time-frame.
Please note that, this is not a standard chart rendered bar-wise and may take time to load as it requests multiple securities. You could modify the contents, from settings, to include stocks from your portfolio or indices of different sectors.
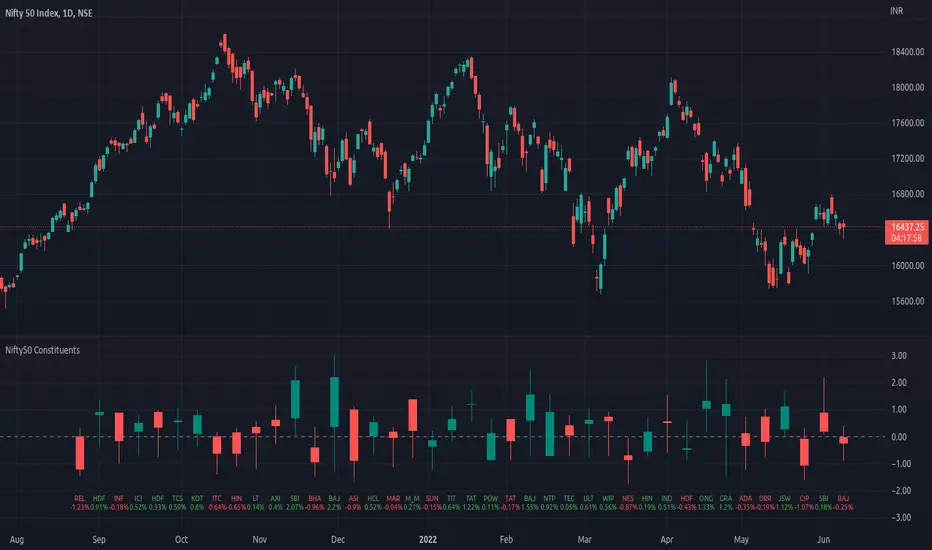
Top 40 constituents of Nifty50Displays real-time candles of top 40 constituents of Nifty50 for a given time frame, side-by-side. This gives an overall idea of breadth and depth of market movements in the time-frame.
Please note that, this is not a standard chart rendered bar-wise and may take time to load as it requests multiple securities. You could modify the contents, from settings, to include stocks from your portfolio or indices of different sectors.
NSE:NIFTY
Screener for 40+ instrumentsAs you probably know in TradingView there is a limit of 40 instruments in one custom screener.
I created a script that will allow you to scan more symbols.
The idea of it is pretty simple. You have to add a screener a few times on your screen with a different set of symbols. Then select column width (as % of your chart width) and # of the screener right to left.
Script will plot #1 screener next to the right border. For #2 and all next tables, the script will compute the needed offset and will draw it on the left. This way it will look like one table and not a few separate indicators.
I created a script with an RSI screener, but you can create more complicated examples with it.
Off course, that's not a silver bullet solution but might work for some of you.
Disclaimer
Please remember that past performance may not be indicative of future results.
Due to various factors, including changing market conditions, the strategy may no longer perform as well as in historical backtesting.
This post and the script don’t provide any financial advice.

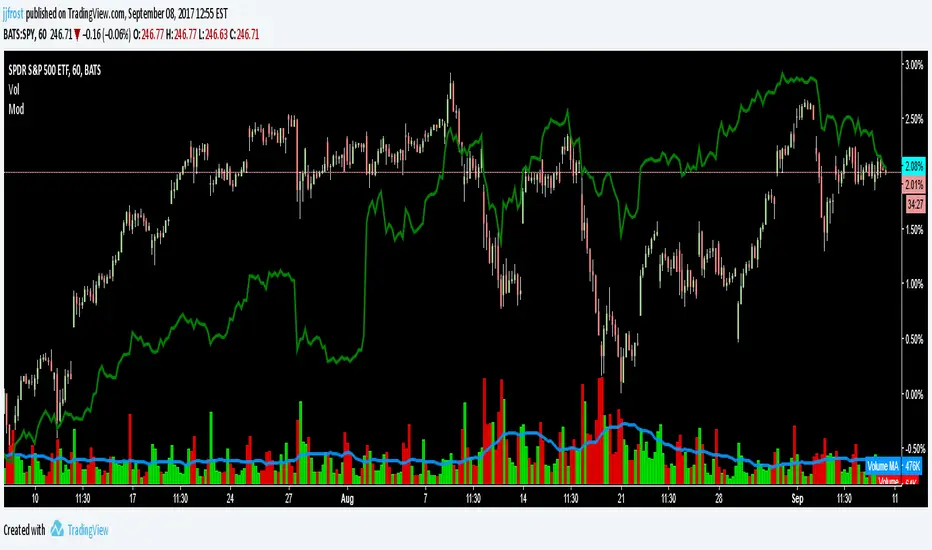
High Low Index SPY Top 40Modification from original code for "High Low Index" by © LonesomeTheBlue
- Made modification specifically for Top 40 AMEX:SPY holdings
- Added Market sentiment histogram (Total count green vs red), and SMA line for it
- Added arrows for peaks and dips on High Low Index and Market Sentiment MA
Idea behind this indicator is that SPY should follow the overall sentiment of its top holdings. I believe this bring great value to SPY traders.
Enjoy~!
