ابحث في النصوص البرمجية عن "纳斯达克期货cfd"

HTF Books Lines for LTF Charts
⸻
📜 日本語説明文
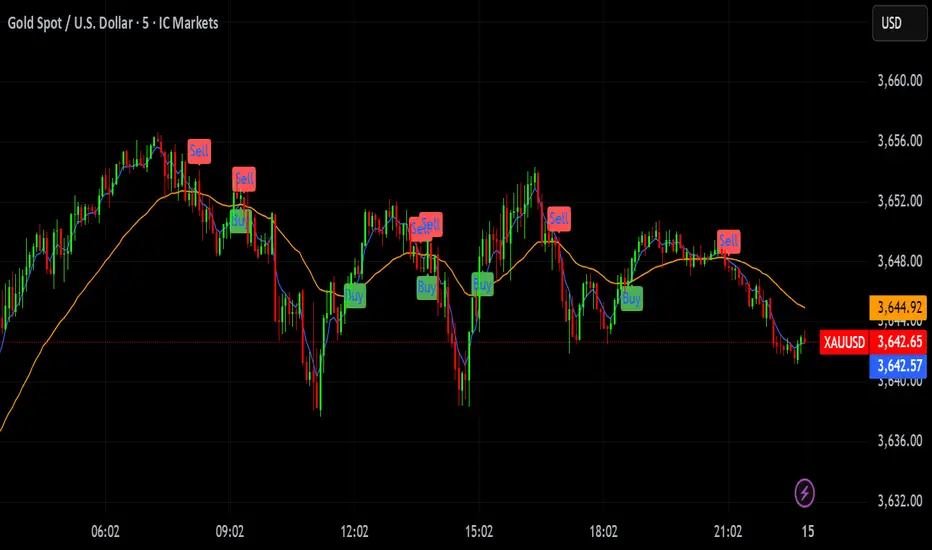
HTF Books Lines for LTF Charts
このインジケーターは、ゴールドの5分足に1時間足のBooksラインを表示するために作成しました。
ドルストレートの通貨ペアであれば同様に利用可能だと思います。
上位足で検出したBooksライン(買い/売り)を下位足チャートに重ねて表示し、ラインが有効である間は強調表示、無効化された際には無効化ラインとして残すことも可能です。
いずれの時間足でも使用できるため、ご自身のトレードスタイルに合わせて設定を切り替えて検証してみてください。
⸻
📜 English Description
HTF Books Lines for LTF Charts
This indicator was originally created to display 1-hour Books lines on the 5-minute chart of Gold (XAUUSD).
It should also work on other USD-related pairs (major dollar crosses).
The indicator plots higher-timeframe Books lines (buy/sell) directly onto a lower-timeframe chart. Active lines are displayed with strong emphasis, and once invalidated they can optionally remain as inactive lines.
It can be applied to any timeframe combination, so please test and adjust it according to your own trading style.
⸻

High Volume Candle Zones (Neutral)contact me i can give you want more information. you can spot patterns and key area are marked automatically to chart


High-and-Tight Impulse + Micro ConsolidationThis indicator detects a specific bullish continuation setup on daily charts:
- An impulse move (X% rise within N bars, mostly green candles)
- Immediately followed by a tight consolidation (small ranges, small bodies)
- Closes holding in the top zone of the impulse
On the chart, signals are plotted as orange dots above bars.
Labels show the last detected setup date, and a counter displays total matches in history.
Useful for backtesting "high-and-tight flag" type momentum patterns or any symbol.
Adjust inputs (impulse % threshold, bars, ATR ratios, top zone %) to make it stricter or looser.
Alerts are included when a new setup is detected.
This tool is not financial advice. For educational and research purposes only.
by fiyatherseydir

High Volume Candle Zones (Neutral)Contact the publisher to get full content into using this indicator to its full potential. Will help identify key areas in the market. Can be used on all time frames for confluence

VIX Stoch RSI Oscillator [HUD Box + Compression]vix stoch rsi Oscillator
watch volatility without switching charts,
gives signal based off fib levels 0-100 / volatility,
emoji box to show signal,
HUD Box: emoji-coded tactical feedback
bounce 100 "💥 Expansion" :
bounce 0.8 "🔴 Overbought" :
bounce 0.618 "📉 Distribution" :
bounce 0.5 "🧠 Midline" :
bounce 0.382 "📈 Accumulation" :
bounce 0.2 "🟢 Oversold" :
bounce0.0 "💣 Expansion" : "⚪ Neutral"
Tiger EMA/STOCH
This logic checks if the oscillator is trending above or below its 48-period EMA,
If above, it paints the line GREEN🟢 (bullish),
If below, it paints it RED🔴 (bearish),
If compression is active, it overrides both with purple🟣 to highlight tactical squeeze conditions,
⚠️WARNING⚠️
ALWAYS REMEMBER THIS CHART IS VIX/USD
IN MOST CASES SPY MOVES VICE VERSA
I AM NOT RESPOSIBLE FOR YOUR OWN ACTIONS/TRADE IDEAS
AMEX:USD
TVC:VIX
SP:SPX

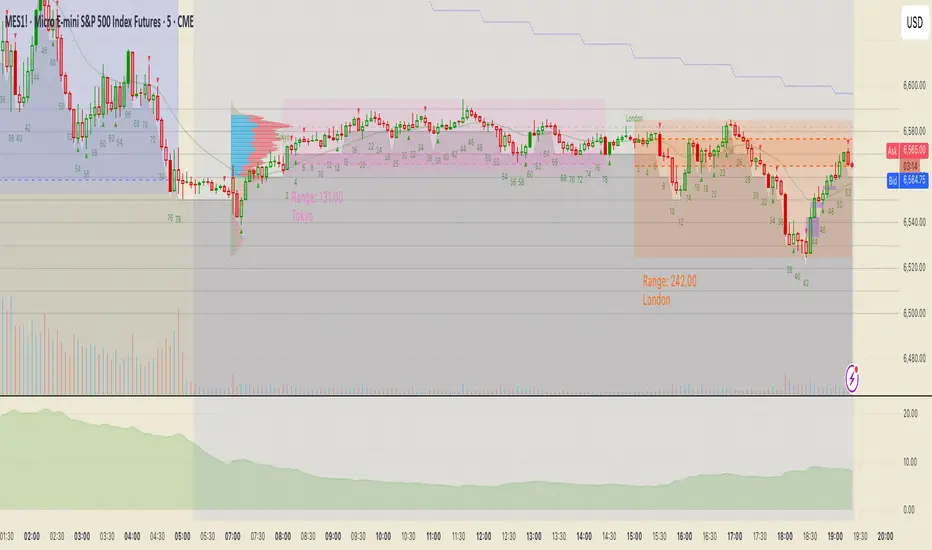
ICT Silver Bullet Zones (All Sessions, Custom Labels)CT Silver Bullet Zones
This indicator is designed for traders who follow the ICT *Silver Bullet* concept.
It automatically marks the **Silver Bullet window** (10:00–11:00 by default) across the **London, New York AM, New York PM, and Asia sessions**, with customizable settings for each session.
### Features:
* Separate adjustable time windows for **London, NY AM, NY PM, and Asia Silver Bullet sessions**.
* Colored session boxes with individual **opacity controls**.
* **Session labels placed at the top** of each zone, with customizable text size, color, and background opacity.
* Works on all timeframes and highlights only the Silver Bullet trading windows.
This tool is meant to help traders quickly identify ICT Silver Bullet opportunities in all major sessions without manual plotting.

GBB_lib_fiboLibrary "GBB_lib_fibo"
draw_fibo(high_point, low_point)
draw_fibo
/ @description Draws Fibonacci retracement lines between a high point and a low point.
/ @param high_point (float) Highest point of the move.
/ @param low_point (float) Lowest point of the move.
/ @returns (void) Draws lines on the chart.
Parameters:
high_point (float)
low_point (float)
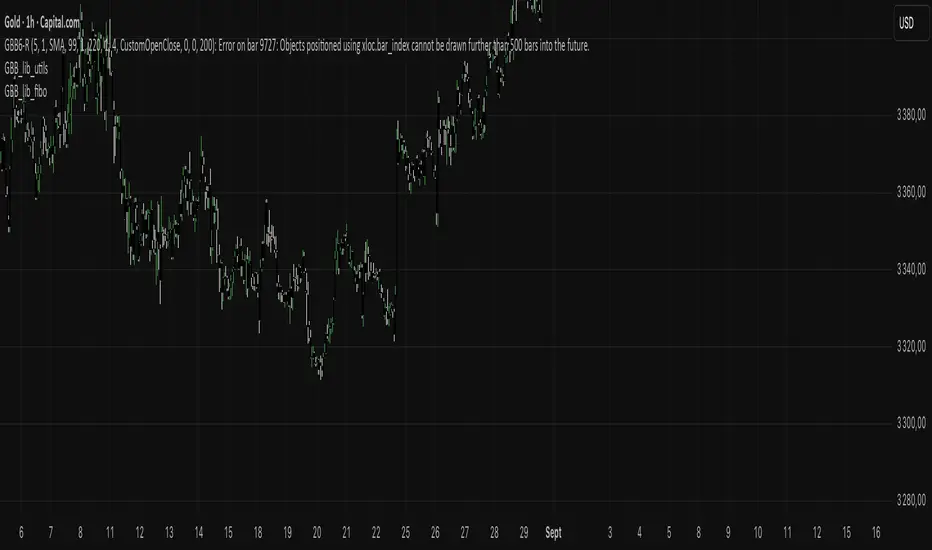
GBB_lib_utilsLibrary "GBB_lib_utils"
gbb_tf_to_display(tf_minutes, tf_string)
gbb_tf_to_display
/ @description Converts minutes and TF string into a short standard label.
/ @param tf_minutes (float)
/ @param tf_string (string)
/ @returns (string) Timeframe label (M1,H1,D1,...)
Parameters:
tf_minutes (float)
tf_string (string)
gbb_convert_bars(_bars)
gbb_convert_bars
/ @description Formats a number of bars into a duration (days, hours, minutes + bar count).
/ @param _bars (int)
/ @returns (string)
Parameters:
_bars (int)
gbb_goldorak_init(_tf5Levels_input)
gbb_goldorak_init
/ @description Builds a contextual message about the current timeframe and optional 5-level TF.
/ @param _tf5Levels_input (string) Alternative timeframe ("" = current timeframe).
/ @returns (string, string, float)
Parameters:
_tf5Levels_input (string)

GGB_lib_fiboLibrary "GGB_lib_fibo"
draw_fibo(high_point, low_point)
draw_fibo
/ @description Draws Fibonacci retracement lines between a high point and a low point.
/ @param high_point (float) Highest point of the move.
/ @param low_point (float) Lowest point of the move.
/ @returns (void) Draws lines on the chart.
Parameters:
high_point (float)
low_point (float)

ROAD200K Wickrange BarLaa umnuh laanii wick dotor haagdval
wick nii range ni uuruu sonirholiin bus bolj huvirdag

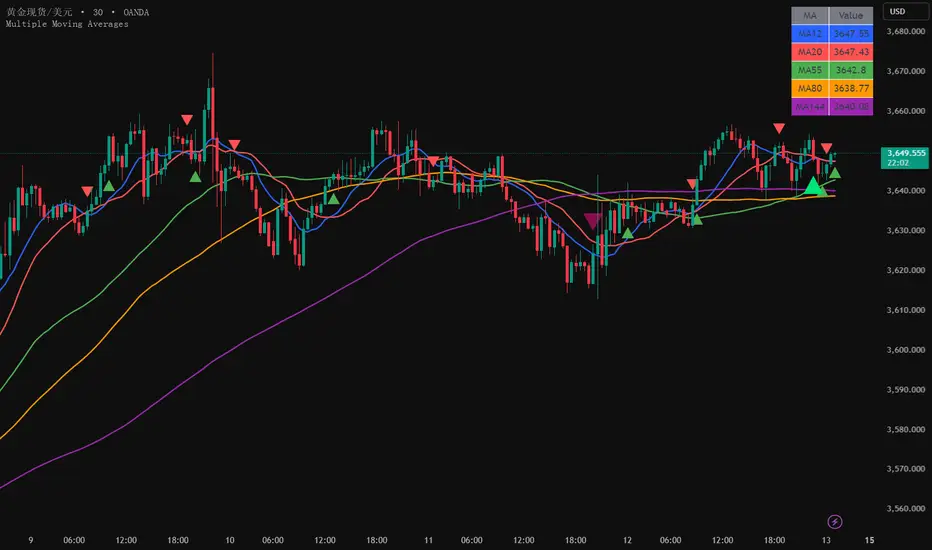
Multiple Moving Averages5 Simple Moving Averages: 12, 20, 55, 80, 144 periods
Different colors: Each moving average uses a different color for easy distinction
Crossover signals: Display crossover signals for MA12/MA20 and MA55/MA144
Value display: Show current specific values of each moving average in a table at the top right corner
Optional EMA: The commented section provides code for the EMA version, which can be uncommented if needed
Trend-Strong Candle - 3 EMAs with Filters# Trend-Strong Candle - Professional Trading Indicator
## 📊 What It Does
Identifies high-probability entries by combining triple EMA trend analysis with strong candle detection. Only signals when all conditions align for maximum accuracy.
## 🎯 Core Features
- Triple EMA System: Fast (20) / Medium (50) / Slow (200) for trend confirmation
- Strong Candle Filter: ATR-based sizing ensures genuine momentum
- Advanced Filters: EMA close validation + trend stability checks
- Live Alerts: Instant notifications for real-time signals
- Session Filter: Trade only during active EU/US market hours
## ⚡ Quick Setup
Scalping (1-5min): Default settings + enable session filter
Day Trading (15-60min): Default settings work perfectly
Swing Trading (4H+): Increase ATR multiplier to 0.8-1.0
## 📈 Trading Rules
Long Signals: Green triangle below candle
- Strong bullish candle during confirmed uptrend
- All EMAs properly aligned (Fast > Medium > Slow)
Short Signals: Red triangle above candle
- Strong bearish candle during confirmed downtrend
- All EMAs properly aligned (Fast < Medium < Slow)
## ⚠️ Critical Success Factors
1. Always Verify the Trend Yourself
The indicator helps identify signals, but YOU must confirm the larger trend context. Check higher timeframes and overall market structure before entering.
2. Understand the "Big Players"
Strong candles in trend direction usually come from institutional money (banks, funds, algorithms). These create the momentum that retail traders can follow. The indicator catches these institutional moves.
3. Distance to Next Value Level
NEVER enter if price is too close to major resistance/support levels:
- Check distance to round numbers (1.1000, 1.1050, etc.)
- Ensure at least 20-30 pips room to next key level
- You need space for profit - tight levels = limited upside
4. Risk Management
- Stop Loss: 1-2 ATR from entry
- Take Profit: 2-3 ATR target (minimum 1:2 R/R)
- Position Size: Risk max 1-2% per trade
## 💡 Pro Tips
- Best Sessions: London open (8-12 UTC) and NY open (13-17 UTC)
- Avoid: Major news, low liquidity periods, choppy markets
- Multiple Timeframes: Confirm signals on higher timeframe
- Value Levels: Always check daily/weekly support/resistance before entering
## 🎯 Success Formula
Trend Confirmation + Strong Institutional Candle + Distance to Value Levels = High Probability Trade
*
Remember: The indicator finds the signals, but successful trading requires your analysis of trend context and value level positioning. Trade smart, not just frequent.
