Dynamic Buy/Sell VisualizationDynamic Trend Visualization Indicator
Description:
This simple and easy to use indicator has helped me stay in trades longer.
This indicator is designed to visually represent potential buy and sell signals based on the crossover of two Simple Moving Averages (SMA). It's crafted to assist traders in identifying trend directions in a straightforward manner, making it an excellent tool for both beginners and experienced traders.
Features:
Customizable Moving Averages: Users can adjust the period length for both short-term (default: 10) and long-term (default: 50) SMAs to suit their trading strategy.
Visual Signals: Dynamic lines appear at the points of SMA crossover, with labels to indicate 'BUY' or 'SELL' opportunities.
Color and Style Customization: Customize the appearance of the buy and sell lines for better chart readability.
Alert Functionality: Alerts are set up to notify users when a crossover indicating a buy or sell condition occurs.
How It Works:
A 'BUY' signal is generated when the short-term SMA crosses above the long-term SMA, suggesting an upward trend.
A 'SELL' signal is indicated when the short-term SMA crosses below the long-term SMA, pointing to a potential downward trend.
Use Cases:
Trend Following: Ideal for markets with clear trends. For example, if trading EUR/USD on a daily chart, setting the short SMA to 10 days and the long SMA to 50 days might help in capturing longer-term trends.
Scalping: In a volatile market, setting shorter periods (e.g., 5 for short SMA and 20 for long SMA) might catch quicker trend changes, suitable for scalping.
Examples of how to use
* Short-term for Quick Trades:
SMA 5 and SMA 21:
Purpose: This combination is tailored for day traders or those looking to engage in scalping. The 5 SMA will react rapidly to price changes, providing early signals for buy or sell opportunities. The 21 SMA, being a Fibonacci number, offers a slightly longer-term view to confirm the short-term trend, helping to filter out minor fluctuations that might lead to false signals.
* Middle-term for Swing Trading:
SMA 10 and SMA 50:
Purpose: Suited for swing traders who aim to capitalize on medium-term trends. The 10 SMA picks up on immediate market movements, while the 50 SMA gives insight into the medium-term direction. This setup helps in identifying when a short-term trend aligns with a longer-term trend, providing a good balance for trades that might last several days to a couple of weeks.
* Long-term Trading:
SMA 50 and SMA 200:
Purpose: Investors focusing on long-term trends would benefit from this pair. The crossover of the 50 SMA over the 200 SMA can indicate the beginning or end of major market trends, ideal for making decisions about long-term holdings that might span months or years.
Example Strategy if not using the Buy / Sell Label Alerts:
Entry Signal: Enter a long position when the shorter SMA crosses above the longer SMA. For example:
SMA 10 crosses above SMA 50 for a medium-term bullish signal.
Exit Signal: Consider exiting or initiating a short position when:
SMA 10 crosses below SMA 50, suggesting a bearish turn in the medium-term trend.
Confirmation: Use these crossovers in conjunction with other indicators like volume or momentum indicators for better confirmation. For instance, if you're using the 5/21 combination, look for volume spikes on crossovers to confirm the move's strength.
When Not to Use:
Sideways or Range-Bound Markets: The indicator might generate many false signals in a non-trending market, leading to potential losses.
High Volatility Without Clear Trends: Rapid price movements without a consistent direction can result in misleading crossovers.
As a Standalone Tool: It should not be used in isolation. Combining with other indicators like RSI or MACD for confirmation can enhance trading decisions.
Practical Example:
Buy Signal: If you're watching Apple Inc. (AAPL) on a weekly chart, a crossover where the 10-week SMA moves above the 50-week SMA could suggest a buying opportunity, especially if confirmed by volume increase or other technical indicators.
Sell Signal: Conversely, if the 10-week SMA dips below the 50-week SMA, it might be time to consider selling, particularly if other bearish signals are present.
Conclusion:
The "Dynamic Trend Visualization" indicator provides a visual aid for trend-following strategies, offering customization and alert features to streamline the trading process. However, it's crucial to use this in conjunction with other analysis methods to mitigate the risks of false signals or market anomalies.
Legal Disclaimer:
This indicator is for educational purposes only. It does not guarantee profits or provide investment advice. Trading involves risk; please conduct thorough or consult with a financial advisor. The creator is not responsible for any losses incurred. By using this indicator, you agree to these terms.
ابحث في النصوص البرمجية عن "200亿美元是多少人民币"

Confluence StrategyOverview of Confluence Strategy
The Confluence Strategy in trading refers to the combination of multiple technical indicators, support/resistance levels, and chart patterns to identify high-probability trading opportunities. The idea is that when several indicators agree on a price movement, the likelihood of that movement being successful increases.
Key Components
Technical Indicators:
Moving Averages (MA): Commonly used to determine the trend direction. Look for crossovers (e.g., the 50-day MA crossing above the 200-day MA).
Relative Strength Index (RSI): Helps identify overbought or oversold conditions. A reading above 70 may indicate overbought conditions, while below 30 suggests oversold.
MACD (Moving Average Convergence Divergence): Useful for spotting changes in momentum. Look for MACD crossovers and divergence from price.
Support and Resistance Levels:
Identify key levels where price has historically reversed. These can be drawn from previous highs/lows, Fibonacci retracement levels, or psychological price levels.
Chart Patterns:
Patterns like head and shoulders, double tops/bottoms, or flags can indicate potential reversals or continuations in price.
Strategy Implementation
Set Up Your Chart:
Add the desired indicators (e.g., MA, RSI, MACD) to your TradingView chart.
Mark significant support and resistance levels.
Identify Confluence Points:
Look for situations where multiple indicators align. For instance, if the price is near a support level, the RSI is below 30, and the MACD shows bullish divergence, this may signal a buying opportunity.
Entry and Exit Points:
Entry: Place a trade when your confluence conditions are met. Use limit orders for better prices.
Exit: Set profit targets based on resistance levels or use trailing stops. Consider the risk-reward ratio to ensure your trades are favorable.
Risk Management:
Always implement stop-loss orders to protect against unexpected market moves. Position size should reflect your risk tolerance.
Example of a Confluence Trade
Setup:
Price approaches a strong support level.
RSI shows oversold conditions (below 30).
The 50-day MA is about to cross above the 200-day MA (bullish crossover).
Action:
Enter a long position as the conditions align.
Set a stop loss just below the support level and a take profit at the next resistance level.
Conclusion
The Confluence Strategy can significantly enhance trading accuracy by ensuring that multiple indicators support a trade decision. Traders on TradingView can customize their indicators and charts to fit their personal trading styles, making it a flexible approach to technical analysis.

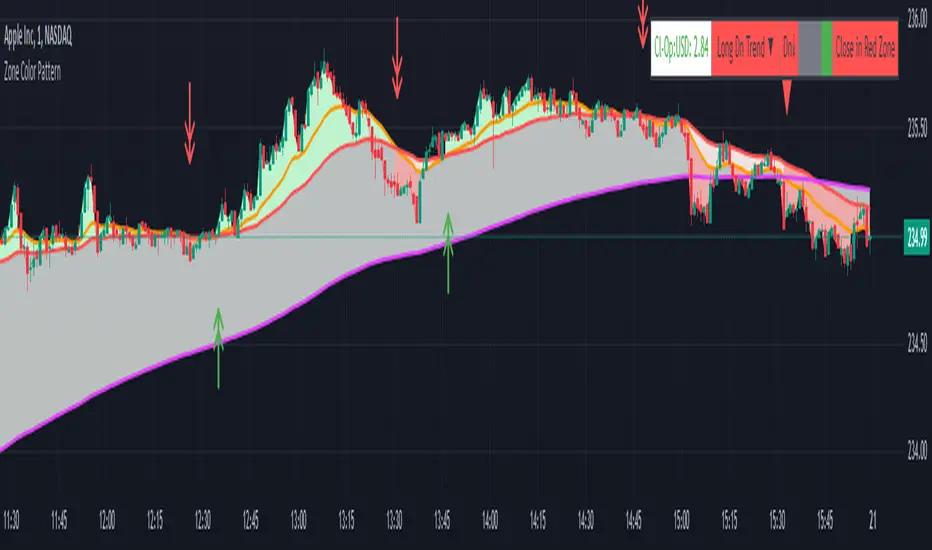
Zone Color PatternZone Color Pattern indicator depicts the color pattern of zones on chart. This will help the user to identify the zones on Chart.
Green Zone is indicated by Green color.
Red Zone is indicated by Red Color.
Gray Zone is indicated by Gray Zone.
Zone Color Pattern indicator is based on 3 moving averages. Long term, Medium term and Short Term.By default they are 200, 50 and 20.
When you are on long term trend the position of MAs is 20 MA is on top,then comes 50 MA and 200 MA is positioned below 50 MA.The position of respective MAs change during down trend.
The color patterns display the distance between different MAs .The widening and contraction of space between different Moving Averages indicate the movement and direction of price.
Basically price tend to move in and move away from Average. This action tend to create a space between price and MAs.Color patterns between price and MAs reflect the gap between the price and M|As .All these effects can be visualized on chart in relevant colors to infer the status of price, movement, cross over by the User.
Buy trades are preferred when close is in Green Zone and price is above MA20.
Sell trades are preferred when close is in Red Zone and price is below MA20
Trades may be avoided when close is in Gray Zone.
Long Up Trend and Down Trend respective color triangle shapes and arrows on chart indicate the trends and direction.
The chart understanding has to be supplemented with other regular indicators along with appropriate risk reward techniques by user.
Table indicate difference between Last Price traded and Day open price.
Other columns in table display the position of close in different Zones.
DISCLAIMER: For educational and entertainment purpose only .Nothing in this content should be interpreted as financial advice or a recommendation to buy or sell any sort of security/ies or investment/s.
CSVParser█ OVERVIEW
The library contains functions for parsing and importing complex CSV configurations (with a special simple syntax) into a special hierarchical object (of type objProps ) as follows:
Functions:
parseConfig() - reads CSV text into an objProps object.
toT() - displays the contents of an objProps object in a table form, which allows to check the CSV text for syntax errors.
getPropAr() - returns objProps.arS array for child object with `prop` key in mpObj map (or na if not found)
This library is handy in allowing users to store presets for the scripts and switch between them (see, e.g., my HTF moving averages script where users can switch between several preset configuations of 24 MA's across 5 timeframes).
█ HOW THE SCRIPT WORKS.
The script works as follows:
all values read from config text are stored as strings
Nested brackets in config text create a named nested objects of objProps0, ... , objProps9 types.
objProps objects of each level have the following fields:
- array arS for storing values without names (e.g. "12, 23" will be imported into a string array arS as )
- map mpS for storing items with names (e.g. "tf = 60, length = 21" will be imported as <"tf", "60"> and <"length", "21"> pairs into mpS )
- map mpObj for storing nested objects (e.g. "TF1(tf=60, length(21,50,100))" creates a <"TF1, objProps0 object> pair in mpObj map property of the top level object (objProps) , "tf=60" is stored as <"tf", "60"> key-value pair in mpS map property of a next level object (objProps0) and "length (...)" creates a <"length", objProps1> pair in objProps0.mpObj map while length values are stored in objProps1.arS array as strings. Every opening bracket creates a next level objProps object.
If objects or properties with duplicate names are encountered only the latest is imported
(e.g. for "TF1(length(12,22)), TF1(tf=240)" only "TF1(tf=240)" will be imported
Line breaks are not regarded as part of syntax (i.e. values are imported with line breaks, you can supply
symbols "(" , ")" , "," and "=" are special characters and cannot be used within property values (with the exception of a quoted text as a value of a property as explained below)
named properties can have quoted text as their value. In that case special characters within quotation marks are regarded as normal characters. Text between "=" and opening quotation mark as well as text following the closing quotation mark and until next property value is ignored. E.g. "quote = ignored "The quote" also ignored" will be imported as <"quote", "The quote">. Quotation marks within quotes must be excaped with "\" .
if a key names happens to be a multi-line then only first line containing non-space characters (trimmed from spaces) is taken as a key.
")," or ") ," and similar do not create an empty ("") array item while ",," does. (",)" creates an "" array item)
█ CSV CONFIGURATION SYNTAX
Unnamed values: just list them comma separated and they will be imported into arS of the object of the current level.
Named values: use "=" sign as follows: "property1=value1, property2 = value2"
Value of several objects: Use brackets after the name of the object ant list all object properties within the brackets (including its child objects if necessary). E.g. "TF1(tf =60, length(21,200), TF2(tf=240, length(50,200)"
Named and unnamed values as well as objects can go in any order. E.g. "12, tf=60, 21" will be imported as follows: "12", "21" will go to arS array and <"tf", "60"> will go to mpS maP of objProps (the top level object).
You can play around and test your config text using demo in this library, just edit your text in script settings and see how it is parsed into objProps objects.
█ USAGE RECOMMENDATIONS AND SAMPLE USE
I suggest the following approach:
- create functions for your UDT which can set properties by name.
- create enumerator functions which iterates through all the property names (supplied as a const string array) and imports their values into the object
█ SAMPLE USE
A sample use of this library can be seen in my Multi-timeframe 24 moving averages + BB+SAR+Supertrend+VWAP script where settings for the MAs across many timeframes are imported from CSV configurations (presets).
█ FULL LIST OF FUNCTIONS AND PROPERTIES
nzs(_s, nz)
Like nz() but for strings. Returns `nz` arg (default = "") if _s is na.
Parameters:
_s (string)
nz (string)
method init(this)
Initializes objProps obj (creates child maps and arrays)
Namespace types: objProps
Parameters:
this (objProps)
method toT(this, nz)
Outputs objProps to string matrices for further display using autotable().
Namespace types: objProps, objProps1, ..., objProps9
Parameters:
this (objProps/objProps1/..../objProps9)
nz (string)
Returns: A tuple - value, merge and color matrix (autotable() parameters)
method parseConfig(this, s)
Reads config text into objProps (unnamed values into arS, named into mpS, sub-levels into mpObj)
Namespace types: objProps
Parameters:
this (objProps)
s (string)
method getPropArS(this, prop)
Returns a string array of values for a given property name `prop`. Looks for a key `prop` in objProps.mpObj
if finds pair returns obj.arS, otherwise returns na. Returns a reference to the original, not a copy.
Namespace types: objProps, objProps1, ..., objProps8
Parameters:
this (objProps/objProps1/..../objProps8)
prop (string)
method getPropVal(this, prop, id)
Checks if there is an array of values for property `prop` and returns its `id`'s element or na if not found
Namespace types: objProps, objProps1, ..., objProps8
Parameters:
this (objProps/objProps1/..../objProps8) : objProps object containing array of property values in a child objProp object corresponding to propertty name.
prop (string) : (string) Name of the property
id (int) : (int) Id of the element to be returned from the array pf property values
objProps9 type
Object for storing values read from CSV relating to a particular object or property name.
Fields:
mpS (map) : (map() Stores property values as pairs
arS (array) : (string ) Array of values
objProps, objProps0, ... objProps8 types
Object for storing values read from CSV relating to a particular object or property name.
Fields:
mpS (map) : (map() Stores property values as pairs
arS (array) : (string ) Array of values
mpObj (map) : (map() Stores objProps objects containing properties's data as pairs

Custom Moving Average Ribbon with EMA Table & Text ColorComprehensive Description of the Custom Moving Average Ribbon with EMA Table & Text Color
The Custom Moving Average Ribbon with EMA Table & Text Color is a highly flexible and customizable indicator designed for traders who use multiple moving averages to assess trends, strength, and potential market reversals. It plots up to 8 moving averages (either SMA, EMA, WMA, or VWMA) on the price chart and displays a table summarizing the moving averages’ values, periods, and colors. The table also allows for the customization of the text color, making it easier to align with your chart’s theme or preference.
Key Features:
Multiple Moving Averages: You can display up to 8 moving averages (MA), each of which can be customized in terms of:
Type: SMA (Simple Moving Average), EMA (Exponential Moving Average), WMA (Weighted Moving Average), or VWMA (Volume-Weighted Moving Average).
Period: Each moving average has a user-defined period, which allows for flexibility depending on your trading style (short-term, medium-term, or long-term).
Enable/Disable: Each moving average can be independently enabled or disabled based on your preference.
Moving Average Ribbon: The indicator visualizes multiple moving averages as a ribbon, giving traders insight into the market's underlying trend. The interaction between these moving averages provides essential signals:
Uptrend: Shorter-term MAs above longer-term MAs, all sloping upward.
Downtrend: Shorter-term MAs below longer-term MAs, sloping downward.
Consolidation: MAs tightly packed, indicating low volatility or a sideways market.
Customizable Table: The indicator includes a table that displays:
The Name of each moving average (e.g., MA 1, MA 2, etc.).
The Period used for each moving average.
The Current Value of each moving average.
Color Coding for easier visual identification on the chart.
Text Color Customization: You can change the text color in the table to match your chart style or to ensure high visibility.
Responsive Design: This indicator works on any time frame, whether you're a day trader, swing trader, or long-term investor, and the table adjusts dynamically as new data comes in.
How to Use the Indicator
a) Trend Identification
The Custom Moving Average Ribbon helps in identifying trends and their strength. Here’s how you can interpret the plotted moving averages:
Uptrend (Bullish):
If the shorter-term moving averages (e.g., 5-period, 10-period) are above the longer-term moving averages (e.g., 50-period, 200-period), and all the MAs are sloping upward, it suggests a strong bullish trend.
The greater the separation between the moving averages, the stronger the uptrend.
Use the table to quickly verify the current value of each MA and confirm that the price is staying above most or all of the MAs.
Downtrend (Bearish):
When shorter-term moving averages are below the longer-term moving averages and all MAs are sloping downward, this indicates a bearish trend.
Greater separation between MAs indicates a stronger downtrend.
Neutral/Consolidating Market:
If the MAs are tightly packed and frequently crossing each other, the market is likely consolidating, and a strong trend is not in play.
In these situations, it’s better to wait for a clearer signal before taking any positions.
b) Reversal Signals
Golden Cross: When a short-term moving average (e.g., 50-period) crosses above a long-term moving average (e.g., 200-period), this is considered a bullish signal, suggesting a possible upward trend.
Death Cross: When a short-term moving average crosses below a long-term moving average, it’s considered a bearish signal, indicating a potential downward trend.
c) Using the Table for Quick Reference
The table allows you to monitor:
The current price value relative to each moving average. If the price is above most MAs, the market is likely in an uptrend, and if below, in a downtrend.
Changes in MA values: If you see values of shorter-term MAs moving closer to or crossing longer-term MAs, this could indicate a weakening trend or a potential reversal.
How to Combine this Indicator with Other Indicators for a Solid Strategy
The Custom Moving Average Ribbon is powerful on its own but can be enhanced when combined with other technical indicators to form a comprehensive trading strategy.
1. Combining with RSI (Relative Strength Index)
How It Works: RSI is a momentum oscillator that measures the speed and change of price movements, typically over 14 periods. It ranges from 0 to 100, with readings above 70 considered overbought and below 30 considered oversold.
Strategy:
Overbought in an Uptrend: If the moving average ribbon indicates an uptrend but the RSI shows the market is overbought (RSI > 70), it could signal a pullback or correction is imminent.
Oversold in a Downtrend: If the moving average ribbon indicates a downtrend but the RSI shows oversold conditions (RSI < 30), a bounce or reversal may be on the horizon.
2. Combining with MACD (Moving Average Convergence Divergence)
How It Works: MACD tracks the difference between two exponential moving averages, typically the 12-period and 26-period EMAs. It generates buy and sell signals based on crossovers and divergences.
Strategy:
Trend Confirmation: Use the MACD to confirm the direction and momentum of the trend indicated by the moving average ribbon. For example, if the MACD line crosses above the signal line while the shorter-term MAs are above the longer-term MAs, it confirms strong bullish momentum.
Divergences: Watch for divergences between price action and MACD. If price is making higher highs but MACD is making lower highs, it could signal a weakening trend, which you can verify using the moving averages.
3. Combining with Bollinger Bands
How It Works: Bollinger Bands plot two standard deviations above and below a moving average, typically the 20-period SMA. The bands widen during periods of high volatility and contract during periods of low volatility.
Strategy:
Breakout or Reversal: If price action moves above the upper Bollinger Band while the shorter-term MAs are crossing above the longer-term MAs, it confirms a strong breakout. Conversely, if price touches or falls below the lower Bollinger Band and the shorter MAs start crossing below the longer-term MAs, it indicates a potential breakdown.
Mean Reversion: In sideways markets, when the moving averages are tightly packed, Bollinger Bands can help spot mean reversion opportunities (buy near the lower band, sell near the upper band).
4. Combining with Volume Indicators
How It Works: Volume is a crucial confirmation indicator for any trend or breakout. Combining volume with the moving average ribbon can enhance your strategy.
Strategy:
Trend Confirmation: If the price breaks above the moving averages and is accompanied by high volume, it confirms a strong breakout. Similarly, if price breaks below the moving averages on high volume, it signals a strong downtrend.
Divergence: If price continues to trend in one direction but volume decreases, it could indicate a weakening trend, helping you prepare for a reversal.
Example Strategies Using the Indicator
Trend-Following Strategy:
Use the moving average ribbon to identify the main trend.
Combine with MACD or RSI for confirmation of momentum.
Enter trades when the shorter-term MAs confirm the trend and the confirmation indicator (MACD or RSI) aligns with the trend.
Exit trades when the moving averages start converging or when your confirmation indicator shows signs of reversal.
Reversal Strategy:
Wait for significant crossovers in the moving averages (Golden Cross or Death Cross).
Confirm the reversal with divergence in MACD or RSI.
Use Bollinger Bands to fine-tune your entry and exit points based on overbought/oversold conditions.
Conclusion
The Custom Moving Average Ribbon with EMA Table & Text Color indicator provides a robust framework for traders looking to use multiple moving averages to gauge trend direction, strength, and potential reversals. By combining it with other technical indicators like RSI, MACD, Bollinger Bands, and volume, you can develop a solid trading strategy that enhances accuracy, reduces false signals, and maximizes profit potential in various market conditions.
This indicator offers high flexibility with customization options, making it suitable for traders of all levels and strategies. Whether you're trend-following, scalping, or swing trading, this tool provides invaluable insights into market movements.

EMA GridThe EMA Grid indicator is a powerful tool that calculates the overall market sentiment by comparing the order of 20 different Exponential Moving Averages (EMAs) over various lengths. The indicator assigns a rating based on how well-ordered the EMAs are relative to each other, representing the strength and direction of the market trend. It also smooths out the macro movements using cumulative calculations and visually represents the market sentiment through color-coded bands.
EMA Calculation:
The indicator uses a series of EMAs with different lengths, starting from 5 and going up to 100. Each EMA is calculated either using the exponential moving averages.
The EMAs form the grid that the indicator uses to measure the order and distance between them.
Rating Calculation:
The indicator computes the relative distance between consecutive EMAs and sums these differences.
The cumulative sum is further smoothed using multiple EMAs with different lengths (from 3 to 21). This smooths out short-term fluctuations and helps identify broader trends.
Market Sentiment Rating:
The overall sentiment is calculated by comparing the values of these smoothing EMAs. If the shorter-term EMA is above the longer-term EMA, it contributes positively to the sentiment; otherwise, it contributes negatively.
The final rating is a normalized value based on the relationship between these EMAs, producing a sentiment score between 1 (bullish) and -1 (bearish).
Color Coding and Bands:
The indicator uses the sentiment rating to color the space between the 100 EMA and 200 EMA, representing the strength of the trend.
If the sentiment is bullish (rating > 0), the band is shaded green. If the sentiment is bearish (rating < 0), the band is shaded red.
The intensity of the color is based on the strength of the sentiment, with stronger trends resulting in more saturated colors.
Utility for Traders:
The EMA Grid is ideal for traders looking to gauge the broader market trend by analyzing the structure and alignment of multiple EMAs. The color-coded band between the 100 and 200 EMAs provides an at-a-glance view of market momentum, helping traders make informed decisions based on the trend's strength and direction.
This indicator can be used to identify bullish or bearish conditions and offers a smoothed perspective on market trends, reducing noise and highlighting significant trend shifts.

Bitcoin CME-Spot Z-Spread - Strategy [presentTrading]This time is a swing trading strategy! It measures the sentiment of the Bitcoin market through the spread of CME Bitcoin Futures and Bitfinex BTCUSD Spot prices. By applying Bollinger Bands to the spread, the strategy seeks to capture mean-reversion opportunities when prices deviate significantly from their historical norms
█ Introduction and How it is Different
The Bitcoin CME-Spot Bollinger Bands Strategy is designed to capture mean-reversion opportunities by exploiting the spread between CME Bitcoin Futures and Bitfinex BTCUSD Spot prices. The strategy uses Bollinger Bands to detect when the spread between these two correlated assets has deviated significantly from its historical norm, signaling potential overbought or oversold conditions.
What sets this strategy apart is its focus on spread trading between futures and spot markets rather than price-based indicators. By applying Bollinger Bands to the spread rather than individual prices, the strategy identifies price inefficiencies across markets, allowing traders to take advantage of the natural reversion to the mean that often occurs in these correlated assets.
BTCUSD 8hr Performance
█ Strategy, How It Works: Detailed Explanation
The strategy relies on Bollinger Bands to assess the volatility and relative deviation of the spread between CME Bitcoin Futures and Bitfinex BTCUSD Spot prices. Bollinger Bands consist of a moving average and two standard deviation bands, which help measure how much the spread deviates from its historical mean.
🔶 Spread Calculation:
The spread is calculated by subtracting the Bitfinex spot price from the CME Bitcoin futures price:
Spread = CME Price - Bitfinex Price
This spread represents the difference between the futures and spot markets, which may widen or narrow based on supply and demand dynamics in each market. By analyzing the spread, the strategy can detect when prices are too far apart (potentially overbought or oversold), indicating a trading opportunity.
🔶 Bollinger Bands Calculation:
The Bollinger Bands for the spread are calculated using a simple moving average (SMA) and the standard deviation of the spread over a defined period.
1. Moving Average (SMA):
The simple moving average of the spread (mu_S) over a specified period P is calculated as:
mu_S = (1/P) * sum(S_i from i=1 to P)
Where S_i represents the spread at time i, and P is the lookback period (default is 200 bars). The moving average provides a baseline for the normal spread behavior.
2. Standard Deviation:
The standard deviation (sigma_S) of the spread is calculated to measure the volatility of the spread:
sigma_S = sqrt((1/P) * sum((S_i - mu_S)^2 from i=1 to P))
3. Upper and Lower Bollinger Bands:
The upper and lower Bollinger Bands are derived by adding and subtracting a multiple of the standard deviation from the moving average. The number of standard deviations is determined by a user-defined parameter k (default is 2.618).
- Upper Band:
Upper Band = mu_S + (k * sigma_S)
- Lower Band:
Lower Band = mu_S - (k * sigma_S)
These bands provide a dynamic range within which the spread typically fluctuates. When the spread moves outside of these bands, it is considered overbought or oversold, potentially offering trading opportunities.
Local view
🔶 Entry Conditions:
- Long Entry: A long position is triggered when the spread crosses below the lower Bollinger Band, indicating that the spread has become oversold and is likely to revert upward.
Spread < Lower Band
- Short Entry: A short position is triggered when the spread crosses above the upper Bollinger Band, indicating that the spread has become overbought and is likely to revert downward.
Spread > Upper Band
🔶 Risk Management and Profit-Taking:
The strategy incorporates multi-step take profits to lock in gains as the trade moves in favor. The position is gradually reduced at predefined profit levels, reducing risk while allowing part of the trade to continue running if the price keeps moving favorably.
Additionally, the strategy uses a hold period exit mechanism. If the trade does not hit any of the take-profit levels within a certain number of bars, the position is closed automatically to avoid excessive exposure to market risks.
█ Trade Direction
The trade direction is based on deviations of the spread from its historical norm:
- Long Trade: The strategy enters a long position when the spread crosses below the lower Bollinger Band, signaling an oversold condition where the spread is expected to narrow.
- Short Trade: The strategy enters a short position when the spread crosses above the upper Bollinger Band, signaling an overbought condition where the spread is expected to widen.
These entries rely on the assumption of mean reversion, where extreme deviations from the average spread are likely to revert over time.
█ Usage
The Bitcoin CME-Spot Bollinger Bands Strategy is ideal for traders looking to capitalize on price inefficiencies between Bitcoin futures and spot markets. It’s especially useful in volatile markets where large deviations between futures and spot prices occur.
- Market Conditions: This strategy is most effective in correlated markets, like CME futures and spot Bitcoin. Traders can adjust the Bollinger Bands period and standard deviation multiplier to suit different volatility regimes.
- Backtesting: Before deployment, backtesting the strategy across different market conditions and timeframes is recommended to ensure robustness. Adjust the take-profit steps and hold periods to reflect the trader’s risk tolerance and market behavior.
█ Default Settings
The default settings provide a balanced approach to spread trading using Bollinger Bands but can be adjusted depending on market conditions or personal trading preferences.
🔶 Bollinger Bands Period (200 bars):
This defines the number of bars used to calculate the moving average and standard deviation for the Bollinger Bands. A longer period smooths out short-term fluctuations and focuses on larger, more significant trends. Adjusting the period affects the responsiveness of the strategy:
- Shorter periods (e.g., 100 bars): Makes the strategy more reactive to short-term market fluctuations, potentially generating more signals but increasing the risk of false positives.
- Longer periods (e.g., 300 bars): Focuses on longer-term trends, reducing the frequency of trades and focusing only on significant deviations.
🔶 Standard Deviation Multiplier (2.618):
The multiplier controls how wide the Bollinger Bands are around the moving average. By default, the bands are set at 2.618 standard deviations away from the average, ensuring that only significant deviations trigger trades.
- Higher multipliers (e.g., 3.0): Require a more extreme deviation to trigger trades, reducing trade frequency but potentially increasing the accuracy of signals.
- Lower multipliers (e.g., 2.0): Make the bands narrower, increasing the number of trade signals but potentially decreasing their reliability.
🔶 Take-Profit Levels:
The strategy has four take-profit levels to gradually lock in profits:
- Level 1 (3%): 25% of the position is closed at a 3% profit.
- Level 2 (8%): 20% of the position is closed at an 8% profit.
- Level 3 (14%): 15% of the position is closed at a 14% profit.
- Level 4 (21%): 10% of the position is closed at a 21% profit.
Adjusting these take-profit levels affects how quickly profits are realized:
- Lower take-profit levels: Capture gains more quickly, reducing risk but potentially cutting off larger profits.
- Higher take-profit levels: Let trades run longer, aiming for bigger gains but increasing the risk of price reversals before profits are locked in.
🔶 Hold Days (20 bars):
The strategy automatically closes the position after 20 bars if none of the take-profit levels are hit. This feature prevents trades from being held indefinitely, especially if market conditions are stagnant. Adjusting this:
- Shorter hold periods: Reduce the duration of exposure, minimizing risks from market changes but potentially closing trades too early.
- Longer hold periods: Allow trades to stay open longer, increasing the chance for mean reversion but also increasing exposure to unfavorable market conditions.
By understanding how these default settings affect the strategy’s performance, traders can optimize the Bitcoin CME-Spot Bollinger Bands Strategy to their preferences, adapting it to different market environments and risk tolerances.

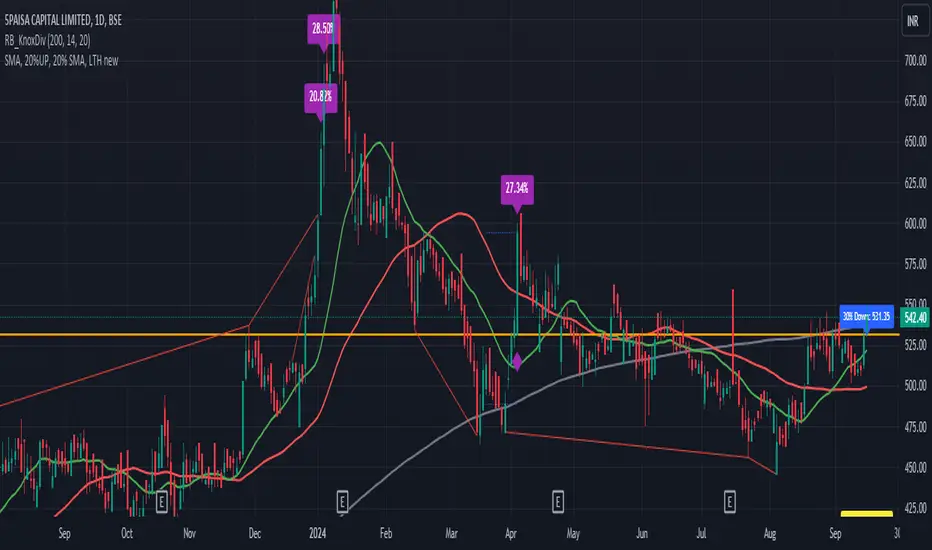
SMA, 20%UP, 20% SMA, LTH newFeatures:
Simple Moving Averages (SMAs):
200 SMA (Gray): Long-term trend indicator. A widely used benchmark in many trading strategies.
50 SMA (Red): Mid-term trend indicator.
20 SMA (Green): Short-term trend indicator. These three SMAs allow traders to visualize the general market trend over different time horizons.
20% Gain on Green Candles:
This feature tracks continuous green candles and calculates the percentage gain from the lowest low to the highest high in that series.
If the gain is greater than or equal to 20%, the script highlights it with a purple triangle above the candle.
If the series of green candles starts with a candle where the low is below the 200 SMA, a purple diamond appears under the bar, indicating potential strong buying signals.
Lifetime High (LTH):
The script automatically tracks and displays the Lifetime High (LTH), i.e., the highest price ever recorded on the chart.
This level is important for identifying potential resistance areas and monitoring long-term market tops.
Once a new LTH is reached, it is displayed as a green line across the chart.
Support Levels from LTH:
The script calculates 30%, 50%, and 67% down from the LTH, marking key support levels.
These levels are plotted on the chart as orange lines and labeled to assist in spotting potential buy zones or market reversals.
52-Week Low:
It also calculates and displays the 52-week low for quick reference, plotted as a green line.
This helps traders assess major market bottoms and potential areas of support.
DCA, Support and Resistance with RSI and Trend FilterThis script is based on
script from Kieranj with added pyramiding and DCA
The buy condition (buyCondition) is triggered when the RSI crosses above the oversold threshold (ta.crossover(rsi, oversoldThreshold)), the trend filter confirms an uptrend (isUptrend is true), and the close price is greater than or equal to the support level (close >= supportLevel).
The partial sell condition (sellCondition) is triggered when the RSI crosses below the overbought threshold (ta.crossunder(rsi, overboughtThreshold)) and profit goal is reached, the trend filter confirms a downtrend (isUptrend is false), and the close price is less than or equal to the resistance level (close <= resistanceLevel).
Full sell will be triggered if trend is broken and profit goal is reached
With this implementation, the signals will only be generated in the direction of the trend on the 4-hour timeframe. The trend is considered up when the 50-period SMA is below the 200-period SMA (ta.sma(trendFilterSource, 50) < ta.sma(trendFilterSource, 200)).
Pyramiding should be activated, values like 100, so every DCA step should be around 1%
i have best results on 5 min charts
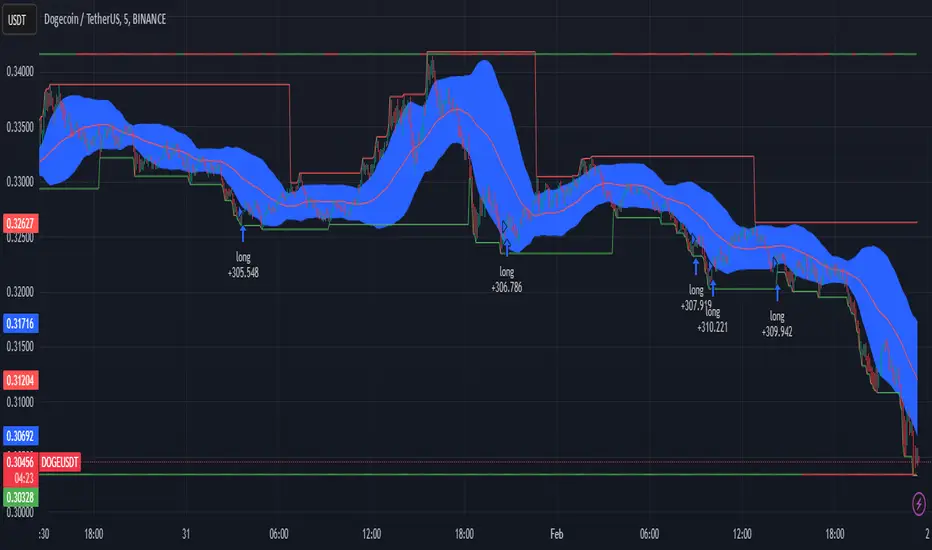
Curved Price Channels (Zeiierman)█ Overview
The Curved Price Channels (Zeiierman) is designed to plot dynamic channels around price movements, much like the traditional Donchian Channels, but with a key difference: the channels are curved instead of straight. This curvature allows the channels to adapt more fluidly to price action, providing a smoother representation of the highest high and lowest low levels.
Just like Donchian Channels, the Curved Price Channels help identify potential breakout points and areas of trend reversal. However, the curvature offers a more refined approach to visualizing price boundaries, making it potentially more effective in capturing price trends and reversals in markets that exhibit significant volatility or price swings.
The included trend strength calculation further enhances the indicator by offering insight into the strength of the current trend.
█ How It Works
The Curved Price Channels are calculated based on the asset's average true range (ATR), scaled by the chosen length and multiplier settings. This adaptive size allows the channels to expand and contract based on recent market volatility. The central trendline is calculated as the average of the upper and lower curved bands, providing a smoothed representation of the overall price trend.
Key Calculations:
Adaptive Size: The ATR is used to dynamically adjust the width of the channels, making them responsive to changes in market volatility.
Upper and Lower Bands: The upper band is calculated by taking the maximum close value and adjusting it downward by a factor proportional to the ATR and the multiplier. Similarly, the lower band is calculated by adjusting the minimum close value upward.
Trendline: The trendline is the average of the upper and lower bands, representing the central tendency of the price action.
Trend Strength
The Trend Strength feature in the Curved Price Channels is a powerful feature designed to help traders gauge the strength of the current trend. It calculates the strength of a trend by analyzing the relationship between the price's position within the curved channels and the overall range of the channels themselves.
Range Calculation:
The indicator first determines the distance between the upper and lower curved channels, known as the range. This range represents the overall volatility of the price within the given period.
Range = Upper Band - Lower Band
Relative Position:
The next step involves calculating the relative position of the closing price within this range. This value indicates where the current price sits in relation to the overall range.
RelativePosition = (Close - Trendline) / Range
Normalization:
To assess the trend strength over time, the current range is normalized against the maximum and minimum ranges observed over a specified look-back period.
NormalizedRange = (Range - Min Range) / (Max Range - Min Range)
Trend Strength Calculation:
The final Trend Strength is calculated by multiplying the relative position by the normalized range and then scaling it to a percentage.
TrendStrength = Relative Position * Normalized Range * 100
This approach ensures that the Trend Strength not only reflects the direction of the trend but also its intensity, providing a more comprehensive view of market conditions.
█ Comparison with Donchian Channels
Curved Price Channels offer several advantages over Donchian Channels, particularly in their ability to adapt to changing market conditions.
⚪ Adaptability vs. Fixed Structure
Donchian Channels: Use a fixed period to plot straight lines based on the highest high and lowest low. This can be limiting because the channels do not adjust to volatility; they remain the same width regardless of how much or how little the price is moving.
Curved Price Channels: Adapt dynamically to market conditions using the Average True Range (ATR) as a measure of volatility. The channels expand and contract based on recent price movements, providing a more accurate reflection of the market's current state. This adaptability allows traders to capture both large trends and smaller fluctuations more effectively.
⚪ Sensitivity to Market Movements
Donchian Channels: Are less sensitive to recent price action because they rely on a fixed look-back period. This can result in late signals during fast-moving markets, as the channels may not adjust quickly enough to capture new trends.
Curved Price Channels: Respond more quickly to changes in market volatility, making them more sensitive to recent price action. The multiplier setting further allows traders to adjust the channel's sensitivity, making it possible to capture smaller price movements during periods of low volatility or filter out noise during high volatility.
⚪ Enhanced Trend Strength Analysis
Donchian Channels: Do not provide direct insight into the strength of a trend. Traders must rely on additional indicators or their judgment to gauge whether a trend is strong or weak.
Curved Price Channels: Includes a built-in trend strength calculation that takes into account the distance between the upper and lower channels relative to the trendline. A broader range between the channels typically indicates a stronger trend, while a narrower range suggests a weaker trend. This feature helps traders not only identify the direction of the trend but also assess its potential longevity and strength.
⚪ Dynamic Support and Resistance
Donchian Channels: Offer static support and resistance levels that may not accurately reflect changing market dynamics. These levels can quickly become outdated in volatile markets.
Curved Price Channels: Offer dynamic support and resistance levels that adjust in real-time, providing more relevant and actionable trading signals. As the channels curve to reflect price movements, they can help identify areas where the price is likely to encounter support or resistance, making them more useful in volatile or trending markets.
█ How to Use
Traders can use the Curved Price Channels in similar ways to Donchian Channels but with the added benefits of the adaptive, curved structure:
Breakout Identification:
Just like Donchian Channels, when the price breaks above the upper curved band, it may signal the start of a bullish trend, while a break below the lower curved band could indicate a bearish trend. The curved nature of the channels helps in capturing these breakouts more precisely by adjusting to recent volatility.
Volatility:
The width of the price channels in the Curved Price Channels indicator serves as a clear indicator of current market volatility. A wider channel indicates that the market is experiencing higher volatility, as prices are fluctuating more dramatically within the period. Conversely, a narrower channel suggests that the market is in a lower volatility state, with price movements being more subdued.
Typically, higher volatility is observed during negative trends, where market uncertainty or fear drives larger price swings. In contrast, lower volatility is often associated with positive trends, where prices tend to move more steadily and predictably. The adaptive nature of the Curved Price Channels reflects these volatility conditions in real time, allowing traders to assess the market environment quickly and adjust their strategies accordingly.
Support and Resistance:
The trend line act as dynamic support and resistance levels. Due to it's adaptive nature, this level is more reflective of the current market environment than the fixed level of Donchian Channels.
Trend Direction and Strength:
The trend direction and strength are highlighted by the trendline and the directional candle within the Curved Price Channels indicator. If the price is above the trendline, it indicates a positive trend, while a price below the trendline signals a negative trend. This directional bias is visually represented by the color of the directional candle, making it easy for traders to quickly identify the current market trend.
In addition to the trendline, the indicator also displays Max and Min values. These represent the highest and lowest trend strength values within the lookback period, providing a reference point for understanding the current trend strength relative to historical levels.
Max Value: Indicates the highest recorded trend strength during the lookback period. If the Max value is greater than the Min value, it suggests that the market has generally experienced more positive (bullish) conditions during this time frame.
Min Value: Represents the lowest recorded trend strength within the same period. If the Min value is greater than the Max value, it indicates that the market has been predominantly negative (bearish) over the lookback period.
By assessing these Max and Min values, traders gain an immediate understanding of the underlying trend. If the current trend strength is close to the Max value, it indicates a strong bullish trend. Conversely, if the trend strength is near the Min value, it suggests a strong bearish trend.
█ Settings
Trend Length: Defines the number of bars used to calculate the core trendline and adaptive size. A length of 200 will create a smooth, long-term trendline that reacts slowly to price changes, while a length of 20 will create a more responsive trendline that tracks short-term movements.
Multiplier: Adjusts the width of the curved price channels. A higher value tightens the channels, making them more sensitive to price movements, while a lower value widens the channels. A multiplier of 10 will create tighter channels that are more sensitive to minor price fluctuations, which is useful in low-volatility markets. A multiplier of 2 will create wider channels that capture larger trends and are better suited for high-volatility markets.
Trend Strength Length: Defines the period over which the maximum and minimum ranges are calculated to normalize the trend strength. A length of 200 will smooth out the trend strength readings, providing a stable indication of trend health, whereas a length of 50 will make the readings more reactive to recent price changes.
-----------------
Disclaimer
The information contained in my Scripts/Indicators/Ideas/Algos/Systems does not constitute financial advice or a solicitation to buy or sell any securities of any type. I will not accept liability for any loss or damage, including without limitation any loss of profit, which may arise directly or indirectly from the use of or reliance on such information.
All investments involve risk, and the past performance of a security, industry, sector, market, financial product, trading strategy, backtest, or individual's trading does not guarantee future results or returns. Investors are fully responsible for any investment decisions they make. Such decisions should be based solely on an evaluation of their financial circumstances, investment objectives, risk tolerance, and liquidity needs.
My Scripts/Indicators/Ideas/Algos/Systems are only for educational purposes!

Entropy Indicator [CHE]Entropy in Technical Analysis Using TradingView
Slide 1: Title
Entropy in Technical Analysis Using TradingView
Introduction to the concept of entropy
Application in technical analysis
Understanding the use of entropy as a market indicator
Slide 2: What is Entropy?
Definition and Origins:
Entropy originates from thermodynamics and information theory.
In thermodynamics, entropy describes the degree of disorder or randomness in a system.
In information theory, entropy quantifies the uncertainty or unpredictability of information content.
Mathematical Definition:
Entropy measures the unpredictability of a system.
The basic idea: Higher entropy means more randomness; lower entropy indicates more predictability.
Formula: Entropy is calculated using the probabilities of different outcomes, based on how frequently certain price levels are reached.
Slide 3: Entropy in Financial Markets
Why Entropy Matters:
Market Uncertainty: Entropy can measure the level of uncertainty or randomness in financial markets.
Volatility Indicator: High entropy may indicate a volatile, unpredictable market, while low entropy suggests a stable, predictable market.
Applications in Trading:
Trend Analysis: Identifying periods of high entropy can help detect potential trend reversals or periods of market consolidation.
Risk Management: Using entropy to adjust trading strategies based on the perceived level of market uncertainty.
Slide 4: How Entropy is Calculated in Trading
Step-by-Step Process:
Data Collection:
The first step is to gather the relevant price data over a specific period, such as 200 closing prices. This data forms the basis of the entropy calculation, representing the market's recent behavior.
Defining Bins:
The price range within the collected data is divided into a fixed number of bins or intervals. These bins represent different price levels. For instance, if you choose 5 bins, the price range will be split into 5 equal segments.
Assigning Data to Bins:
The next step is to assign each price within the data to one of these bins. This step helps in understanding how frequently the price falls within specific ranges, indicating the distribution of prices over the period.
Calculating Probabilities:
After assigning the data to bins, calculate the probability for each bin by dividing the number of data points in each bin by the total number of data points. These probabilities reflect how often prices fall into each range.
Computing Entropy:
Entropy is then calculated based on the distribution of these probabilities. The formula involves summing the products of each probability and the logarithm of that probability. This calculation tells us how evenly the prices are distributed across the bins.
Interpretation for Traders:
High entropy indicates that the prices are spread evenly across the bins, suggesting a highly random and uncertain market. Low entropy, on the other hand, shows that prices are concentrated in fewer bins, indicating more predictable and stable market conditions.
Slide 5: Implementing and Using Entropy in TradingView
How It Works in TradingView:
Data Period: Typically, entropy is calculated over a specific number of bars (e.g., 200), representing recent market activity. The longer the period, the broader the market behavior considered.
Bin Division: The price range during this period is divided into a set number of bins. These bins help to categorize price levels and assess how spread out the market’s activity is.
Entropy Calculation: The indicator evaluates the spread of prices across these bins to determine the level of market disorder. This is visualized on the chart as an entropy line, helping traders to see fluctuations in market uncertainty.
Practical Application:
As a trader, you can use the entropy indicator to gauge when the market is in a state of high uncertainty (high entropy) or low uncertainty (low entropy). This insight can inform decisions on when to take riskier trades or when to stay conservative.
Slide 6: Interpreting the Entropy Indicator
High Entropy:
Characteristics:
Indicates a high level of market disorder, where price movements are more random and less predictable.
Suggests volatile or unpredictable market conditions.
Implications for Traders:
During periods of high entropy, traders might need to exercise greater caution, reduce position sizes, or employ more defensive trading strategies.
High entropy could signal potential trend reversals or significant market movements, making it a critical period to watch closely.
Low Entropy:
Characteristics:
Suggests that the market is more predictable, with prices showing less variation and more consistent trends.
Typically associated with trending markets where price movement is more orderly.
Implications for Traders:
In a low entropy environment, traders might favor trend-following strategies, as the market shows clearer directional movement.
Low entropy can also suggest more reliable trading opportunities, where the risk of sudden, unpredictable price swings is reduced.
Slide 7: Use Cases and Strategy Integration
Practical Use Cases:
Trend Reversals: Use entropy to identify potential points where a market may shift from trending to consolidating, or vice versa. A sudden increase in entropy might indicate the end of a stable trend and the start of a more volatile period.
Volatility Detection: Detect periods of increased market volatility by observing spikes in entropy. These periods can be critical for adjusting your trading strategy, either by scaling back or by taking advantage of the increased movement.
Strategy Integration:
Risk Management: Incorporate entropy into your risk management strategy by adjusting position sizes, leverage, or stop-loss levels based on the current entropy reading. In high entropy conditions, it might be wise to take smaller, more conservative positions.
Combining Indicators: Entropy can be effectively combined with other indicators, such as moving averages or RSI, to provide a more comprehensive view of market conditions. For example, using entropy alongside a trend indicator can help confirm whether a trend is strong and likely to continue, or if it's weakening and at risk of reversal.
Slide 8: Advantages and Limitations of Entropy
Advantages:
Unique Perspective: Entropy offers a unique way to measure market uncertainty that complements traditional volatility measures. It provides traders with insights into the randomness and predictability of price movements, which can be crucial for strategic decision-making.
Dynamic Analysis: Entropy adapts to changes in market conditions, offering real-time insights into the level of market disorder. This makes it a valuable tool for traders who need to stay responsive to the market's evolving dynamics.
Limitations:
Complex Interpretation: Unlike more straightforward indicators, entropy requires a deeper understanding to interpret correctly. Traders need to be familiar with how entropy levels relate to market behavior and what actions to take in response.
Sensitivity to Parameters: The results can vary significantly depending on the number of bins and the data period chosen, requiring careful parameter selection. Traders may need to experiment with different settings to find the most informative configuration for their specific market or trading style.
Slide 9: Conclusion
Key Takeaways:
Entropy as a Tool: Provides a unique perspective on market dynamics by measuring unpredictability. This can help traders better understand the nature of market conditions and tailor their strategies accordingly.
Practical Application: Can enhance trading strategies, particularly in volatile markets, by helping to identify periods of high uncertainty and adjusting risk management practices.
Further Exploration: Experimenting with different bin sizes and periods can help fine-tune the entropy indicator for specific markets and trading strategies. Traders are encouraged to combine entropy with other indicators to build a more robust trading framework.
Final Thoughts:
Entropy is a powerful concept that, when applied correctly, can offer valuable insights into market behavior. It should be used in conjunction with other tools and indicators to make informed trading decisions, particularly in markets where unpredictability plays a significant role.
This presentation provides a comprehensive overview of entropy, its significance in financial markets, and how it can be practically applied as an indicator in TradingView. The focus is on how traders can use entropy to enhance their trading strategies and improve their understanding of market conditions.
Best regards
Chervolino

MVSF 6.0[ELPANO]The "MVSF 6.0 " indicator, which stands for Multi-Variable Strategy Framework, overlays on price charts to aid in trading decisions. It combines various moving averages and volume data to generate buy and sell signals based on predefined conditions.
Key features of the indicator include:
Moving Averages: It uses three exponential moving averages (EMAs) with lengths of 200, 100, and 50, and two simple moving averages (SMAs) with lengths of 14 and 9. These averages are combined into a single average line to detect trends.
Volume Analysis: The volume is assessed over a specified period (default is 2 bars) to determine its trend relative to its average, influencing the color and interpretation of signals.
Price Source and VWAP: Users can select the price (close, low, or high) used for calculations. The volume-weighted average price (VWAP) serves as a potential benchmark or condition in signal generation.
Signal Generation: Buy and sell signals are based on the relationship of the price to the average line and VWAP, the direction of the last candle, and the trend direction of the average line. These signals are visually represented on the chart.
Customization: Traders can toggle the visibility of signals, entry points, the average line, and even use these elements as conditions for filtering signals.
This script is designed to be flexible, allowing traders to modify settings according to their strategy needs. The description and implementation aim to provide clarity on how each component works together to assist in trading decisions, adhering to best practices for creating and publishing trading scripts.
*************************************
Der Indikator "MVSF 6.0 ", der für Multi-Variable Strategy Framework steht, wird über Preisdiagramme gelegt, um bei Handelsentscheidungen zu helfen. Er kombiniert verschiedene gleitende Durchschnitte und Volumendaten, um Kauf- und Verkaufssignale basierend auf vordefinierten Bedingungen zu generieren.
Wesentliche Merkmale des Indikators umfassen:
Gleitende Durchschnitte: Es werden drei exponentielle gleitende Durchschnitte (EMAs) mit Längen von 200, 100 und 50 sowie zwei einfache gleitende Durchschnitte (SMAs) mit Längen von 14 und 9 verwendet. Diese Durchschnitte werden zu einer einzelnen Durchschnittslinie kombiniert, um Trends zu erkennen.
Volumenanalyse: Das Volumen wird über einen festgelegten Zeitraum (standardmäßig 2 Balken) bewertet, um seinen Trend im Vergleich zum Durchschnitt zu bestimmen, was die Farbe und Interpretation der Signale beeinflusst.
Preisquelle und VWAP: Benutzer können den für Berechnungen verwendeten Preis (Schluss-, Tief- oder Hochkurs) auswählen. Der volumengewichtete Durchschnittspreis (VWAP) dient als mögliche Benchmark oder Bedingung bei der Generierung von Signalen.
Signalgenerierung: Kauf- und Verkaufssignale basieren auf dem Verhältnis des Preises zur Durchschnittslinie und zum VWAP, der Richtung der letzten Kerze und der Trendrichtung der Durchschnittslinie. Diese Signale werden visuell auf dem Diagramm dargestellt.
Anpassung: Händler können die Sichtbarkeit von Signalen, Einstiegspunkten, der Durchschnittslinie und sogar deren Verwendung als Bedingungen für die Filterung von Signalen ein- und ausschalten.
Dieses Skript ist so konzipiert, dass es flexibel ist und Händlern erlaubt, die Einstellungen gemäß ihren Strategiebedürfnissen zu modifizieren. Die Beschreibung und Implementierung zielen darauf ab, Klarheit darüber zu schaffen, wie jede Komponente zusammenarbeitet, um bei Handelsentscheidungen zu helfen, und halten sich an die besten Praktiken für die Erstellung und Veröffentlichung von Handelsskripten.

VWAP Bands [TradingFinder] 26 Brokers Data (Forex + Crypto)🔵 Introduction
Indicators are tools that help analysts predict the price trend of a stock through mathematical calculations on price or trading volume. It is evident that trading volume significantly impacts the price trend of a stock symbol.
The Volume-Weighted Average Price (VWAP) indicator combines the influence of trading volume and price, providing technical analysts with a practical tool.
This technical indicator determines the volume-weighted average price of a symbol over a specified time period. Consequently, this indicator can be used to identify trends and entry or exit points.
🟣 Calculating the VWAP Indicator
Adding the VWAP indicator to a chart will automatically perform all calculations for you. However, if you wish to understand how this indicator is calculated, the following explains the steps involved.
Consider a 5-minute chart. In the first candle of this chart (which represents price information in the first 5 minutes), sum the high, low, and close prices, and divide by 3. Multiply the resulting number by the volume for the period and call it a variable (e.g., X).
Then, divide the resulting output by the total volume for that period to calculate your VWAP. To maintain the VWAP sequence throughout the trading day, it is necessary to add the X values obtained from each period to the previous period and divide by the total volume up to that time. It is worth noting that the calculation method is the same for intervals shorter than a day.
The mathematical formula for this VWAP indicator : VWAP = ∑ (Pi×Vi) / ∑ Vi
🔵 How to Use
Traders might consider the VWAP indicator as a tool for predicting trends. For example, they might buy a stock when the price is above the VWAP level and sell it when the price is below the VWAP.
In other words, when the price is above the VWAP, the price is rising, and when it is below the VWAP, the price is falling. Major traders and investment funds also use the VWAP ratio to help enter or exit stocks with the least possible market impact.
It is important to note that one should not rely solely on the VWAP indicator when analyzing symbols. This is because if prices rise quickly, the VWAP indicator may not adequately describe the conditions. This indicator is generally used for daily or shorter time frames because using longer intervals can distort the average.
Since this indicator uses past data in its calculations, it can be considered a lagging indicator. As a result, the more data there is, the greater the delay.
🟣 Difference Between VWAP and Simple Moving Average
On a chart, the VWAP and the simple moving average may look similar, but these two indicators have different calculations. The VWAP calculates the total price considering volume, while the simple moving average does not consider volume.
In simpler terms, the VWAP indicator measures each day's price change relative to the trading volume that occurred that day. In contrast, the simple moving average implicitly assumes that all trading days have the same volume.
🟣 Reasons Why Traders Like the VWAP Indicator
The VWAP Considers Volume: Since VWAP takes volume into account, it can be more reliable than a simple arithmetic average of prices. Theoretically, one person can buy 200,000 shares of a symbol in one transaction at a single price.
However, during the same time frame, 100 other people might place 200 different orders at various prices that do not total 100,000 shares. In this case, if you only consider the average price, you might be mistaken because trading volume is ignored.
The Indicator Can Help Day Traders: While reviewing your trades, you might notice that the shares you bought at market price are trading below the VWAP indicator.
In this case, there's no need to worry because with the help of VWAP, you always get a price below the average. By knowing the volume-weighted average price of a stock, you can easily make an informed decision about paying more or less than other traders for the stock.
VWAP Can Signal Market Trend Changes: Buying low and selling high can be an excellent strategy for individuals. However, you are looking to buy when prices start to rise and sell your shares when prices start to fall.
Since the VWAP indicator simulates a balanced price in the market, when the price crosses above the VWAP line, one can assume that traders are willing to pay more to acquire shares, and as a result, the market will grow. Conversely, when the price crosses below the line, this can be considered a sign of a downward movement.
🔵 Setting
Period : Indicator calculation time frame.
Source : The Price used for calculations.
Market Ultra Data : If you turn on this feature, 26 large brokers will be included in the calculation of the trading volume.
The advantage of this capability is to have more reliable volume data. You should be careful to specify the market you are in, FOREX brokers and Crypto brokers are different.
Multiplier : Coefficient of band lines.

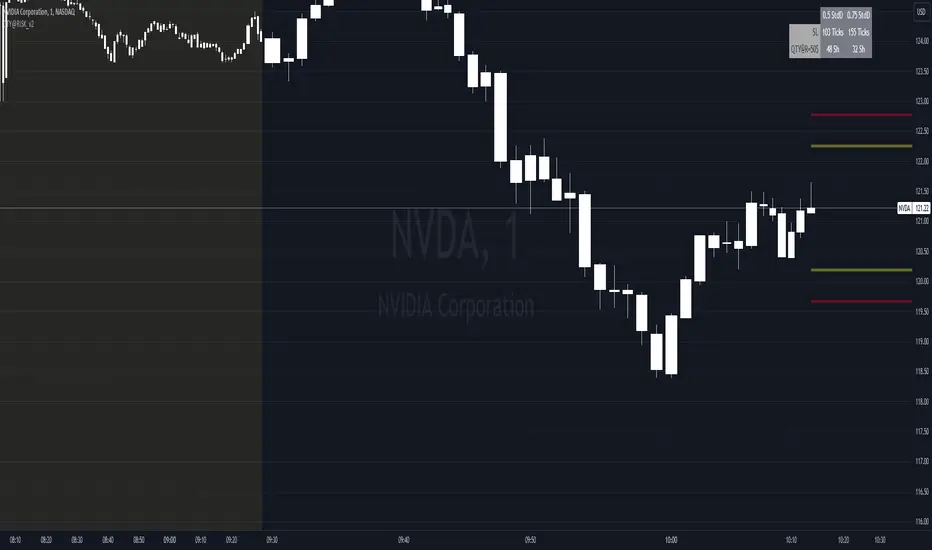
Equal Highs and Lows {Reh's and Rel's }# Equal Highs and Lows {Reh's and Rel's} Indicator
## Overview
The "Equal Highs and Lows {Reh's and Rel's}" indicator is designed to identify and mark equal highs and lows on a price chart. It detects both exact and relative equal levels, draws lines connecting these levels, and optionally labels them. This tool can help traders identify potential support and resistance zones based on historical price levels.
## Key Features
1. **Exact and Relative Equality**: Detects both precise price matches and relative equality within a specified threshold.
2. **Customizable Appearance**: Allows users to adjust colors, line styles, and widths.
3. **Dynamic Line Management**: Automatically extends or removes lines based on ongoing price action.
4. **Labeling System**: Optional labels to identify types of equal levels (e.g., "Equal High", "REH/Equal High").
5. **Flexible Settings**: Adjustable parameters for lookback periods, maximum bars apart, and relative equality thresholds.
## User Inputs
### Appearance
- `lineColorHigh`: Color for lines marking equal highs (default: red)
- `lineColorLow`: Color for lines marking equal lows (default: green)
- `lineWidth`: Thickness of the lines (range: 1-5, default: 1)
- `lineStyle`: Style of the lines (options: Solid, Dash, Dotted)
- `showLabels`: Toggle to show or hide labels for equal highs and lows
### Settings
- `lookbackLength`: Number of bars to look back for finding equal highs and lows (default: 200)
- `maxBarsApart`: Maximum number of bars apart for equal highs/lows to be considered (range: 2-10, default: 5)
### Relative Equality
- `considerRelativeEquals`: Enable detection of relative equal highs and lows
- `thresholdIndex`: Maximum tick difference for relative equality in index instruments (range: 1-10, default: 2)
- `thresholdStocks`: Maximum tick difference for relative equality in stock instruments (range: 5-200, step: 5, default: 10)
## How It Works
The indicator scans historical price data to identify equal or relatively equal highs and lows. It draws lines connecting these levels and updates them as new price data comes in. Lines are extended if the level holds and removed if the price breaks through. The tool adapts to different market conditions by allowing adjustments to the equality thresholds for various instrument types.
## Practical Use
Traders can use this indicator to:
- Identify potential support and resistance levels
- Spot areas where price might react based on historical turning points
- Enhance their understanding of price structure and repetitive patterns
## Disclaimer
This indicator is provided as a tool to assist in identifying potential price levels of interest. It is not financial advice. Users should not rely solely on this or any single indicator for trading decisions. Always conduct thorough analysis, consider multiple factors, and be aware that past price behavior does not guarantee future results. All trading involves risk.

MA DifferenceThe MA Difference indicator shows 3 histograms representing differences in moving averages between a base MA (10) and 3 MA's: short (20), medium (50), and long (200). It also shows an exponentially weighted trend line which can indicate breakout opportunities, has alerts on all base <-> X crossovers, and shows potential consolidation zones where MA differences are below a user-defined tolerance.
The suggested way to use this indicator is to place a trade when the trend line is above the histogram (and filling the space between them). This indicates that the current MA values are significantly above or below the expected range and that prices are in the midst of breaking out. You may also consult the consolidation zones to eliminate false breakouts and momentary changes in trend. You may also consult the various short, medium, and long crossovers and crossunders to time entries and exits accordingly.
Histograms
The 3 histograms represent the differences between:
Base MA (10) and Short MA (20)
Base MA (10) and Medium MA (50)
Base MA (10) and Long MA (200)
All 4 moving average values can be configured in the indicator's settings. Consistency in direction and color of the histogram indicates a consistent trend across the various moving averages.
Trend Line
The trend line is an exponentially weighted average of the 3 moving averages, scaled by a factor configurable in the settings. When using the trend line, shading will be applied to the difference between the extremes of the histogram and the trend line to indicate that the chart is in a "breakout zone" and is beyond the normal, gradual sway of price action.
Crossovers/Crossunders
You may optionally turn on crossovers and crossunders in the indicator's settings to display when a short, medium, or long crossover occurs against the base moving average. Likewise, alerts are available for each crossover and crossunder for each of the 3 moving average convergences.
Consolidation Zones
Consolidation zones, as well as a line representing the current amount of consolidation, can also be optionally drawn on the chart. These indicate when a security is likely in consolidation, according to the spread of various MA values.

QTY@RISK VWAP based calculationVWAP Volatility-Based Risk Management Calculator for Intraday Trading
Overview
This script is an innovative tool designed to help traders manage risk effectively by calculating position sizes and stop-loss levels using the Volume Weighted Average Price (VWAP) and its standard deviation (StdDev). Unlike traditional methods that rely on time-based calculations, this approach is time-independent within the intraday timeframe, making it particularly useful for traders seeking precision and efficiency.
Key Concepts
VWAP (Volume Weighted Average Price): VWAP is a trading benchmark that represents the average price a security has traded at throughout the day, based on both volume and price. It provides insight into the average price level over a specific period, helping traders understand the market trend.
StdDev (Standard Deviation): In the context of VWAP, the standard deviation measures the volatility around the VWAP. It provides a quantifiable range that traders can use to set stop-loss levels, ensuring they are neither too tight nor too loose.
How the Script Works
1. VWAP Calculation: The script calculates the VWAP continuously as the market trades, integrating both price and volume data.
2. Volatility Measurement: It then computes the standard deviation of the VWAP, giving a measure of market volatility.
3. Stop-Loss Calculation: Using user-defined StdDev factors, the script calculates two stop-loss levels. These levels adjust dynamically based on market conditions, ensuring they remain relevant throughout the trading session.
4. Position Sizing: By incorporating your risk tolerance, the script determines the appropriate position size. This ensures that your maximum loss per trade does not exceed your predefined risk value.
How to Use the Calculator
1. Select Two VWAP StdDev Factors: Choose two standard deviation factors for calculating stop-loss levels. For example, you might choose 0.5 and 0.75 to set conservative and aggressive stop-losses respectively.
2. Set Your Trading Account Size: Enter your total trading capital. For example, $50,000.
3. Maximum Lot Size: Define the maximum number of shares you are willing to trade in a single position. For instance, 200 shares.
4. Risk Value per Trade: Input the maximum amount of money you are willing to risk on a single trade. For instance, $50.
5. Plotting Options: If you wish to visualize the stop-loss levels, enable the plot option and choose the price base for the plot, such as the closing price or the average of the high and low prices (hl2).
Example of Use
1. Initial Setup: After the market opens, wait for at least 15 minutes to ensure the VWAP has stabilized with sufficient volume data.
2. Parameter Configuration: Input your desired parameters into the calculator. For instance:
- VWAP StdDev Factors: 0.5 and 0.75
- Trading Account Size: $50,000
- Maximum Lot Size: 200 shares
- Risk Value per Trade: $50
- Plot Option: On, using "hl2" or "close" as the price base
3. Execution: Based on the inputs, the script calculates the position size and stop-loss levels. If the calculated stop-loss falls within the selected VWAP StdDev range, it will provide you with precise stop-loss prices.
4. Trading: Use the calculated position size and stop-loss levels to execute your trades confidently, knowing that your risk is managed effectively.
Advantages for Traders
- Time Independence: By relying on VWAP and its StdDev, the calculations are not dependent on specific time intervals, making them more adaptable to real-time trading conditions.
- Focus on Strategy: Novice traders can focus more on their trading strategies rather than getting bogged down with complex calculations.
- Dynamic Adjustments: The script adjusts stop-loss levels dynamically based on evolving market conditions, providing more accurate and relevant risk management.
- Flexibility: Traders can tailor the calculator to their risk preferences and trading style by adjusting the StdDev factors and risk parameters.
By incorporating these concepts and using this risk management calculator, traders can enhance their trading efficiency, improve their risk management, and ultimately make more informed trading decisions.