Bars In a Row Counter Pro by RRBBars In a Row Counter Pro by RagingRocketBull 2018
Version 1.0
This indicator counts bars of the same color in a sequence (dojis included) and plots the resulting counts as histogram bars
1. based on barssince, uses plot function with histogram style
2. Min/Max Threshold is the upper and lower limits for counting bars. For example, you can look only for sequences of 5 to 10 bars of the same color in a row
3. Show Histogram Beyond Threshold - you can hide/change color of the non-important histogram part that exceeds the threshold
4. Show Threshold Bands - show the upper and lower limits as levels on the indicator
5. Show Min/Max Bands - show ATH max red/green bars in a row historic levels on the indicator
6. Count Red Bars - count red bars in a sequence, show/hide red bars on a histogram (you can exclude red bars and count only green bars)
7. Count Green Bars - count green bars in a sequence, show/hide green bars on a histogram (you can exclude green bars and count only red bars)
8. Invert Red Bars - show red and green histograms together on the same axis above zero (saves space)
Feel free to use. Good Luck!
ابحث في النصوص البرمجية عن "2018年4月至8月伦敦金现跌幅+期间贵金属指数表现"

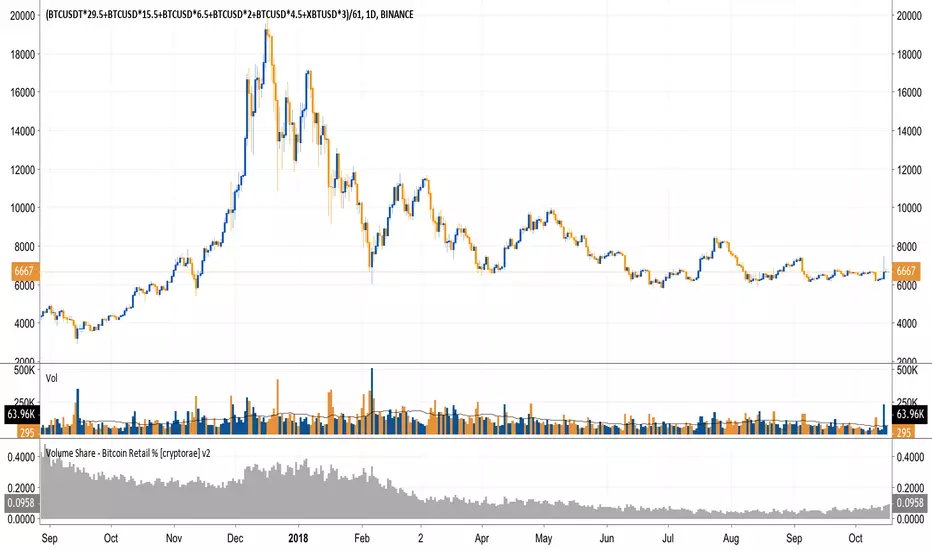
Volume Share - Bitcoin Retail % [cryptorae]I've been keeping my eyes on retail BTC trading volume as a % of total BTC trading volume (charted).
It's the single best chart showing the death of sentiment in this bear market. Retail fell to as low as 5.6% on 6/8. The good news is that the % has stabilized at these levels.
I think retail interest will need to trend higher in tandem with higher price moves for us to break through key resistance levels.
To know why, let's look closer at the anatomy of the recent bull and bear market.
In the 2017 bull market:
- Retail interest trended higher or sideways with each drive up
- Average retail volume share was ~46%
In other words, price movements were dominated by infusions of new money.
In the 2018 bear market:
- Retail interest trended LOWER with each recovery in price
- Average retail volume share was ~15%
In other words, price movements were dominated by money exchanging through the hands of traders.
Open thoughts:
- If the bear market persists and prices reach critical levels, I think that retail % would spike as some finally rush for the exit and new investors happily jump in
- If prices recover w/o a sustained increase in retail %, I'd not be so quick to call a bull market
Things I classify as "retail":
- Bitflyer
- Bithumb
- Coinbase
- Bistamp
- Kraken
Things classified as "non-retail"
- Bitmex
- Bitfinex
The formula is retail / (retail + non-retail)
The script is open for you to modify if you disagree. Let me know your thoughts/tweaks.
Crypto Market Change in BTC [Fingers]Crypto Market Change provides an indication of whether the value of a basket of 19 coins traded in BTC on Binance (as of July 12, 2018) are headed up or down. A simple moving average of the percentage change in BTC price for each coin is calculated. The moving averages are then summed and displayed. A measure of price volatility is indicated by standard deviation bands. Period, moving average length, and number of standard deviations are adjustable.

Crypto Market Change in BTC [Fingers]Crypto Market Change provides an indication of whether the value of a basket of 19 coins traded in BTC on Binance (as of July 12, 2018) are headed up or down. A simple moving average of the percentage change in BTC price for each coin is calculated. The moving averages are then summed and displayed. A measure of price volatility of indicated by standard deviation bands. Period, moving average length, and number of standard deviations are adjustable.

Crypto Market Change in USDT [Fingers]Crypto Market Change provides an indication of whether the value of a basket of 16 coins traded in USDT on Binance (as of July 12, 2018) are headed up or down. A simple moving average of the percentage change in USDT price for each coin is calculated. The moving averages are then summed and displayed. A measure of price volatility of indicated by standard deviation bands. Period, moving average length, and number of standard deviations are adjustable.

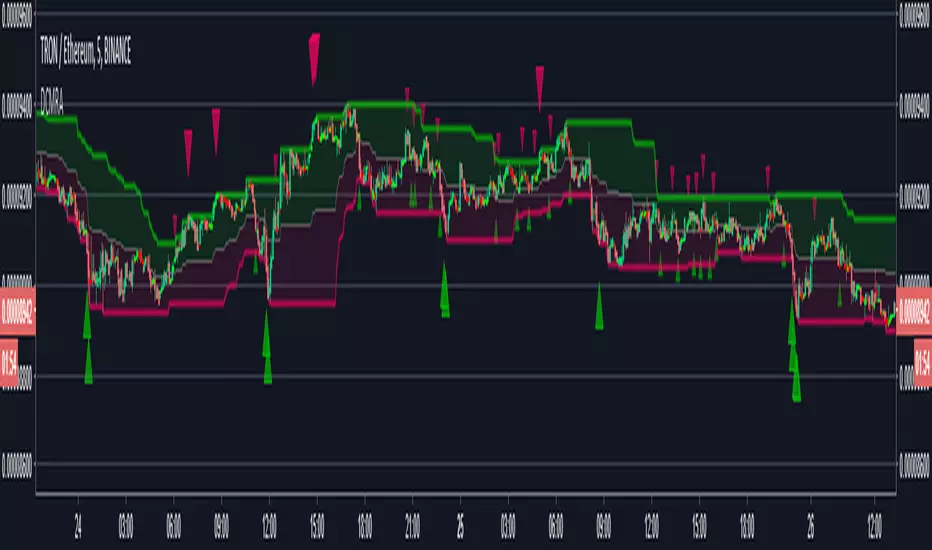
Donchian Mean Reversion AlertsDonchian Channels mean reversion signals/alerts with RSI filtering with signals applied to the mean, for strong trend situations.
Original Author: ChrisMoody
Modified Donchonian Channel with separate adjustments for upper and lower levels
Purpose is if you expect big move up, Use lower input example 3 or 4, and longer lower input, 40 - 100 and use lower input line as a stop out
Opposite if you expect big move down
Mid Line Rule in Long Example. If lower line is below entry take partial profits at Mid Line and move stop to Break even.
If Lower line moves above entry price before price retraces to midline use Lower line as Stop...Opposite if Shorting
Created by user ChrisMoody 1-30-2014
Updated 7-11-2018 by Dysrupt
Revamped for mean reversion strategy
Created midline alerts for strong trending upside buy signals/downside sell signals.
Added RSI Filtering
Added Alerts
Removed bar color change
Ehlers DSMA by Tim D.The Deviation-Scaled Moving Average from July 2018 TASC. "In “The Deviation-Scaled Moving Average” in this issue, author John Ehlers introduces a new adaptive moving average that has the ability to rapidly adapt to volatility in price movement. The author explains that due to its design, it has minimal lag yet is able to provide considerable smoothing."

Volume Factored Relative Strength Index (VFRSI)RSI is an indicator that is dependent only on price. I modified RSI to factor in volume as well. On BTC chart presented above, VFRSI is more accurate than RSI in detecting extreme conditions (green line is VFRSI). In some instances, it seems to be better than RSI in detecting divergences as well (scroll to March 2018).
In smaller time frames, it reduces the bart effect present on RSI without compromising responsiveness (unlike moving averages).
Features:
- Parameterized variables
- Includes regular RSI
- Includes an adjustable weight factor to reduce the effect of volume. At 0, it is identical to RSI.
PS: If you have seen a similar indicator, please let me know. Otherwise, this indicator has the potential to replace regular RSI.
Your feedback is very welcome :)
c|:D

Ice Yolo RSI Public//Created By ChrisMoody on 8/15/2014
//Uploaded By Iceberg on 6/13/2018
//This script allovvs you to set up to 3 different length RSI at the same time. I usually use tvvo.
//Chris removed his script and someone asked mine. I simplified a lot of lines.
//This script shovvs highlighted background vvhen your First RSI is in oversold or overbought zone, and flashes vvhen
//it crosses the lines. You can use it to check crossings or bounces of different lengths too.
//The settings highly depends on your Timeframe AND trading style. So make sure they match you as you like. I don't recommend using
//the default ones! Thanks for using, and thanks again Chris Moody!

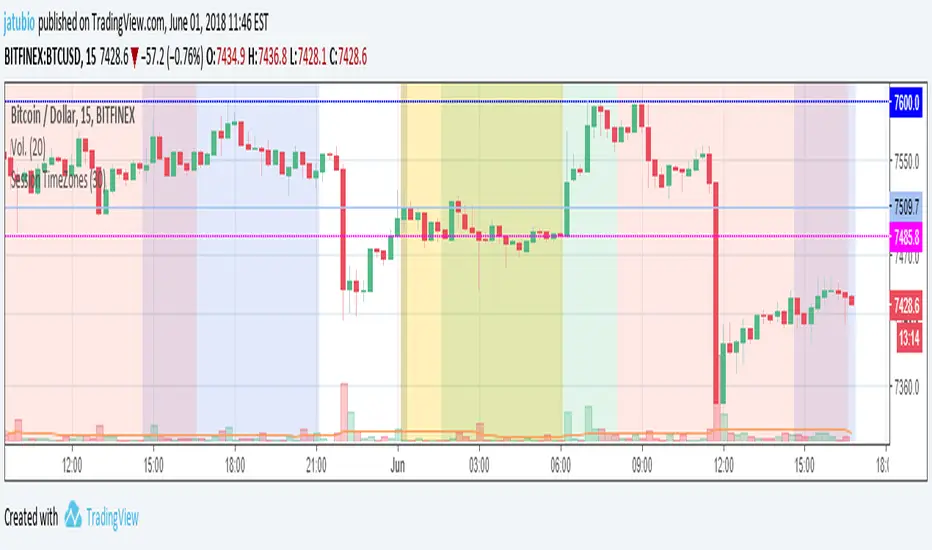
Custom Session TimeZonesThis indicators show background colours to identify world timezones
You can setup five custom zones.
You can also define time interval to show/hide
Can be used to know from what time of the world they are traders awake or
to search correlations between big moves and timezones hours.
Thanks to:
www.tradingcode.net
01/06/2018

Session TimeZonesThis indicators show background colours to identify world timezones
New York, London, Tokio, China and Sydney sessions
You can also setup timeframe intervals to show or hide.
Time Values based on UTC: ** YOU HAVE TO SETUP YOUR CHARTS TO 0-UTC TIMEZONE **
Values from: en.wikipedia.org
New York: UTC-5
Market Session: 09:30 - 16:00 (Local Time)
Market Session: 14:30 - 21:00 (UTC Based Time)
London: UTC
Market Session: 08:00 - 16:30 (Local Time)
Market Session: 08:00 - 16:30 (UTC Based Time)
Tokyo: UTC+9
Market Session: 09:00 - 15:00 (Local Time)
Market Session: 00:00 - 06:00 (UTC Based Time)
China: UTC+8
Market Session: 09:30 - 16:00 (Local Time)
Market Session: 01:30 - 08:00 (UTC Based Time)
Sydney: UTC+10
Market Session: 10:00 - 16:00 (Local Time)
Market Session: 00:00 - 06:00 (UTC Based Time)
Can be used to know from what time of the world they are traders awake or
to search correlations between big moves and timezones hours.
Thanks to:
www.tradingcode.net
01/06/2018

ORB_BHCH_CombinedPublished on 16/04/2018
Coded By Krishna Khanna (kkonline.org)
This Indicator is in use in NimblrTA
This indicator does the following
1) Plots the BH>50%CH candles with indications
2) Plots the EMA 5 21 and 55
3) Plots Gapup / Gapdown for identification

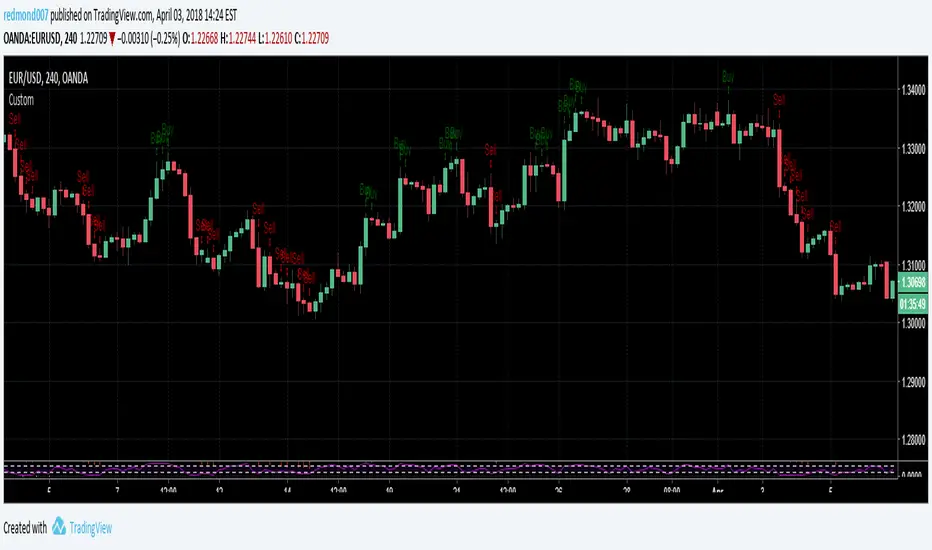
RSI MACD EMA Stoch Custom IndicatorCopyright by RJ 3/2018
Buy when:
RSI period 3 greater than 50, Difference between MACD and MACD signal line is greater than 0 and also greater than that of previous candle,
Stochastic %D line is less than 80 and greater than that of previous candle, Closing price greater than EMA period 100.
Sell when:
RSI period 3 less than 50, Difference between MACD and MACD signal line is less than 0 and also less than that of
previous candle, Stochastic %D line is greater than 20 and less than that of previous candle, Closing price less than EMA
period 100.
Dual Timeframe SMA Ribbon CrossoverCopyright by RJ 3/2018
Should be used with lower timeframe and higher timeframe charts
First set your chart to the lower timeframe you'd like to analyze
see f.bpcdn.co
For this method, low timeframe/high suitable timeframe pairs are:
5min with 30min parent
15min with 1hr parent
30min with 4hr parent
4hr with daily parent
daily with weekly parent
weekly with monthly parent
On lower timeframe chart - Plot of 2 smas length 6, 1 Offset
If smas cross - and bar crosses the sma convergence, and full body of bar crosses SMAs - then this is a buy or sell opportunity
For confirmation - on the higher timeframe chart, check if bar is above or below the smas for that day

BTC World Volume (Multi-Exchange)Release: 2018-03-29
__________________________
WHAT IT DOES
Bitcoin is listed on multiple exchanges. Many people have called for a single global index that would quote BTC volume across all exchanges: this script is such a virtual volume aggregate of the 17 largest fiat exchanges on TradingView (listed in the script comments, and in Format > Inputs for you to select). It includes USD, EUR, JPY, KRW and USDT sources.
It will, independently for each tick, quote the volume from all selected exchanges and display a stacked representation, freely inspired from CoinMarketCap charts; also a Moving Average. Each fiat/continent has its own general color, to be able to quickly glance at where volume is coming from, e.g. BitMEX or Asia. (colors are based on Google's Material Design).
By default:
Grey: BitMEX
Green: USD
Yellow: Tether (USDT)
Red: Asia (JPY, KRW)
Blue: Europe (EUR)
No more "on Coinbase this" or "on Bitstamp that", you've now got a global overview! It becomes easy to debunk a few common myths.
See CoinMarketCap for reference.
Note: Bitmex is not taken into account in CoinMarketCap (afaik) since it's trading a derivative asset (XBTUSD contracts), but it usually amounts to ~50% of the overall BTC volume in USD value. The 16 other exchanges quote their volume in BTC, and they represent 30~40% of the overall BTC volume. I believe the whole is good enough to smooth out exchanges variations, and get a fair representation of real-time activity.
__________________________
HOW TO USE IT
Just add it to your chart, it will appear as a separate indicator. By default, it appears as stacked colored "areas". There is also a total volume Histogram, which is transparent by default: you can tweak that in Format > Style.
The darker and lighter backgrounds are respectively indicative of a downward price candle (open > close), or an upward price candle (close > open). They are unrelated to volume and simply help interpreting the indicator.
You can check/uncheck exchanges in the Format > Inputs tab to remove/add some of them from computation. All are enabled by default.
You can check/uncheck exchanges in the Format > Style tab to hide them (usually you would hide all or none).
You can edit colors and transpareny as well for each exchange.
You can edit "Volume histogram" transparency to have it show (it's a simpler representation than areas).
Moving Average: You can select the type (SMA, EMA, DEMA or TEMA) and length.
__________________________
Please leave feedback below or pm me directly for bugs and suggestions.

Exponential Bollinger Bands [Updated Feb 2018]The same as my previous Exponential Bollinger Bands script, but now you can set a desired offset for the indicator. I have published this as a new script that way those who prefer the old script can continue to use it without seeing any changes.
