Ehlers Simple Window Indicator [CC]The Simple Window Indicator was created by John Ehlers (Stocks and Commodities Sep 2021) and this is the last of the 4 new indicators that he published in the latest issue of Stocks & Commodities. Since these are all part of a series, the idea behind each indicator is the exact same. The only difference is of course the calculation for each indicator. This script is different mostly because it is extremely noisy in comparison so I had to smooth it twice to provide clear buy and sell signals. Window functions are used in digital signal processing to filter out noise and the end result is an oscillator that centers around the 0 line. The easy way to understand these indicators that I will be publishing and those are that when they are above 0, it usually means an uptrend and below 0 then a downtrend. For more immediate signals, I have included both normal and strong buy and sell signals so darker colors for strong signals and lighter colors for normal signals. Buy when the line turns green and sell when it turns red.
Let me know if there are any other indicators you would like me to publish!
ابحث في النصوص البرمجية عن "2021年4月+黄金价格走势"

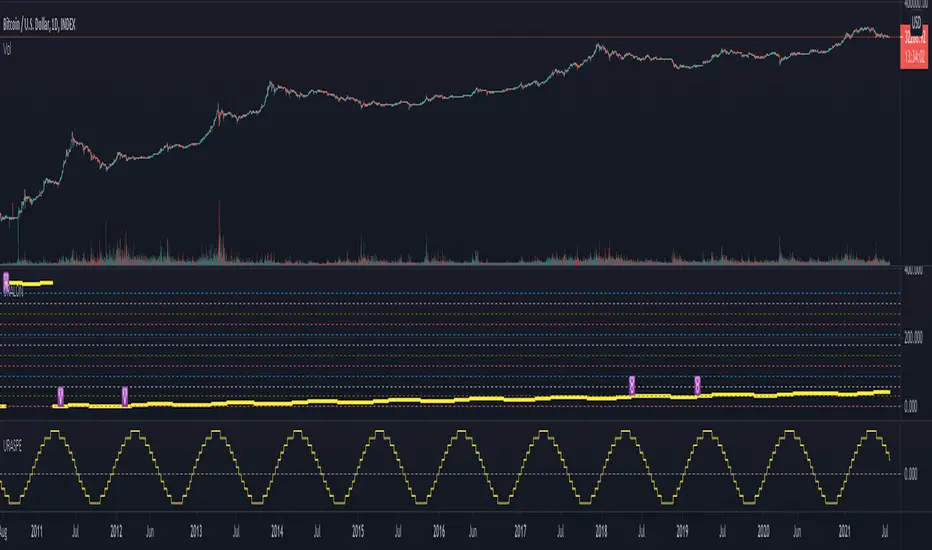
PI_GRM Bitcoin Golden Ratio Multipier [wozdux]Golden Ratio Multiplier
Formula GRM=MA350(BTC USD) * (1.6;2;3;5;8;13;21)
The multiplier examines medium-and long-term time cycles.
For this, a multiple of 350 MA is used to determine the areas of potential resistance.
Additionally, fibo levels from the main line.
version 2021 year modification

Ehlers Triangle Window Indicator [CC]The Triangle Window Indicator was created by John Ehlers (Stocks and Commodities Sep 2021) and this is one of 4 new indicators that he published in the latest issue of Stocks & Commodities and I will be publishing the last one tomorrow. Since these are all part of a series, the idea behind each indicator is the exact same. The only difference is of course the calculation for each indicator. Window functions are used in digital signal processing to filter out noise and the end result is an oscillator that centers around the 0 line. The easy way to understand these indicators that I will be publishing and those are that when they are above 0, it usually means an uptrend and below 0 then a downtrend. For more immediate signals, I have included both normal and strong buy and sell signals so darker colors for strong signals and lighter colors for normal signals. Buy when the line turns green and sell when it turns red.
Let me know if there are any other indicators you would like me to publish!

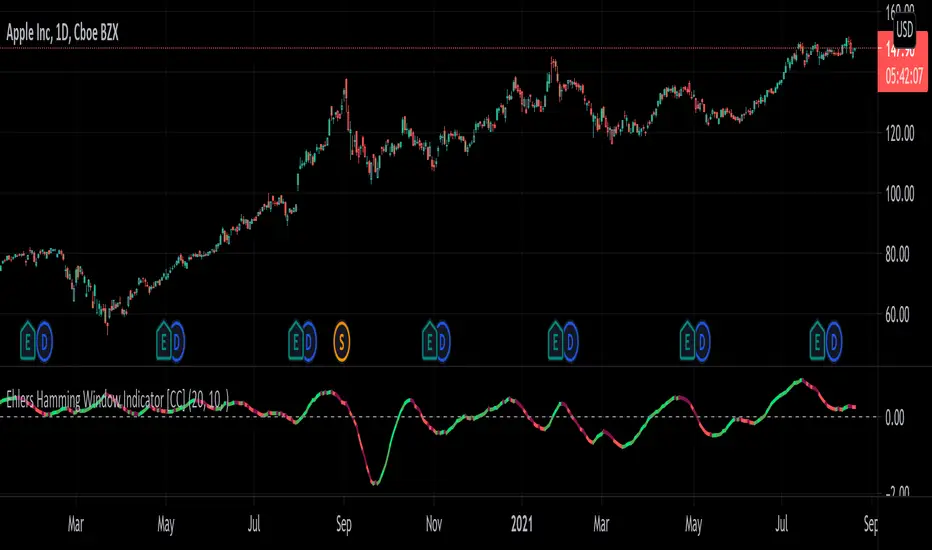
Ehlers Hamming Window Indicator [CC]The Hamming Window Indicator was created by John Ehlers (Stocks and Commodities Sep 2021) and this is one of 4 new indicators that he published in the latest issue of Stocks & Commodities and I will be publishing the other 2 in the next few days. Since these are all part of a series, the idea behind each indicator is the exact same. The only difference is of course the calculation for each indicator. Window functions are used in digital signal processing to filter out noise and the end result is an oscillator that centers around the 0 line. The easy way to understand these indicators that I will be publishing and those are that when they are above 0, it usually means an uptrend and below 0 then a downtrend. For more immediate signals, I have included both normal and strong buy and sell signals so darker colors for strong signals and lighter colors for normal signals. Buy when the line turns green and sell when it turns red.
Let me know if there are any other indicators you would like me to publish!
Ehlers Hann Window Indicator [CC]The Hann Window Indicator was created by John Ehlers (Stocks & Commodities Sep 2021) and this is one of 4 new indicators that he published in the latest issue of Stocks & Commodities and I will be publishing the other 3 in the next few days. Since these are all part of a series, the idea behind each indicator is the exact same. The only difference is of course the calculation for each indicator. Window functions are used in digital signal processing to filter out noise and the end result is an oscillator that centers around the 0 line. The easy way to understand these indicators that I will be publishing and those are that when they are above 0, it usually means an uptrend and below 0 then a downtrend. For more immediate signals, I have included both normal and strong buy and sell signals so darker colors for strong signals and lighter colors for normal signals. Buy when the line turns green and sell when it turns red.
Let me know if there are any other indicators you would like me to publish!

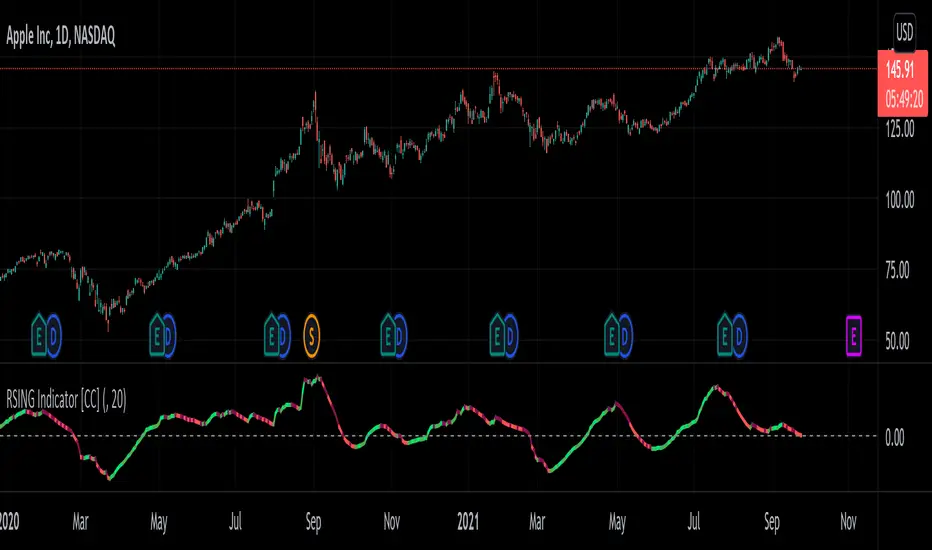
RSING Indicator [CC]The RSING indicator was created by Alon Horesh (Stocks & Commodities March 2021 pg 11) and this aims to be a better version of rsi that adapts to volume as well as a focus on overall strength. This is trying to fix the issues with the traditional RSI with a lack of volume and the issue where you could have the indicator stay in overbought or oversold territory but the upward or downward momentum continues. This indicator takes ratios of the current volume to it's moving average, the overall momentum of the stock, and the current range in comparison to the std deviation of it's past range and multiplies them all together to create this new indicator. I smooth it with a moving average for easier to read buy and sell signals. I have included strong buy and sell signals as darker colors and normal buy and sell signals as lighter colors. Buy when the line turns green and sell when it turns red.
Let me know if there are any other indicators you would like to see me publish!
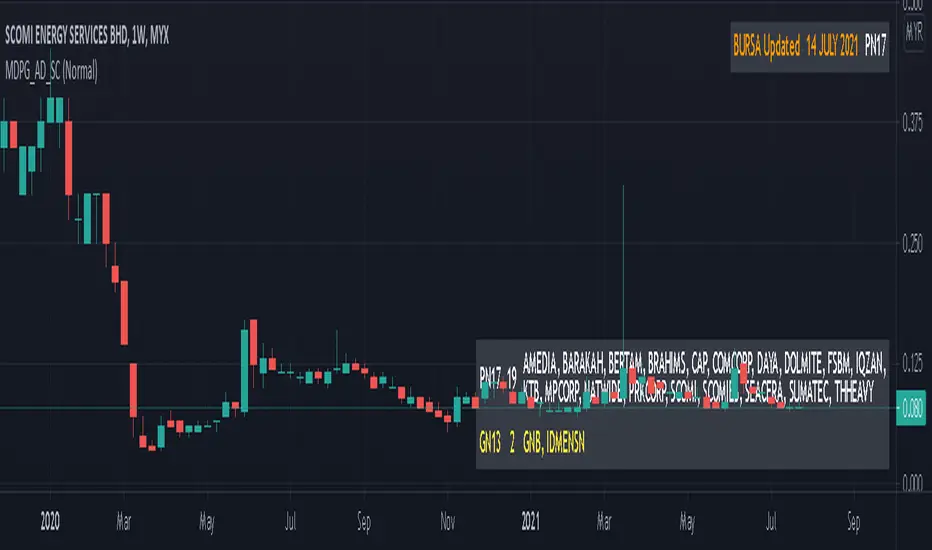
MYX Delisted PN17 GN13 Auto Detect (Source Code)This indicator intended for Malaysia Market only for auto detect delisted companies (PN17, GN13) refer to Bursa Malaysia
Indikator ini adalah untuk pasaran Malaysia sahaja untuk automatik mengenalpasti senarai syarikat terkeluar rujuk kepada Bursa Malaysia
Indicator features :
1. Able to detect stock and warrant.
2. List similar symbol or counter including total.
3. Font size small for mobile app and font size normal for desktop.
4. Show date updated by Bursa Malaysia.
Kemampuan indikator :
1. Boleh mengenal pasti saham dan waran.
2. Senarai simbol atau kaunter yang terlibat termasuk jumlah.
3. Saiz font kecil untuk mobile app dan saiz size normal untuk desktop.
4. Memaparkan tarikh kemaskini oleh Bursa Malaysia.
Date Updated / Tarikh Kemaskini : 14/7/2021
FAQ
1. Credits / Kredit
LucF & PineCoders
2. Code Usage / Penggunaan Kod
Free to use for personal usage but credits are most welcomed.
Not for business / comercial usage, any damage or lialibity are not my resposibility.
Bebas untuk kegunaan peribadi tetapi kredit adalah amat dialu-alukan.
Bukan untuk kegunaan perniagaan / komersil, sebarang kerosakan atau liability adalah di luar tanggungjawab saya.
3. Update Frequency / Frekuensi
Anytime after official update by Bursa Malaysia.
Bila-bila masa selepas kemaskini rasmi oleh Bursa Malaysia
4. Symbol/Counter not showing / Simbol/kaunter tiada
Symbol/counter not longer exist or not yet updated.
Simbol/kaunter telah tersenarai keluar atau belum dikemaskini.
Single layout with font size normal
Satu layout dengan saiz font normal
Double layout with small font size (Left : Stock, Right : Warrant)
Dua layout dengan font saiz normal (Kiri : Saham, Kanan : Waran)
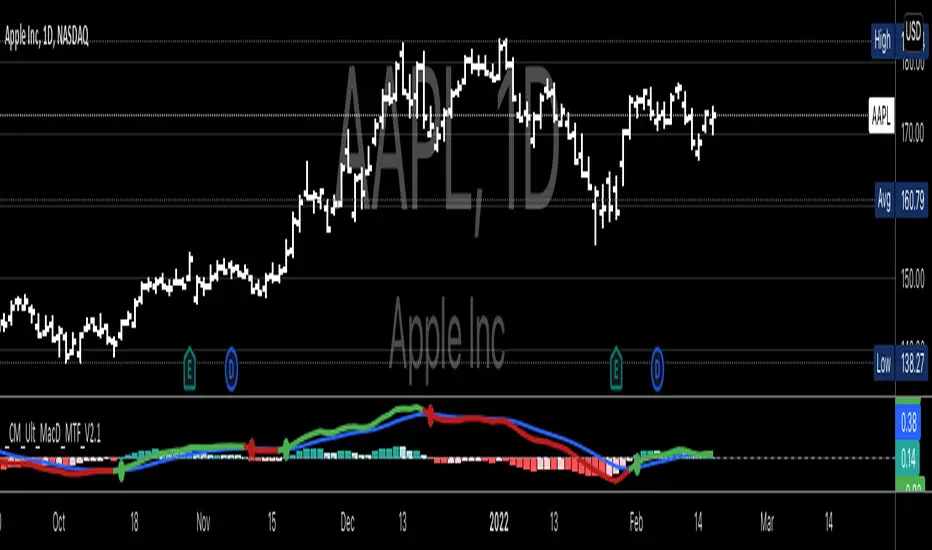
CM MACD Custom Indicator - Multiple Time Frame - V2***For a Detailed Video Overview Showing all of the Settings...
Click HERE to View Video
New _CM_MacD_Ult_MTF _V2 Update 07-28-2021
Thanks to @SKTennis for help in Updating code to V2
Added Groups to Settings Pane.
Added Color Plots to Settings Pane
Switched MTF Logic to turn ON/OFF automatically w/ TradingView's Built in Feature
Updated Color Transparency plots to work in future update
Added Ability to Turn ON/OFF Show MacD & Signal Line
Added Ability to Turn ON/OFF Show Histogram
Added Ability to Change MACD Line Colors Based on Trend
Added Ability to Highlight Price Bars Based on Trend
Added Alerts to Settings Pane.
Customized how Alerts work. Must keep Checked in Settings Pane, and When you go to Alerts Panel, Change Symbol to Indicator (CM_Ult_MacD_MTF_V2)
Customized Alerts to Show Symbol, TimeFrame, Closing Price, MACD Crosses Up & MACD Crosses Down Signals in Alert
Alerts are Pre-Set to only Alert on Bar Close
See Video for Detailed Overview
New Updates Coming Soon!!!
***Please Post Feedback and Any Feature Requests in the Comments Section Below***
Financial Astrology Vesta LongitudeVesta is one of the largest objects in the asteroid belt between Mars and Jupiter, the orbit duration is 3.63 years and seems to be very relevant celestial object in financial astrology. The experienced financial astrologer "Bill Meridian" indicates that this asteroid rules the security business, and paper securities such as bonds and stocks. We have confirmed through statistical research that adding this asteroid to astrology machine learning models provides an increase in daily trend predictions accuracy for crypto-currencies sector.
Our statistical analysis of Vesta zodiac sign location concluded that when is transiting the signs of Aries, Gemini, Cancer, Leo and Libra the daily trend is 59% or more of the days bullish. When Vesta is located at Capricorn is very bearish with 60% of the daily trend going in downward direction. In the other zodiac signs the daily trend was neutral showing most of the time a sideways pattern.
Is very interesting to note that the exact date July 21, 2021, when Vesta entered in Libra BTCUSD started the last bullish wave that finally broke the congestion zone of the 30K-35K and started a new bullish optimism. Pay attention on what happened in the previous cycle when Vesta was located in Libra and do your conclusions.
Note: Vesta longitude indicator is based on an ephemeris array that covers years 2010 to 2030, prior or after this years the data is not available, this daily ephemeris are based on UTC time so in order to align properly with the price bars times you should set UTC as your chart timezone.

Moving Average Band Width [CC]The Moving Average Band Width was created by Vitali Apirine (Stocks and Commodities Aug 2021 pg 25) and this is of course an extension based on my previous Moving Average Bands script. For those of you that aren't aware, the Band Width indicator is an indicator that tells you how close the upper and lower bands are to each other which is a great determination of how volatility is increasing or decreasing. This acts as both a trend indicator and a volatility indicator. I have included strong buy and sell signals in addition to normal ones so stronger signals are darker in color and normal ones are lighter. A great buy signal is when you are in an uptrend (so the line is green already) and the indicator line is moving up which means strong underlying volatility.
Let me know if there are any other indicators or scripts you would like to see me publish!

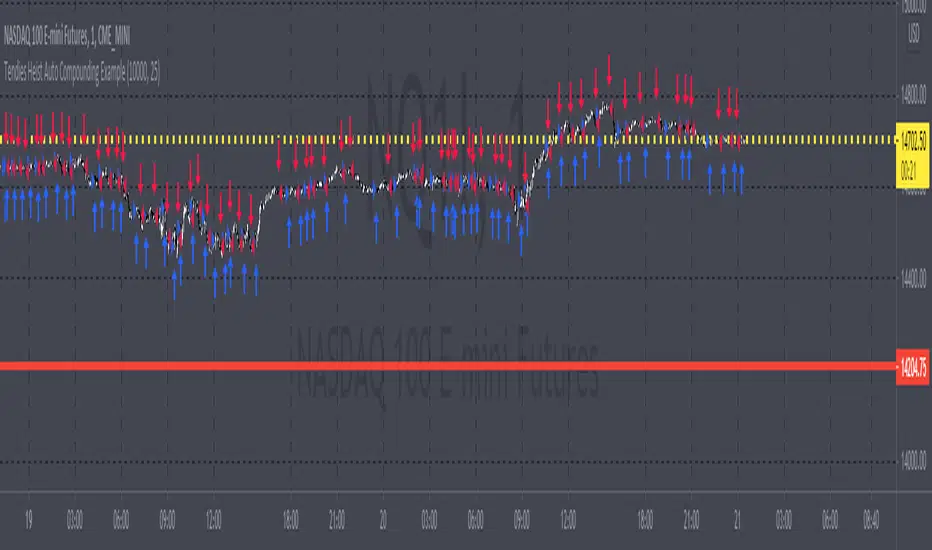
Tendies Heist Auto Compounding ExampleThis is an example of how we can use compounding to control our position size. This example shows how we can automatically add and reduce position size based on account equity. The "initial capital" in properties is the starting account equity. At default its set to 100,000. If our max position size is set to 25 then the very first position that's taken has a position size of 10, IF our leverage is set to 10,000. Account equity divided by leverage equals position size. So in that example 100,000 divided by 10,000 in leverage gives us a max position size of 10. However the max position size was set to 25 meaning we would need 250k in equity for it to open a position size of 25 with the leverage set at 10k. Now if the initial capital was set to 100,000 and the max position size was set to 5 and leverage remained at 10,000, all though 100,000 divided by 10,000 equals 10 it will ONLY open a position size of 5, because the max position size in this example was set at 5. Since this works for strategies you may look through the trade log on the posted back test and check out the position size, you can see in this back test the default 100k is used for the initial capital and the default 10k was used for the leverage. You will be able to see as this logic loses money it takes contracts away and as it gains money it adds contracts. I'm using trading view's basic strategy logic example to provide an example of how the compounding logic works.
Note, don't forget to add the syntax below to your strategy.entry call for this logic to work.
qty = size
Tendies Heist LLC 2021
KINSKI Volume Regression TrendRegression trends are typically used to determine when a price is unusually far from its baseline. The script calculates the linear regression of volume and price to determine the trend direction and strength. This can be used to determine the volume support for upward/downward trends.
As a special feature, this indicator allows you to choose from three (as of 07/20/2021) templates with special presets.
The following templates are available:
"Precise" (Period: 4, Smoothing Factor Type: "DISABLED", Smoothing Factor Length = 1).
"Smooth" (Period: 4, Smoothing Factor Type: "RMA", Smoothing Factor Length = 2)
"Long Term (Period: 20, Smoothing Factor Type: "DISABLED", Smoothing Factor Length = 1)
In the selection for templates, the option "DISABLED" can also be selected. Then the user-defined settings selectable under it take effect. There are the following setting options.
"Length": Adjustable period
"Smoothing Factor: Type": Type of moving average
"Smoothing Factor: Length": Adjustable period
Other setting options are:
Color codes: The color codes are explained in the settings
Display types: "Columns", "Histogram", "Area", "Line", "Stepline"

Financial Astrology Indexes ML Daily TrendDaily trend indicator based on financial astrology cycles detected with advanced machine learning techniques for some of the most important market indexes: DJI, UK100, SPX, IBC, IXIC, NI225, BANKNIFTY, NIFTY and GLD fund (not index) for Gold predictions. The daily price trend is forecasted through planets cycles (angular aspects, speed phases, declination zone), fast cycles are based on Moon, Mercury, Venus and Sun and Mid term cycles are based on Mars, Vesta and Ceres . The combination of all this cycles produce a daily price trend prediction that is encoded into a PineScript array using binary format "0 or 1" that represent sell and buy signals respectively. The indicator provides signals since 2021-01-01 to 2022-12-31, the past months signals purpose is to support backtesting of the indicator combined with other technical indicator entries like MAs, RSI or Stochastic . For future predictions besides 2022 a machine learning models re-train phase will be required.
When the signal moving average is increasing from 0 to 1 indicates an increase of buy force, when is decreasing from 1 to 0 indicates an increase in sell force, finally, when is sideways around the 0.4-0.6 area predicts a period of buy/sell forces equilibrium, traders indecision which result in a price congestion within a narrow price range.
We also have published same indicator for Crypto-Currencies research portfolio:
DISCLAIMER: This indicator is experimental and don’t provide financial or investment advice, the main purpose is to demonstrate the predictive power of financial astrology. Any allocation of funds following the documented machine learning model prediction is a high-risk endeavour and it’s the users responsibility to practice healthy risk management according to your situation.

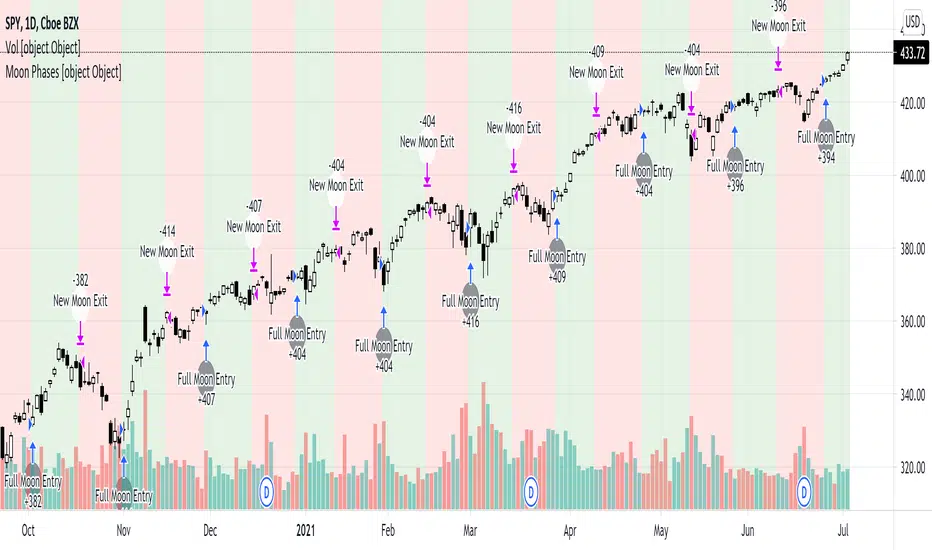
Simple Moon Phases StrategySimple Moon Phases Strategy
This strategy is very basic and needs some filters to improve results. It was created to test the Moon Phase theory compared to just a buy and hold strategy and it did not beat the buy and hold. However, if you flip the entry and exit signals to the opposite signals it performs a lot worse, so there might be some validity to the Moon Phases having an effect on the markets. I might try to add some filters and increase hold times with trailing stops in a separate version.
WARNING: This strategy uses hard-coded dates from 1/1/2015 until 12/31/2021 only! Any dates outside of that range need to be added manually in the code or it will not work. I may or may not update this so please don't be upset if it stops working after 12/31/2021.
Feel free to use any part of this code and please let me know if you can improve on this strategy.
Financial Astrology Neptune LongitudeNeptune energy influence the charity, confusion, imagination, waste, crime, intuition, occult, scandal, illusion and dreams. It rules the industries related to chemicals, gas and oil, drugs and alcoholic beverages, scams, non profit organisations, spirituality. The last decade Neptune have been traveling through Piscis sign which caused humanity to have an illusion that economical growth don't have limits, as consequence we saw US indexes growth toward new all time highs. However, Neptune is close to leave Piscis, in 7 more degrees as per July 2021 and new cycle is going to start. It will be interesting to see what happens as Neptune moves into Aries sign.
This longitude indicator show a zodiac signs horizontal line boundaries that identify the start of the sign marked in the corresponding horizontal line label in the Y axis, this simplify the analysis of a planet effect within specific zodiac sign.
Note: The Neptune longitude indicator is based on an ephemeris array that covers years 2010 to 2030, prior or after this years the data is not available, this daily ephemeris are based on UTC time so in order to align properly with the price bars times you should set UTC as your chart timezone.

Financial Astrology Uranus LongitudeUranus energy influence the wish to change, to innovate, to disrupt the confort zone, is the spirit of the inventions, revolutions and technology. Rules the industries of electricity, computing, aviation, technology, fin-tech and internet (because without web servers that needs electricity the network cannot operate). Through the course of the zodiac Uranus will reveal the human sectors that will be disrupted, at this moment 2021 is moving through Taurus so is expected that human finances are disrupted which is currently happening with all the innovations and momentum of the fin-tech startups that are innovating applications of the blockchain.
Note: The Uranus longitude indicator is based on an ephemeris array that covers years 2010 to 2030, prior or after this years the data is not available, this daily ephemeris are based on UTC time so in order to align properly with the price bars times you should set UTC as your chart timezone.
SWING for GOLD / BITCOIN Hey everyone
I want to share my swing trading system with you.Based on two moving averages coupled to RSI
The options
Shows current trends and entries for trades. Average trade retention 15-20 days
Entries for trades with a crossover of two lines
The percentage of successful test deals XAU/USD for 2010-2021: 69%

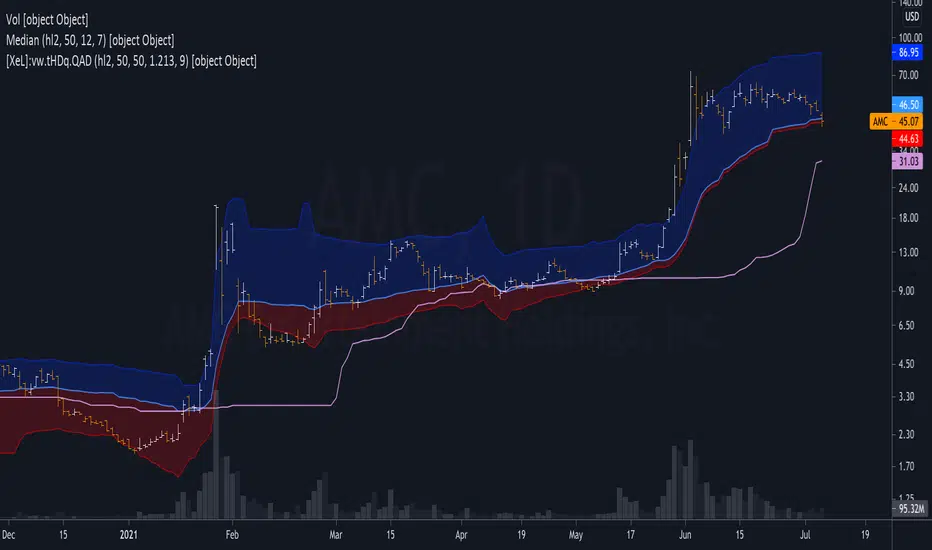
Weighted Harrell-Davis Quantile Estimator with AbsoluteDeviation
QUANTILE ESTIMATORS
Weighted Harrell-Davis Quantile Estimator with Absolute Deviation Fences.
DISCLAIMER:
The Following indicator/code IS NOT intended to be a formal investment advice or recommendation by the author, nor should be construed as such. Users will be fully responsible by their use regarding their own trading vehicles/assets.
The following indicator was made for NON LUCRATIVE ACTIVITIES and must remain as is, following TradingView's regulations. Use of indicator and their code are published for work and knowledge sharing. All access granted over it, their use, copy or re-use should mention authorship(s) and origin(s).
WARNING NOTICE!
THE INCLUDED FUNCTION MUST BE CONSIDERED FOR TESTING. The models included in the indicator have been taken from open sources on the web and some of them has been modified by the author, problems could occur at diverse data sceneries, compiler version, or any other externality.
Purpose:
Weighted Quantiles or <> are quite difficult to find on must systems, also it's non-weighted approach are rarely used to estimate the location parameter of price distribution WICH IS NOT NORMAL, all this in favour of it's non-robust counterpart, the Arithmetic rolling Mean or <> and it's weighted variants like the WMA, VWAP, etc.
Also, a big drawback from this is that must statistics derived from Normal-Distribution parameter location (the Mean) definitely will not fit for an efficient, nor robust estimation for price distributions, so their moments like the standard deviation, kurtosis, skewness, etc. will not be the better tools to build derived algorithms or technical indicators among price/volume.
In an effort searching better statistical tools for price distributions, I found the excellent work of Andrey Akinshin that took me to port some of their Math research contributions for the compute benchmarking field , and bring it here at the TradingView ecosystem to take a shot at the price distribution crazy fields. For a better detail of what the weighted Harrell-Davis Quantile Estimator can do, who better than drink directly from the source at References:
References:
Weighted Quantile Estimators.
DoubleMAD outlier detector based on the Harrell-Davis quantile estimator.
Unbiased median absolute deviation based on the Harrell-Davis quantile estimator.
Quantile confidence intervals for weighted samples.
Licensing:
This work is licensed under a Attribution-NonCommercial-ShareAlike 4.0 International Copyright (c) 2021 (CC BY-NC-SA 4.0)
Copyright's & Mentions:
The Gamma Functions & Beta Probability Density Functions C# implementations by the Math.NET Numerics, part of the Math.NET Project.
The Regularized Incomplete (Left) Beta Function C# implementation by the SAMTools, htslib project.
The Weighted Harrell-Davis Quantile estimator ; C# & R implementations by Andrey Akinshin.
External PineScript code, methods, support & consultancy by @PineCoders staff with special mention for:
+ "ma sorter ('sort by array' example)- JD" by @Duyck.
+ Porting, mods, compilation and debugging for this script by @XeL_Arjona for the TradingView's @PineCoders community.
Ultimate Momentum Indicator [CC]This is a custom indicator of mine loosely based on the work by Steve J Godwin & Louisa C Schneider (Stocks and Commodities Feb 2021 pg 22) and this works pretty well at anticipating future price swings as the momentum falls. The idea I was going for was to introduce the idea of reversals in combination with a momentum indicator so you can better identify peaks and valleys. I have included strong buy and signals in addition to normal ones so darker colors are the strong buy and sell signals and lighter colors are the normal ones. I would recommend to buy when the line turns green and sell when it turns red.
Let me know if there are any other indicators you would like me to publish!
Ichimoku Cloud Strategy Long Only [Bitduke]Slightly modificated and optimized for Pine Script 4.0, Ichimoku Cloud Strategy which, suddenly, good suitable for the several crypto assets.
Details:
Enter position when conversion line crosses base line up, and close it when the opposite happens.
Additional condition for open / close the trade is lagging span, it should be higher than cloud to open position and below - to close it.
Backtesting:
Backtested on SOLUSDT ( FTX, Binance )
+150% for 2021 year, 8% dd
+191% for all time, 32% dd
Disadvantages:
- Small number of trades
- Need to vary parameters for different coins (not very robust)
Should be tested carefully for other coins / stock market. Different parameters could be needed or even algo modifications.
Strategy doesn't repaint.

MACD RSI 2021-6-27This combines a trend based setting (MACD) and an oscillator (RSI) into one, creating a little extra room to add something else. Everything is colored based on whether RSI above/below 50. Adjust the parameters to your liking. Of course, this setting works best when used on multiple time frames: Enter on one time frame, take profits on a lower one.

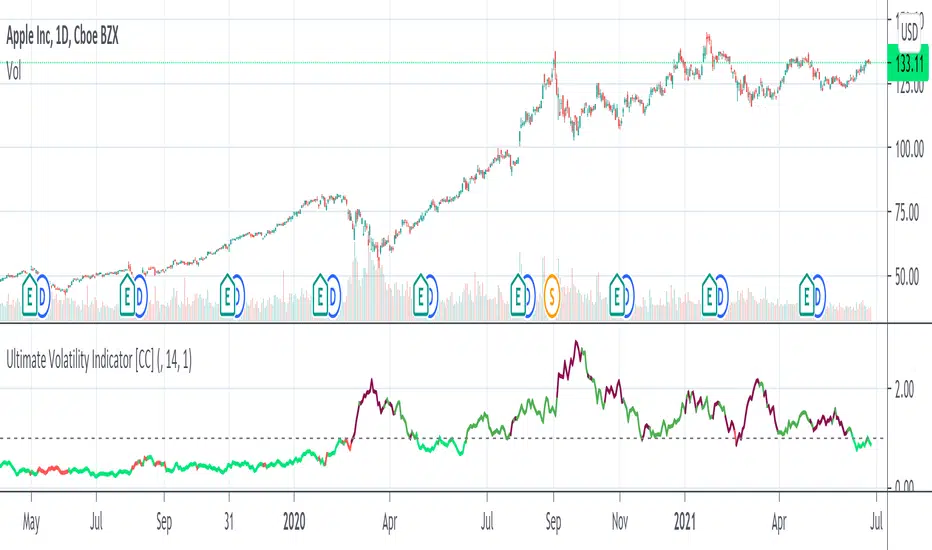
Ultimate Volatility Indicator [CC]The Ultimate Volatility Indicator was created by Richard Poster (Stocks and Commodities July 2021 pg 21) and this is a very simple but effective indicator. The idea behind volatility indicators is that when the indicator rises above a certain threshold then volatility is high enough and you can make a good amount of money riding the trend in the current direction and then exit when volatility drops below the threshold or until the underlying trend changes.
I have included a threshold that you can change from the default but I would recommend trying out different values to see what works best for you. This indicator will let you know as soon as volatility increases and reacts very quickly. I have included strong buy and sell signals in addition to normal ones so darker colors are strong buy and sell signals and lighter colors are normal signals. Buy when the line turns green and sell when it turns red.
Please let me know if you would like to see me publish any other indicators!
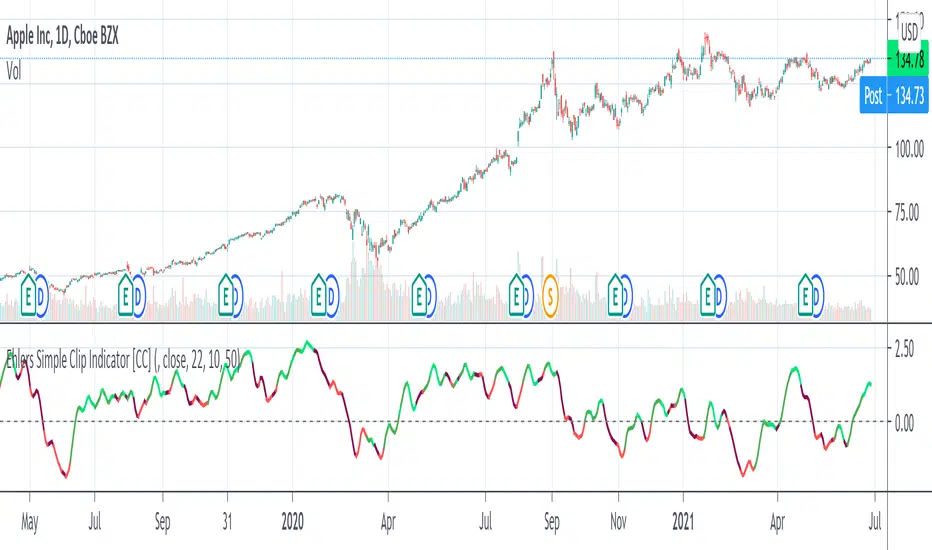
Ehlers Simple Clip Indicator [CC]The Simple Clip Indicator was created by John Ehlers (Stocks and Commodities June 2021 pg 10) and this is obviously very similar to the previous indicator I published ( Ehlers Simple Deriv Indicator ) so I would recommend to try both out and see what you prefer. This is a new momentum indicator that is extremely responsive to price changes and when the indicator is above 0 then this means the stock is in a long term uptrend and when it is below 0 then it is in a long term downtrend. I have color coded the indicator line to show you both strong buy and sell signals and normal buy and sell signals. Dark colors are strong signals and of course green means a buy signal and red means a sell signal. I did change the original buy and sell signals that Ehlers included in his scripts because I didn't find that they worked very well so let me know what you think of my changes.
Let me know if there are any other indicators you would like to see me publish!