ATR Timeframe RangeThis indicator shows the ATR range on the daily or any other timeframe on your current chart. All settings are fully customize-able.
ابحث في النصوص البرمجية عن "ATR"

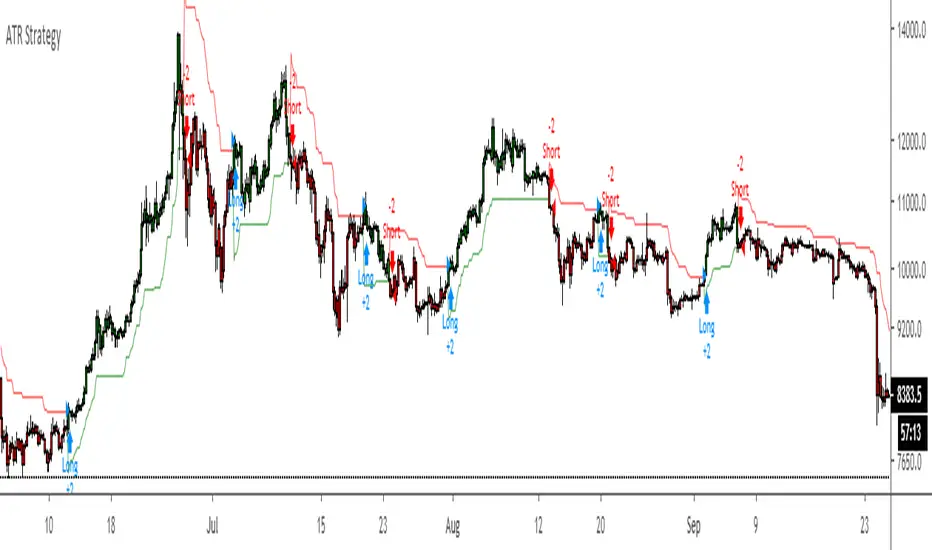
ATR Strategy Back test Original script by HPotter
ATR strategy is profitable.
Buy when it says buy and sell when it says sell.
ATR, Kijun-Sen, %R Strategy [No Nonsense FX]A strategy that employs the No Nonsense FX method as described by VP.
1. Risk: ATR
2. Baseline: Kijun-Sen
3. Confirmation #1: Williams % Range
4. Volume: TBD
5. Confirmation #2: TBD
6. Exit: TBD
Give me a follow if you enjoy and please PM me for more info/collabs!
Notes:
The defaults seem to work on all pairs
Please check the "two digit" box if running on JPY or Metals
If you have any ideas for a volume indicator, confirmation, and/or exit leave a comment!

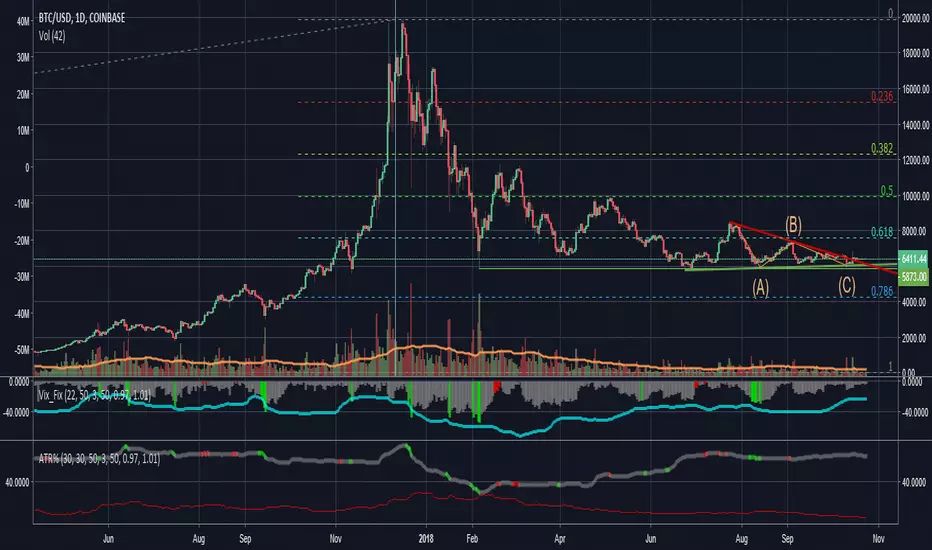
ATR in %Muh indicator :)
Simple but so useful little script. I work in percents because this is what makes sense not "pips" and "ticks" my account grows or diminishes a certain percentage I risk "1%" for example not ticks, ticks is what bad dogs have.
Was tired of calculating manually every time.
Makes it easier to set stop losses, get an idea of what to expect, risk in a kind of worse case scneario, backtest strategies, compare charts etc quickly. More quick now.
Example.
Bitcoin and NatGas, you do NOT need leverage...
optionsellers.com that somehow got surprised by Natgas volatility and squeezed, I think he did not bother doing this...
Happens all the time on NatGas, that "short seller catastrophy" that made the headlines was not even that big of a spike...
Plenty of way worse ones not long ago
ATR Z ScoreThis script normalizes ATR to a Z Score, or a number of standard deviations it is from its long term average, positive or negative.

ATR * 1.5 FX Stop LossPlots two lines to help with back testing strategies assuming a Stop less set at ATR*1.5

ATR TrueThis is True Average True Range, ((Hi-Low)/Lenght), Lenght (1,2 and more), no EMA, SMA etc.
Only based on Hi/Low Lenght.
Why Is all ATR bulish there is not correctly?

ATR Ranging market backgroundJust publishing a separate indicator from my ATR & RSI indicator if ever you liked to analyze and use them separate. Have a nice day

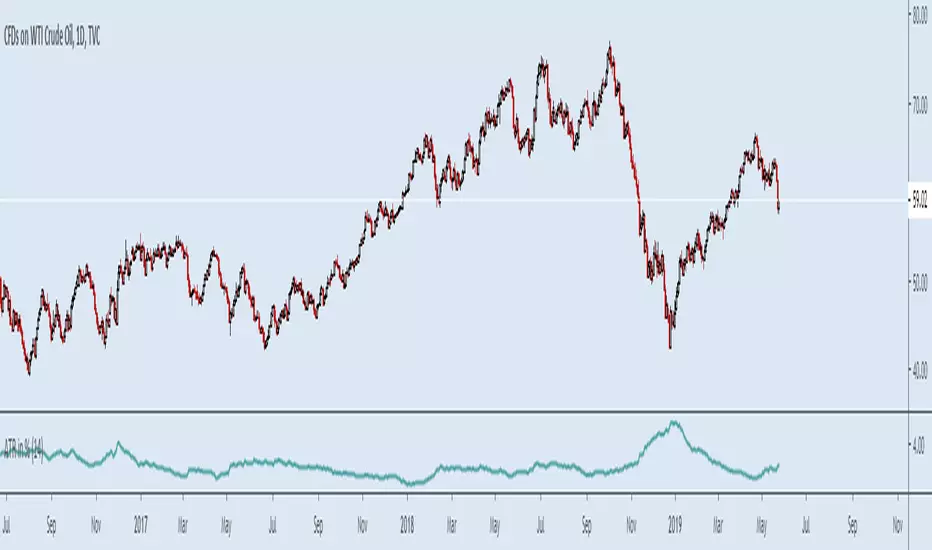
ATR and VIX For Profit Target and RSI LimitThe red line, based on ATR, should be used as a percentage gain goal. So I will set my profit targets based on this percentage.
The grey line is based on William's VIX and I use it to judge what RSI I should sell at.
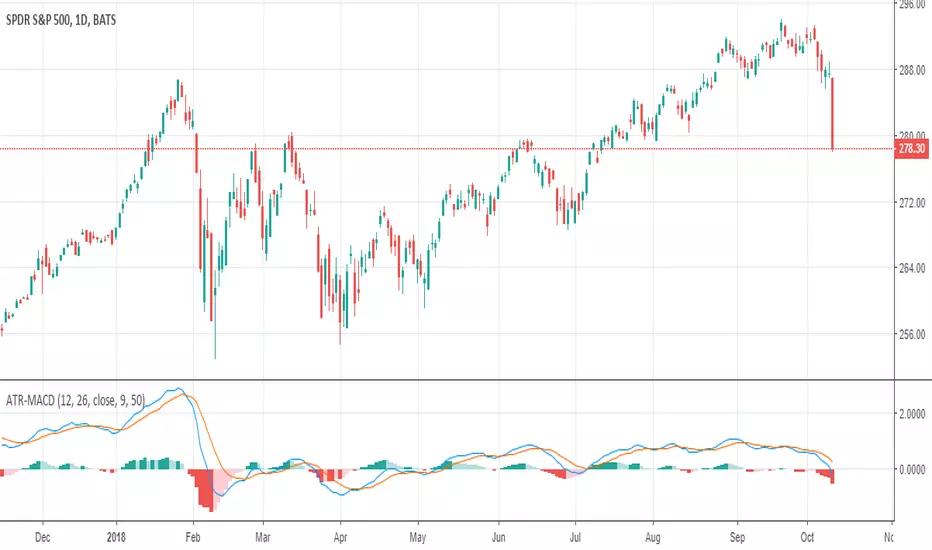
ATR adjusted MACDWhen running MACD, it can be useful to compare the value of the MA difference to other values. In other words, is a particular stock or futures contract at a more extreme MACD value than another. This can be done by dividing by the price, however, that doesn't adjust for volatility differences. Using ATR, one can adjust for price and volatility at the same time, allowing comparisons between securities more easily.
ATR Trailing Stop Bands Strategy [R] Originally based on a script by HPotter for an ATR Trailing Stop, which itself was based on an article by Sylvain Vervoort, but I adapted it to add Bands, to add extra optional Wick Protection, and have now made it a Strategy. It's not great for entries/exits, but as a Trailing Stop that can let winners ride, it's great.

ATR Stretched Market [zauoyds]This indicator verify the close in comparison with EMA21. If the number is higher than 2ATR, the X is ploted above the candle.
Avoid positions when the candle is marked.
The best entries always will be close to the averages.
You can change the values through the inputs, according with your trade system.
ATR Stop LossAdds an indicator that can be used to set stop losses.
This is the close price minus the ATR + 10%.
The 10% is there to let the market perform and avoid whipsaws.

ATR on ChartPlots the ATR on the chart for easy visualization, default TF is the Daily but you can alter it.

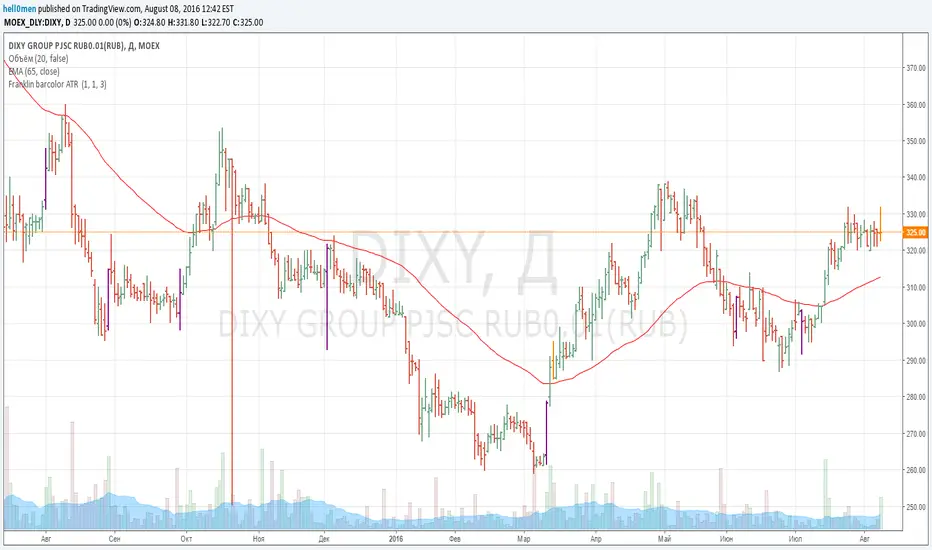
Franklin ATR Bar highlight by els (robotfarm.ru)Script highlights signal bars for tfc3.ru school trading strategy. Working timeframe D.
ATR Pips [LazyBear] [Elixium Mod: FEAR GAUGE]Modified version of ATR Pips
The indicator's value is a third of the daily range which is good to use as a stop loss value for intra day scalping on markets such as index futures and forex.
It's good for detecting and confirming inflection points in the market.

Average True Range Trailing Mean [Alifer]Upgrade of the Average True Range default indicator by TradingView. It adds and plots a trailing mean to show periods of increased volatility more clearly.
ATR TRAILING MEAN
A trailing mean, also known as a moving average, is a statistical calculation used to smooth out data over time and identify trends or patterns in a time series.
In our indicator, it clearly shows when the ATR value spikes outside of it's average range, making it easier to identify periods of increased volatility.
Here's how the ATR Trailing Mean (atr_mean) is calculated:
atr_mean = ta.cum(atr) / (bar_index + 1) * atr_mult
The ta.cum() function calculates the cumulative sum of the ATR over all bars up to the current bar.
(bar_index + 1) represents the number of bars processed up to the current bar, including the current one.
By dividing the cumulative ATR ta.cum(atr) by (bar_index + 1) and then multiplying it by atr_mult (Multiplier), we obtain the ATR Trailing Mean value.
If atr_mult is set to 1.0, the ATR Trailing Mean will be equal to the simple average of the ATR values, and it will follow the ATR's general trend.
However, if atr_mult is increased, the ATR Trailing Mean will react more strongly to the ATR's recent changes, making it more sensitive to short-term fluctuations.
On the other hand, reducing atr_mult will make the ATR Trailing Mean less responsive to recent changes in ATR, making it smoother and less prone to reacting to short-term volatility.
In summary, adjusting the atr_mult input allows traders to fine-tune the ATR Trailing Mean's responsiveness based on their preferred level of sensitivity to recent changes in market volatility.
IMPLEMENTATION IN A STRATEGY
You can easily implement this indicator in an existing strategy, to only enter positions when the ATR is above the ATR Trailing Mean (with Multiplier-adjusted sensitivity). To do so, add the following lines of codes.
Under Inputs:
length = input.int(title="Length", defval=20, minval=1)
atr_mult = input.float(defval=1.0, step = 0.1, title = "Multiplier", tooltip = "Adjust the sensitivity of the ATR Trailing Mean line.")
smoothing = input.string(title="Smoothing", defval="RMA", options= )
ma_function(source, length) =>
switch smoothing
"RMA" => ta.rma(source, length)
"SMA" => ta.sma(source, length)
"EMA" => ta.ema(source, length)
=> ta.wma(source, length)
This will allow you to define the Length of the ATR (lookback length over which the ATR is calculated), the Multiplier to adjust the Trailing Mean's sensitivity and the type of Smoothing to be used for the ATR.
Under Calculations:
atr= ma_function(ta.tr(true), length)
atr_mean = ta.cum(atr) / (bar_index+1) * atr_mult
This will calculate the ATR based on Length and Smoothing, and the resulting ATR Trailing Mean.
Under Entry Conditions, add the following to your existing conditions:
and atr > atr_mean
This will make it so that entries are only triggered when the ATR is above the ATR Trailing Mean (adjusted by the Multiplier value you defined earlier).
ATR - DEFINITION AND HISTORY
The Average True Range (ATR) is a technical indicator used to measure market volatility, regardless of the direction of the price. It was developed by J. Welles Wilder and introduced in his book "New Concepts in Technical Trading Systems" in 1978. ATR provides valuable insights into the degree of price movement or volatility experienced by a financial asset, such as a stock, currency pair, commodity, or cryptocurrency, over a specific period.
ATR - CALCULATION AND USAGE
The ATR calculation involves three components:
1 — True Range (TR): The True Range is a measure of the asset's price movement for a given period. It takes into account the following factors:
The difference between the high and low prices of the current period.
The absolute value of the difference between the high price of the current period and the closing price of the previous period.
The absolute value of the difference between the low price of the current period and the closing price of the previous period.
Mathematically, the True Range (TR) for the current period is calculated as follows:
TR = max(high - low, abs(high - previous_close), abs(low - previous_close))
2 — ATR Calculation: The ATR is calculated as a Moving Average (MA) of the True Range over a specified period.
The ATR is calculated as follows:
ATR = MA(TR, length)
3 — ATR Interpretation: The ATR value represents the average volatility of the asset over the chosen period. Higher ATR values indicate higher volatility, while lower ATR values suggest lower volatility.
Traders and investors can use ATR in various ways:
Setting Stop Loss and Take Profit Levels: ATR can help determine appropriate stop-loss and take-profit levels in trading strategies. A larger ATR value might require wider stop-loss levels to allow for the asset's natural price fluctuations, while a smaller ATR value might allow for tighter stop-loss levels.
Identifying Market Volatility: A sharp increase in ATR might indicate heightened market uncertainty or the potential for significant price movements. Conversely, a decreasing ATR might suggest a period of low volatility and possible consolidation.
Comparing Volatility Between Assets: Since ATR uses absolute values, it shouldn't be used to compare volatility between different assets, as assets with higher prices will consistently have higher ATR values, while assets with lower prices will consistently have lower ATR values. However, the addition of a trailing mean makes such a comparison possible. An asset whose ATR is consistently close to its ATR Trailing Mean will have a lower volatility than an asset whose ATR continuously moves far above and below its ATR Trailing Mean. This can help traders and investors decide which markets to trade based on their risk tolerance and trading strategies.
Determining Position Size: ATR can be used to adjust position sizes, taking into account the asset's volatility. Smaller position sizes might be appropriate for more volatile assets to manage risk effectively.

Volatility Regimes | GainzAlgo📊 OVERVIEW:
=========
This is a comprehensive ATR-based trading system designed for professional
traders who need advanced volatility analysis, precise trade management, and
intelligent market regime detection. The indicator combines multiple proven
volatility concepts into one powerful, customizable tool.
⭐ WHY THIS SYSTEM IS UNIQUE AND WORTHY OF PUBLICATION:
====================================================
This is not simply a collection of ATR-based indicators placed together.
It represents a unified volatility analysis framework where each component
is specifically designed to work in concert with the others, creating a
complete trading workflow that cannot be replicated by using multiple
separate indicators.
🔗 SYNERGISTIC INTEGRATION - How Components Work Together:
🧠 1. CONTEXT-AWARE ANALYSIS
The Volatility Regime Detection acts as the "brain" of the system,
classifying market conditions into 4 distinct phases. Every other
component then adapts its behavior based on this regime classification:
- ATR Bands expand/contract with regime changes
- Stop Loss distances automatically adjust (tighter in compression,
wider in high volatility)
- Take Profit targets scale proportionally to current regime
- Signal sensitivity filters itself based on market phase
📐 2. UNIFIED VOLATILITY FOUNDATION
All calculations share a single ATR baseline calculation, ensuring
internal consistency across the entire system. When ATR changes, every
element updates in perfect synchronization:
- Bands recalculate from the same ATR value
- Risk management levels use the same volatility measurement
- Regime classification and signals reference identical data
🛡️ 3. INTEGRATED RISK MANAGEMENT
The system doesn't just show WHERE to enter - it calculates HOW MUCH
to risk:
- Dynamic Stop Loss adapts to current ATR automatically
- Position Size Calculator uses the dynamic stop to compute exact quantities
- Take Profit levels scale proportionally, maintaining optimal risk:reward
✅ 4. TWO-STAGE SIGNAL CONFIRMATION
The alert system creates a logical progression:
Step 1: Volatility Breakout → Market energy is building
Step 2: Trend Confirmation → Direction confirmed with volatility support
This prevents false breakouts by requiring both volatility AND direction.
🏦 5. PROFESSIONAL WORKFLOW INTEGRATION
The system mirrors how institutional traders analyze markets:
Phase 1: Assess regime → What's the market doing?
Phase 2: Identify setup → Where's the opportunity?
Phase 3: Calculate risk → What's my exposure?
Phase 4: Set targets → Where do I take profit?
Phase 5: Monitor regime → When do conditions change?
❌ WHY NOT USE SEPARATE INDICATORS?
- Separate ATR Bands: Don't know about regime changes, remain static
- Separate Regime Indicator: Doesn't automatically adjust stop/targets
- Separate Position Calculator: Doesn't know your actual ATR-based stop
- Manual Integration: Requires constant mental calculation and cross-referencing
🧮 DETAILED CALCULATION METHODOLOGY:
=================================
📏 ATR (AVERAGE TRUE RANGE) CALCULATION:
- True Range = Maximum of:
1. Current High - Current Low
2. Absolute value of (Current High - Previous Close)
3. Absolute value of (Current Low - Previous Close)
- ATR = Simple Moving Average of True Range over specified period (default: 14)
📊 DYNAMIC ATR BANDS:
- Upper Band = Current Close + (ATR × Band Multiplier)
- Lower Band = Current Close - (ATR × Band Multiplier)
- Band 1: 1.0× ATR (closest support/resistance)
- Band 2: 2.0× ATR (intermediate zone)
- Band 3: 3.0× ATR (extended zone)
🌡️ VOLATILITY REGIME CLASSIFICATION:
Step 1: Calculate ATR Baseline
- Baseline ATR = SMA or EMA of ATR over long period (default: 50 bars)
- This represents "normal" volatility for the instrument
Step 2: Calculate ATR Ratio
- ATR Ratio = Current ATR ÷ Baseline ATR
- Example: If current ATR = 70 and baseline = 50, ratio = 1.40
Step 3: Classify Regime Based on Ratio
- COMPRESSION: Ratio < 0.70 (ATR is 30% below normal)
Market consolidating, volatility contracting, energy building
- EXPANSION: Ratio between 1.15 and 1.40 (ATR is 15-40% above normal)
Volatility breaking out, early phase of directional movement
- HIGH VOLATILITY: Ratio > 1.40 (ATR is 40%+ above normal)
Strong sustained trend with high participation
- EXHAUSTION: ATR declining after high volatility period
Requires: Previous high ratio + declining ATR over X bars (default: 5)
Trend maturity, potential reversal or consolidation approaching
🛑 DYNAMIC STOP LOSS CALCULATION:
- For Long Positions: Stop Loss = Entry Price - (ATR × SL Multiplier)
- For Short Positions: Stop Loss = Entry Price + (ATR × SL Multiplier)
- Default Multiplier: 2.0× ATR
- Adjusts automatically: Wider in high volatility, tighter in compression
🎯 TAKE PROFIT LEVELS:
- TP1 = Entry Price ± (ATR × TP1 Multiplier)
- TP2 = Entry Price ± (ATR × TP2 Multiplier)
- TP3 = Entry Price ± (ATR × TP3 Multiplier)
- Direction (+ or -) depends on trade direction
📦 POSITION SIZE CALCULATION:
Formula: Position Size = Account Risk Amount ÷ Stop Loss Distance
Step-by-step:
1. Risk Amount = Account Size × (Risk Percentage ÷ 100)
2. Stop Distance = |Entry Price - Stop Loss Price|
3. Position Size = Risk Amount ÷ Stop Distance
📈 ATR PERCENTILE RANKING:
- >80% = Extremely high volatility
- 20-80% = Normal volatility range
- <20% = Extremely low volatility
🌀 VOLATILITY CONTRACTION PATTERN:
Detects extended low-volatility periods indicating imminent breakout.
🧭 TREND DETECTION SIGNALS:
Bullish: Price > MA AND Current ATR > ATR MA
Bearish: Price < MA AND Current ATR > ATR MA
⚡ VOLATILITY BREAKOUT SIGNALS:
Triggered when ATR exceeds its moving average by a defined threshold.
🧩 CORE FEATURES:
==============
1. ATR BANDS (Dynamic Support/Resistance)
2. VOLATILITY REGIME DETECTION
3. DYNAMIC STOP LOSS SYSTEM
4. MULTIPLE TAKE PROFIT LEVELS
5. SUPPORT & RESISTANCE LEVELS
6. RISK MANAGEMENT CALCULATOR
7. ATR PERCENTILE RANKING
8. VOLATILITY CONTRACTION PATTERN
9. TREND DETECTION SIGNALS
10. VOLATILITY BREAKOUT SIGNALS
⚙️ RECOMMENDED SETTINGS BY TRADING STYLE:
======================================
DAY TRADING • SWING TRADING • POSITION TRADING • SCALPING
📘 HOW TO USE THIS INDICATOR:
==========================
STEP 1: Identify Market Regime
STEP 2: Wait for Entry Signal
STEP 3: Set Stop Loss
STEP 4: Set Take Profits
STEP 5: Position Sizing
STEP 6: Monitor & Manage
🔔 ALERT SYSTEM:
=============
Alerts for volatility breakouts, trend changes, regime transitions,
ATR band crossings, contraction completion, and percentile extremes.
🎨 CUSTOMIZATION:
==============
All visuals, thresholds, multipliers, colors, alerts, and risk parameters
can be fully customized.
⚠️ IMPORTANT DISCLAIMER:
=====================
This indicator is a volatility analysis tool and does NOT provide financial advice.
Past performance does not guarantee future results.
All trading involves substantial risk.
All trading decisions are the sole responsibility of the user.

Adaptive ATR Limits█ OVERVIEW
This indicator plots adaptive ATR limits for intraday trading. A key feature of this indicator, which makes it different from other ATR limit indicators, is that the top and bottom ATR limit lines are always exactly one ATR apart from each other (in "auto" mode; there is also a "basic" mode, which plots the limits in the more traditional way—i.e., one ATR above the low and one ATR below the high at all times—and this can be used for comparison).
█ FEATURES
Provides an algorithm to plot the most reasonable intraday ATR top/bottom limits based on currently available information
Dynamically adapts limits as the price evolves during the day
Works correctly and consistently on both RTH and ETH charts
Has a user-selected ADR mode to base the limits on ADR instead of ATR
Option to include the current pre-market and previous day's post-market range in the calculation
Configurable ATR/ADR averaging length
Provides a visual smoothing option
Provides an information box showing the current numerical ATR/ADR values
Reasonable defaults that work well if the user changes nothing
Well-documented, high-quality, open-source code for those interested
█ HOW TO USE
At a minimum, there is nothing that needs to be set. The defaults work well. The ATR top line (red, configurable) gives you the most reasonable move given the currently available information. The line will move away from the price as the price approaches it; that is normal—it is reacting to new information. This happens until the ATR bottom limit hits the lower of the daily low and the previous day's close (in ATR mode). The ATR bottom line (green, configurable) works the same way, with reversed logic.
There is an option to use ADR instead of ATR. The ATR includes the previous day's RTH close in the range, whereas ADR does not. Another option allows the user to add the current day's pre-market range or the previous day's post-market into the current day's range, which has an effect if either of those went outside of today's RTH range, plus yesterday's RTH close (in the default ATR mode). Pre-market and post-market range is not typically included in the daily true range, so only change it if you really know you want it.
█ CONCEPTS
Most traditional ATR limit indicators plot the top ATR limit one ATR above the current daily low, and the bottom ATR limit one ATR below the current daily high. This indicator can also do that (in "basic" mode), but its value lies in its default "auto" mode, which uses an algorithm to dynamically adapt the ATR limits throughout the day, keeping them one ATR apart at all times. It tries to plot the most sensible ATR limits based on the current daily ATR, in order to provide a reasonable visual intraday target, given the available information at that point in time.
"Auto" mode is actually a weighted average of two methods: midpoint and relative (both of which can also be explicitly selected). The midpoint method places the midpoint of the ATR limit equal to the midpoint of the currently established daily range. The relative method measures the currently established daily range and calculates the position of the current price within it (as a ratio between 0 and 1). It then uses that value as a weight in a weighted average of extreme locations for the ATR limits, which are: the ATR top anchored to one ATR above the daily low, and the ATR bottom anchored to one ATR below the daily high.
The relative method is more advanced and better for most of the day; however, it can cause wild swings in the early market or pre-market before a reasonable range (as a percentage of ATR) has been established. "Auto" mode therefore takes another weighted average between the two methods, with the weight determined by the percentage of the ATR currently established within the day, more strongly weighting the calmer midpoint method before a good range is established. Once the full ATR has been achieved, the algorithm in "auto" mode will have fully switched to the relative method and will remain with that method for the rest of the day.
To explain the effect further, as an example, imagine that the price is approaching the full ATR range on the high side. At this point, the indicator will have almost fully transitioned to the second (relative) method. The lower ATR limit will now be anchored to the daily low as the price hits the upper ATR limit. If the price goes beyond the upper ATR, the lower ATR limit will stay anchored to the daily low, and the upper limit will stay anchored to one ATR above the lower limit. This allows you to see how far the price is going beyond the upper ATR limit. If the price then returns and backs off the upper ATR limit, the lower ATR limit will un-anchor from the daily low (it will actually rise, since the daily ATR range has been exceeded, so the lower ATR limit needs to come up because the actual daily range can’t fit into the ATR range anymore). The overall effect is to give you the best visual indication of where the price is in relation to a possible upper ATR-based target. Reverse this example for when the price low approaches the ATR range on the low side.
Care was taken so that the code uses no hard-coded time zones, exchanges, or session times. For this reason, it can in principle work globally. However, it very much depends on the information provided by the exchange, which is reflected in built-in Pine Script variables (see Limitations below).
█ LIMITATIONS
The indicator was developed for US/European equities and is tested on them only. It is also known to work on US futures; in this case, the whole 23-hour session is used, and the "Sessions to include in range" setting has no effect. It may or may not work as intended on security types and equities/futures for other countries.
