TPA BTC INDEX COLOR only for BTC/Legal currency, 4H(240min)TPA BTC INDEX COLOR only for BTC/Legal currency, 4H(240min)
또땃 비트 인덱스컬러 (BTCUSD나 KRW용)
Because we use Google Translator, translation may not be smooth.
------------------------------------------------
1.단기존 (Short term zone)
라임색에 줍고 주황~빨간색에 턴다.
빨강->라임 또는 라임->빨강 손에서는 주의한다.
알트존이 초록불일때는 단기존이 초록일때 줍지만 알트존이 붉은색으로 변하면 빨리 털거나 단기존이 주황~빨강쯤 왔을때 턴다
Pick it up in lime and sell it in orange to red.
Be careful in the red - > lime or lime - > red section.
When alt zone is a green light, pick it up when it is green. When Alt Zone turns red, it sells quickly or when it comes to orange or red.
------------------------------------------------
2.알트존 (Alt zone)
알트코인 투자시 급락 가능성이 적고 상방추세를 탔을때 투자를하기 위해서는 알트존이 초록불일때 투자를 하면 된다.
There is little possibility of a sharp drop in investment when investing in alt coins, and investment can be made when Alt Zone is green.
------------------------------------------------
3.계절 존(Season zone)
계절존이 초록색(여름)이면 향후 상방을 향해 갈 확률이 높은 상황이다.
적색이면 하락할 확률이 전체적으로 높다.방어적 투자할것
If the zone is green (summer), chances are high that it will move upward.
There is a high overall probability of falling in red.We need defensive investment.
------------------------------------------------
4.광기장 고점파악용(Madness zone)
광기장 판단은 장기존이 붉은색인체로 지속될때 광기장으로 명한다. 해당 구간은 급격한상승 하락이 있으므로(퍼센티지상)
4번라인의 색이 붉게 되면 매도한다. 옅은 주황이나 연두에 줍고 해당라인이 붉게된 근처에서 설거지 파동에 매도를 하면 된다.
The decision to determine whether " Madness Zone " is to be made by longtermzone as the continuation of red. Because of the sharp decline in the corresponding section, sell the fourth line when it turns red. You can pick it up in light orange or green tea and sell it on last waves near the line.
------------------------------------------------
5.장기존(long term zone)
저점매수하기 좋은 라인은 초록색으로 매도가 인접하면 붉은색으로 표기된다.
A good line to buy a low point is green, and if a sell is adjacent, it is marked red.
------------------------------------------------
Only for BTC/ Chart(4h, 240min)
알트존,계절존 모두 녹색인 구간에서 투자하는게 가장 안전하다.
계절존이 붉은데 알트존이 초록이라면 보험용 금액을 만들어라.
계절존이 초록인데 알트존이 붉은 색 이라면 단기존이 초록일때 주워라.
It is safest to invest in green zone, alt zone and season zone.
If the season zone is red and the alt zone is green, make an insurance premium.
If the season zone is green and the alt zone is red, pick it up when the original is green.
------------------------------------------------
업그레이드 예정:
색 변경시 알람 컨디션.
알트코인 차트를 켜도 TPA BTC INDEX COLOR 를 사용할수 있게 하는 기능.
Upcoming upgrade:
Alarm condition when color change.
Ability to use TPA BTC INDEX COLOR even when turning on an Altcoin chart.
ابحث في النصوص البرمجية عن "BTC"

Gold Market Cap vs BTC Market Cap Ratio
What the script calculates
Gold market cap: XAUUSD spot price × total above-ground stock (converted to troy ounces) in trillions USD.
BTC market cap: Live data from TradingView's CRYPTOCAP:BTC symbol, which provides Bitcoin's circulating market cap (already in USD, converted to trillions here).
Ratio: Gold market cap ÷ BTC market cap (e.g., 1.0 means gold market cap equals BTC; 2.0 means gold is twice BTC's market cap)

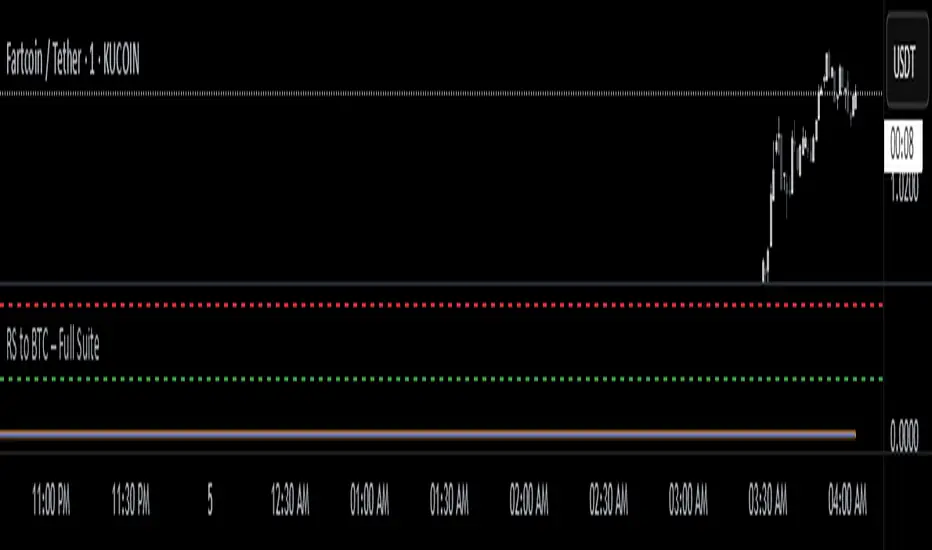
RS to BTC – EYASU V1RS to BTC – Full Suite
📝 Description:
This script tracks the relative strength of any coin against Bitcoin (RSBTC) in real-time. It is designed for altcoin traders who want to identify which coins are outperforming or underperforming BTC across multiple timeframes.
Features:
📈 RSBTC Line: Real-time plot of the altcoin’s price divided by BTC price
🟦 RSBTC Moving Average: Smooths the RS line to help identify trends
🔵 RSBTC RSI (Hidden by default): Highlights momentum of RS to detect overbought/oversold zones
🚨 Alerts: Set alerts for RSBTC crossing its moving average and RSI levels
Ideal for:
Spotting early altcoin breakouts
Timing entries/exits based on BTC-relative performance
Filtering for strong/weak coins before macro news
📱 Fully mobile compatible. Load it on any USDT chart — it auto-detects BTC and gives RS instantly.
Created by: @Eyasustock
License: Mozilla Public License 2.0
MVRVZ BTCMVRVZ BTC (Market Value to Realized Value Z-Score)
Description:
The MVRVZ BTC indicator provides insights into the relationship between the market value and realized value of Bitcoin, using the Market Value to Realized Value (MVRV) ratio, which is then adjusted using a Z-Score. This indicator highlights potential market extremes and helps in identifying overbought or oversold conditions, offering a unique perspective on Bitcoin's valuation.
How It Works:
MVRVZ is calculated by taking the difference between Bitcoin's Market Capitalization (MC) and Realized Capitalization (MCR), then dividing that by the Standard Deviation (Stdev) of the price over a specified period (usually 104 weeks).
The resulting value is plotted as the MVRVZ line, representing how far the market price deviates from its realized value.
Z-Score is then applied to the MVRVZ line, with the Z-Score bounded between +2 and -2, which allows it to be used within a consistent evaluation framework, regardless of how high or low the MVRVZ line goes. The Z-Score will reflect overbought or oversold conditions:
A Z-Score above +2 indicates the market is likely overbought (possible market top).
A Z-Score below -2 indicates the market is likely oversold (possible market bottom).
Values between -2 and +2 indicate more neutral market conditions.
How to Read the Indicator:
MVRVZ Line:
The MVRVZ line shows the relationship between market cap and realized cap. A higher value indicates the market is overvalued relative to the actual capital realized by holders.
The MVRVZ line can move above or below the top and bottom lines you define, which are adjustable according to your preferences. These lines act as trigger levels.
Top and Bottom Trigger Lines:
You can customize the Top Line and Bottom Line values to your preference.
When the MVRVZ line crosses the Top Line, the market might be considered overbought.
When the MVRVZ line crosses the Bottom Line, the market might be considered oversold.
SCDA Z-Score:
The Z-Score is displayed alongside the MVRVZ line and is bounded between -2 and +2. It scales proportionally based on the MVRVZ line's position relative to the top and bottom trigger lines.
The Z-Score ensures that even if the MVRVZ line moves beyond the trigger lines, the Z-Score will stay within the limits of -2 to +2, making it ideal for your custom evaluation system (SCDA).
Background Highlighting:
The background color changes when the MVRVZ line crosses key levels:
When the MVRVZ line exceeds the Top Trigger, the background turns red, indicating overbought conditions.
When the MVRVZ line falls below the Bottom Trigger, the background turns green, indicating oversold conditions.
Data Sources:
The data for the MVRVZ indicator is sourced from Glassnode and Coinmetrics, which provide the necessary values for:
BTC Market Cap (MC) – The total market capitalization of Bitcoin.
BTC Realized Market Cap (MCR) – The capitalization based on the price at which Bitcoin was last moved on the blockchain (realized value).
How to Use the Indicator:
Market Extremes:
Use the MVRVZ and Z-Score to spot potential market tops or bottoms.
A high Z-Score (above +2) suggests the market is overbought, while a low Z-Score (below -2) suggests the market is oversold.
Adjusting the Triggers:
Customize the Top and Bottom Trigger Lines to suit your trading strategy. These lines can act as dynamic reference points for when to take action based on the Z-Score or MVRVZ line crossing these levels.
Market Evaluation (SCDA Framework):
The bounded Z-Score (from -2 to +2) is tailored for your SCDA evaluation system, allowing you to assess market conditions based on consistent criteria, no matter how volatile the MVRVZ line becomes.
Conclusion:
The MVRVZ BTC indicator is a powerful tool for assessing the relative valuation of Bitcoin based on its market and realized capitalization. By combining it with the Z-Score, you get an easy-to-read, bounded evaluation system that highlights potential market extremes and helps you make informed decisions about Bitcoin's price behavior.

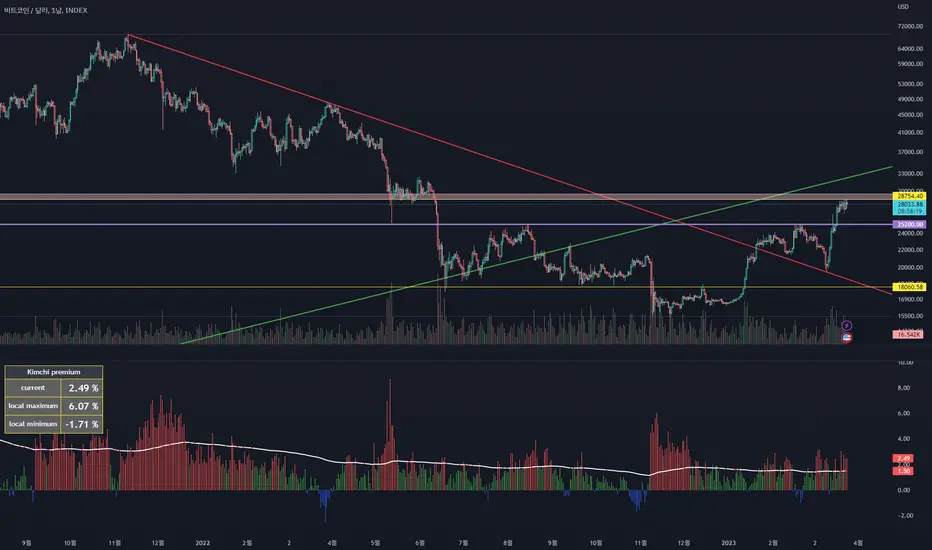
Kimchi premium with BTC gap [BIGTAKER]📊 Kimchi Premium with BTC gap
The BIGTAKER Kimchi Premium Indicator is a real-time tool that accurately tracks and visualizes the price discrepancy (Kimchi Premium) between the Korean KRW markets (Upbit or Bithumb) and global cryptocurrency exchanges.
In addition to displaying the premium on altcoins, it compares the difference against Bitcoin's premium and highlights abnormal divergence through signal alerts and visual cues.
🔧 Key Features
KRW Market Selection
Users can select either Upbit or Bithumb as the reference Korean exchange. Only altcoins listed on the selected exchange will be analyzed and shown.
Multi-Exchange Global Pricing
The global reference price is not fixed to a single exchange like Binance. Instead, the indicator dynamically uses the price data from the exchange that the user opens on TradingView — such as OKX, BYBIT, BITGET, GATE.IO, MEXC, and more.
If the global symbol is supported on TradingView, the corresponding market price is retrieved and converted into KRW using the FX rate, allowing real-time global-vs-Korea price comparison.
Accurate Premium Calculation
Altcoin Premium = ((KRW Price - Global Price in KRW) / Global Price in KRW) × 100
BTC Premium = ((BTC_KRW - BTC_USDT×FX) / (BTC_USDT×FX)) × 100
Premium Gap Signal Alerts
When the gap between altcoin premium and Bitcoin premium exceeds a user-defined threshold (e.g., 3%), the chart highlights the bar with a yellow background, and a signal alert is triggered.
Visual Data Representation
Bar colors automatically change based on premium intensity
BTC Kimchi Premium and Coinbase-Binance Premium lines are plotted together
The latest candle shows a label with the coin name and premium value
Integrated Alerts
Fully compatible with TradingView alerts — allowing users to receive instant notifications when the premium gap crosses the defined threshold.
⚙️ User Settings
Select Exchange: Choose domestic KRW market (Upbit / Bithumb)
Premium Gap Threshold (%): Set the minimum gap between altcoin and BTC premium to trigger signals (default: 3%)
🧠 Use Cases
Premium Gap Trading Strategies
Identify altcoins with unusually high premium divergence compared to BTC and take positions based on mean-reversion logic.
Market Overheating Detection
Detect abnormal buying pressure or local overvaluation when an altcoin’s premium rapidly expands beyond normal ranges.
Tracking Global vs. Korean Market Flow
Monitor capital flows by comparing KRW market premiums to real-time global market pricing.

Blockchain Fundamentals: Liquidity & BTC YoYLiquidity & BTC YoY Indicator
Overview:
This indicator calculates the Year-over-Year (YoY) percentage change for two critical metrics: a custom Liquidity Index and Bitcoin's price. The Liquidity Index is derived from a blend of economic and forex data representing the M2 money supply, while the BTC price is obtained from a reliable market source. A dedicated limit(length) function is implemented to handle limited historical data, ensuring that the YoY calculations are available immediately—even when the chart's history is short.
Features Breakdown:
1. Limited Historical Data Workaround
- Functionality: limit(length) The function dynamically adjusts the lookback period when there isn’t enough historical data. This prevents delays in displaying YoY metrics at the beginning of the chart.
2. Liquidity Calculation
- Data Sources: Combines multiple data streams:
USM2, ECONOMICS:CNM2, USDCNY, ECONOMICS:JPM2, USDJPY, ECONOMICS:EUM2, USDEUR
- Formula:
Liquidity Index = USM2 + (CNM2 / USDCNY) + (JPM2 / USDJPY) + (EUM2 / USDEUR)
[b3. Bitcoin Price Calculation
- Data Source: Retrieves Bitcoin's price from BITSTAMP:BTCUSD on the user-selected timeframe for its historical length.
4. Year-over-Year (YoY) Percent Change Calculation
- Methodology:
- The indicator uses a custom function, to autodetect the proper number of bars, based on the selected timeframe.
- It then compares the current value to that from one year ago for both the Liquidity Index and BTC price, calculating the YoY percentage change.
5. Visual Presentation
- Plotting:
- The YoY percentage changes for Liquidity (plotted in blue) and BTC price (plotted in orange) are clearly displayed.
- A horizontal zero line is added for visual alignment, making it easier to compare the two copies of the metric. You add one copy and only display the BTC YoY. Then you add another copy and only display the M2 YoY.
-The zero lines are then used to align the scripts to each other by interposing them. You scale each chart the way you like, then move each copy individually to align both zero lines on top of each other.
This indicator is ideal for analysts and investors looking to monitor macroeconomic liquidity trends alongside Bitcoin's performance, providing immediate insights.

Enhanced SPX and BTC Overlay with EMASPX-BTC Momentum Gauge and EMA Cross Indicator
Thorough Analysis:
• Combined Overlay (Green/Red Line):
o Function: Plots a wide line over the price chart, representing a composite of SPX and BTC dynamics adjusted by volume data.
o Color Coding:
Green: Indicates bullish conditions when the combined value exceeds its 10-period SMA and Bitcoin volume increases.
Red: Signals bearish conditions when the combined value drops below its 10-period SMA and Bitcoin volume decreases.
o Line Characteristics:
Width: Set at 8 for high visibility.
Transparency: 86% for both colors to overlay without obscuring candlesticks.
Scaling: Uses a factor of 0.02446 to amplify movements, making trend changes more noticeable.
• Continuous Bright Red and Green Lines:
o 20-period EMA of Current Ticker (Red):
Purpose: Acts as a medium-term trend indicator, smoothing price data to reflect the asset's general direction over time.
Color: Bright red for easy identification.
Transparency: 60% to keep it visible but not overpowering.
o 5-period EMA of BTC (Green):
Purpose: Provides insights into short-term Bitcoin momentum, capturing rapid changes in market sentiment.
Color: Bright green to distinguish from the red EMA.
Transparency: 30% for high visibility against price movements.
Detailed Analysis of the EMA Cross:
• Crossing Points:
o Bullish Crossover:
Occurs when the 5-period BTC EMA (green) moves above the 20-period EMA of the current ticker (red).
Suggests that Bitcoin's short-term momentum is gaining strength relative to the asset's medium-term trend, potentially signaling an upcoming uptrend or strengthening of an existing one.
o Bearish Crossover:
When the green line falls below the red, it indicates that Bitcoin's immediate momentum is weakening compared to the asset's medium-term trend, which might precede a downtrend or confirm one.
• Early Trade Signals:
o Entry/Exit Points:
These crossovers can guide traders in making timely decisions to enter or exit trades, especially when corroborated by the combined overlay's color.
o Confirmation:
EMA crossovers can confirm trends indicated by the combined overlay. For example, a bullish crossover with a green combined line could validate a buying opportunity.
o Volatility Insights:
The rapid shifts in Bitcoin's 5-period EMA highlight potential volatility spikes, offering an additional layer of market analysis, particularly useful in volatile markets.
• Strategic Use:
o Multi-Market Insight: The script integrates data from both traditional (SPX) and crypto (BTC) markets, allowing for a more comprehensive analysis of market conditions.
o Decision-Making: Provides traders with visual cues for market sentiment, trend direction, and potential reversals, enhancing strategic trading decisions.
o Trend Confirmation: The combination of EMA crossovers and the overlay's color changes offers a multi-faceted approach to trend confirmation or divergence.
In Summary:
• This script merges elements of traditional stock market analysis with cryptocurrency dynamics, utilizing color changes, line thickness, and EMA crossovers to visually communicate market conditions, offering traders a robust tool for analyzing and acting on market movements.

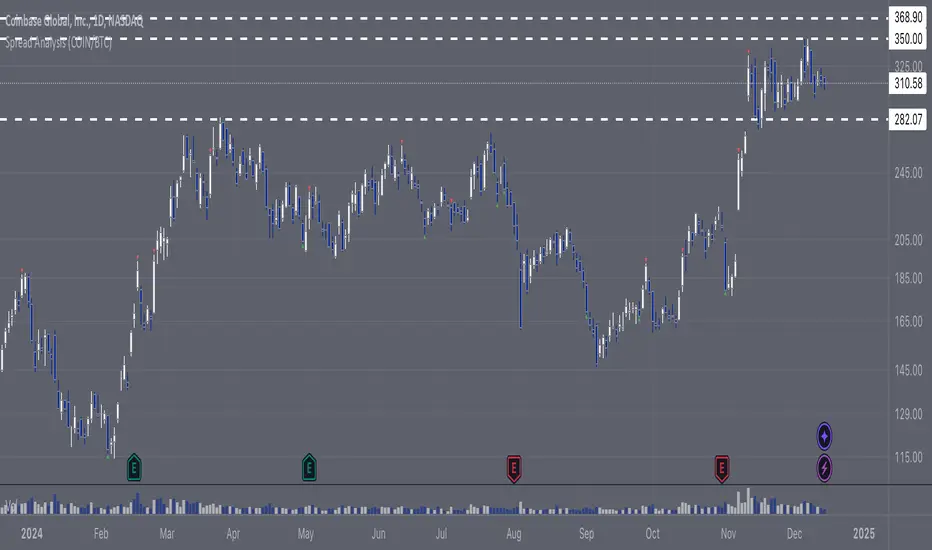
Spread Analysis (COIN/BTC)The Spread Analysis (COIN/BTC) indicator calculates the Z-score of the price ratio between Coinbase stock ( NASDAQ:COIN ) and Bitcoin ( CRYPTOCAP:BTC ). It helps identify overbought or oversold conditions based on deviations from the historical mean of their price relationship.
Key Features:
Z-Score Calculation:
• Tracks the relative price ratio of NASDAQ:COIN to $BTC.
• Compares the current ratio to its historical average, highlighting extreme overvaluation or undervaluation.
• Buy and Sell Signals:
• Buy Signal: Triggered when the Z-score is less than -2, indicating NASDAQ:COIN may be undervalued relative to $BTC.
• Sell Signal: Triggered when the Z-score exceeds 2, suggesting NASDAQ:COIN may be overvalued relative to $BTC.
• Dynamic Z-Score Visualization:
• Blue line plots the Z-score over time.
• Dashed lines at +2 and -2 mark overbought and oversold thresholds.
• Green and red triangles highlight actionable buy and sell signals.
Use Case:
This indicator is ideal for identifying relative valuation opportunities between NASDAQ:COIN and $BTC. Use it to exploit divergences in their historical relationship and anticipate potential reversions to the mean.
Limitations:
• Best suited for range-bound markets; may produce false signals in strongly trending conditions.
• Assumes a consistent correlation between NASDAQ:COIN and CRYPTOCAP:BTC , which may break during independent price drivers like news or earnings.
Upper and Lower bound for pairs/BTCUpper and Lower Bound for Pairs/BTC
This indicator provides dynamic upper and lower boundary levels for cryptocurrency pairs traded against BTC. It uses statistical or technical analysis methods, such as Z-Score, Bollinger Bands, or moving averages, to identify key resistance (upper bound) and support (lower bound) levels.
Key Features:
Dynamic Boundaries: Tracks real-time price fluctuations of selected pairs against BTC, adapting to market conditions.
Market Insights: Helps traders visualize potential overbought (upper bound) and oversold (lower bound) zones for pairs like ETH/BTC, DOGE/BTC, and others.
Customizable Settings: Allows users to configure lookback periods, standard deviations, or other parameters for boundary calculations.
Decision Support: Assists in identifying reversal or breakout points to refine entry and exit strategies.
This tool is ideal for traders seeking to optimize risk management and spot opportunities in BTC pair markets.

Altcoins vs BTC Market Cap HeatmapAltcoins vs BTC Market Cap Heatmap
"Ground control to major Tom" 🌙 👨🚀 🚀
This indicator provides a visual heatmap for tracking the relationship between the market cap of altcoins (TOTAL3) and Bitcoin (BTC). The primary goal is to identify potential market cycle tops and bottoms by analyzing how the TOTAL3 market cap (all cryptocurrencies excluding Bitcoin and Ethereum) compares to Bitcoin’s market cap.
Key Features:
• Market Cap Ratio: Plots the ratio of TOTAL3 to BTC market caps to give a clear visual representation of altcoin strength versus Bitcoin.
• Heatmap: Colors the background red when altcoins are overheating (TOTAL3 market cap equals or exceeds BTC) and blue when altcoins are cooling (TOTAL3 market cap is half or less than BTC).
• Threshold Levels: Includes horizontal lines at 1 (Overheated), 0.75 (Median), and 0.5 (Cooling) for easy reference.
• Alerts: Set alert conditions for when the ratio crosses key levels (1.0, 0.75, and 0.5), enabling timely notifications for potential market shifts.
How It Works:
• Overheated (Ratio ≥ 1): Indicates that the altcoin market cap is on par or larger than Bitcoin's, which could signal a top in the cycle.
• Cooling (Ratio < 0.5): Suggests that the altcoin market cap is half or less than Bitcoin's, potentially signaling a market bottom or cooling phase.
• Median (Ratio ≈ 0.75): A midpoint that provides insight into the market's neutral zone.
Use this tool to monitor market extremes and adjust your strategy accordingly when the altcoin market enters overheated or cooling phases.

CVDD - Coin Value Days Destroyed for Bitcoin (BTC) [Logue]Cumulative Value Days Destroyed (CVDD) - The CVDD was created by Willy Woo and is the ratio of the cumulative value of Coin Days Destroyed in USD and the market age (in days). While this indicator is used to detect bottoms normally, an extension is used to allow detection of BTC tops. When the BTC price goes above the CVDD extension, BTC is generally considered to be overvalued. Because the "strength" of the BTC tops has decreased over the cycles, a logarithmic function for the extension was created by fitting past cycles as log extension = slope * time + intercept. This indicator is triggered for a top when the BTC price is above the CVDD extension. For the bottoms, the CVDD is shifted upwards at a default value of 120%. The slope, intercept, and CVDD bottom shift can all be modified in the script.

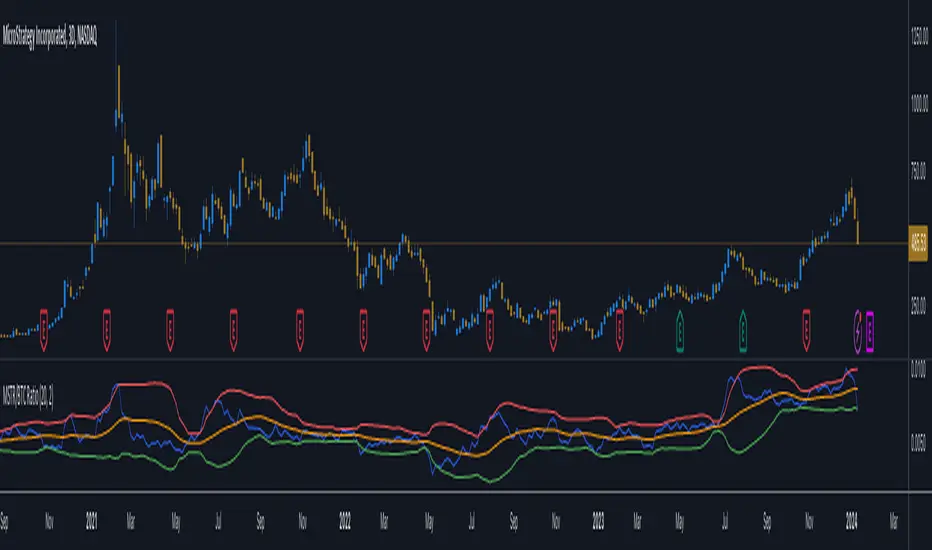
MicroStrategy / Bitcoin Market Cap RatioThis indicator offers a unique analytical perspective by comparing the market capitalization of MicroStrategy (MSTR) with that of Bitcoin (BTC) . Designed for investors and analysts interested in the correlation between MicroStrategy's financial performance and the Bitcoin market, the script calculates and visualizes the ratio of MSTR's market capitalization to Bitcoin's market capitalization.
Key Features:
Start Date: The script considers data starting from July 28, 2020, aligning with MicroStrategy's initial announcement to invest in Bitcoin.
Data Sources: It retrieves real-time data for MSTR's total shares outstanding, MSTR's stock price, and BTC's market capitalization.
Market Cap Calculations: The script calculates MicroStrategy's market cap by multiplying its stock price with the total shares outstanding. It then forms a ratio of MSTR's market cap to BTC's market cap.
Bollinger Bands: To add a layer of analysis, the script includes Bollinger Bands around the ratio, with customizable parameters for length and multiplier. These bands can help identify overbought or oversold conditions in the relationship between MSTR's and BTC's market values.
The indicator plots the MSTR/BTC market cap ratio and the Bollinger Bands, providing a clear visual representation of the relationship between these two market values over time.
This indicator is ideal for users who are tracking the impact of Bitcoin's market movements on MicroStrategy's valuation or vice versa. It provides a novel way to visualize and analyze the interconnectedness of a leading cryptocurrency asset and a major corporate investor in the space.
Cumulative Volume Value (BTC)The Cumulative Volume Value (BTC) indicator is designed to visualize and analyze cumulative volume data specific to Bitcoin. This indicator provides insights into the total volume transacted over a time, aiding in understanding market activity and potential value of Bitcoin.
It considers whether the closing price is greater than the opening price over the defined length, adding or subtracting volume accordingly.
The Cumulative Volume Value (BTC) indicator offers a valuable perspective on Bitcoin's market activity by visualizing cumulative volume and providing insights into potential market tops, bottoms, and the relationship between volume and BTC value movements.
Peaks in the cumulative volume might suggest potential tops in the BTC market, indicating periods of intense trading activity.
Conversely, bottoms in cumulative volume might signal potential market bottoms, representing phases of reduced trading activity or consolidation.
This is how human psychology works. The greatest activity is close to the peak and the worst when the price of BTC has decreased to the level when people lose interest and faith in the cryptocurrency market and the volume of trades falls, then the best time to buy.
Important Considerations:
Historical patterns suggest a relationship between cumulative volume and market tops/bottoms, but this indicator should be used in conjunction with other technical analysis tools for informed trading decisions.
Past performance of cumulative volume in relation to market tops or bottoms does not guarantee future outcomes in financial markets.
.srb suite pin-upThe essential suite Indicator
that are well integrated to ensure visibility of essential items for trading.
it is very cumbersome to put symbol in the Tradingview chart and combine essential individual indicators one by one.
Moreover even with such a combination, the chart is messy and visibility is not good.
This is because each indicator is not designed with the others in mind.
This suite was developed as a composite-solution to that situation, and will make you happy.
--> This is steamlined pin-up version of .srb suite.
--> A minimal set of indicators for comparing different symbols.
--> This is well-balanced alternative next version of previous .b pin-up symbol
BTC-agg. Volume
4 BTC-spot & 4 BTC-PERP volume aggregated.
It might helps you don't miss out on important volume flows.
Weighted to spot trading volume when using PERP+spot volume .
If enabled, BTC-agg.Vol automatically applied when selecting BTC-pair.
--> This is used in calculations involving volumes, such as VWAP .
Moving Average
1 x JMA trend ribbon ; Accurately follow short-term trend changes.
2 x EMA ribbon ; zone , not the line.
MA extension line ; It provide high visibility to recognize the direction of the MA.
SPECIAL TOOLS
BB regular (Dev. 2.0, 2.5)
BB Extented (Dev. 2.5, 3.0, 3.5)
SPECIAL TOOLS - Ultra Volume Marking
x2 x4 greater than regular average volume, it will help you can take the reversal
It does not directly indicate volume, but ultra-volume marking is enough for compare.
---------------------------------------------------------------------------------------------------------------------------------------
if you have any questions freely contact to me by message on tradingview
but please understand that responses may be quite late.
Special thanks to all of contributors of community.
The script may be freely distributed under the MIT license.

Indicator for proxy BTC and ALT dominanceThis indicator calculates a proxy for BTC dominance and ALT domance from total crypto cap by removing USDT and USDC. The indicator has 4 plots:
Proxy BTC Dominance = BTC dominance / (total crypto cap - stablecoin cap)
Proxy ALT Dominance = (Total crypto cap - stablecoins - btc cap) / (total crypto cap - stablecoin cap)
A reference plot of BTC Dominance
A reference plot of Stablecoin dominance

.b pin-up symbolWhen trading cryptocoins, it is necessary to check the price trend of NASDAQ, BTC.D, BTC.OI, BTC spot or other coins of similar groups.
However it is very cumbersome to put a comparison symbol in the Tradingview chart and combine individual indicators one by one.
Moreover even with such a combination, the chart is messy and visibility is not good.
This script was developed as a composite-solution to that situation, and will make you happy.
- NQ1!, USTECH100CFD | symbol fixed
- BTC.Dominance, BTC.OpenInterest, BTC symbol, others pin-up-symbol | selectable
- Pin-up-symbol | selectable
- Pin-up-symbol's candle chart
- Trending
* EMA 9,21,50,200 ribbon classic EMA
* .b price line ; .b price = unique trending price with price-action + relative-volume-action + ATR
* Dynamic S/R Cloud ; BB + donchian band + high/low + atr mixed custom-logic
* VWWMA + .b price Shadow ; Volume-weighted WMA on .b price = unique MA faster than classic VWMA
Trending shadow direction is not bad even on low-timeframe (1, 2, 3, 5m, 15m...)
- Pattern
* Harmonic Pattern ; A simplified version of the harmonic pattern indicator, simply show-up pattern complete position
for reference only - adopted from HeWhoMustNotBeNamed's script.
- Information Panel
* BTC Dominance, BTC Open Interest, Pin-Up-Symbol price
* Trend meter ; 5,15,30,1h,2h,4h Meter Calc with 1 minute-timeframe candles
5 = Green if the current price is higher than the price 5 minutes ago.
1h = Green if the current price is higher than the price 2 hours ago.
4h = Red if the current price is lower than the price 4 hours ago.
* caution ; To use real-time chart of "CME_MINI:NQ1!" you have to additional subscribe CME data,
default setting is 'NQ1!' , you can change to 'USTECH100CFD'
* When you choose symbol which is closed trading hours, the script's update stopped.
Even if the selected pin-up-symbol is on trading hours, the currently selected symbol's chart doesn't update.
* recommended | chart setting > Appearance : Top margin 0%, Bottom margin 0% for optimized screen usage :)
if you have any questions freely contact to me by message on tradingview, or telegram @sr_bt
but please understand that responses may be quite late.
------------------------------------------------------------------------------------------------------------------------------------------------------------
copyright 2022 (sr_b)
Special thanks to all of contributors of community.
The script (originaly .b) may be freely distributed under the MIT license.
The other classic script code also may be freely distributed under the MIT license.
Simplified Harmonic script part | core adopted from 'Multi ZigZag Harmonic Patterns (HeWhoMustNotBeNamed)' MPL2.0 license

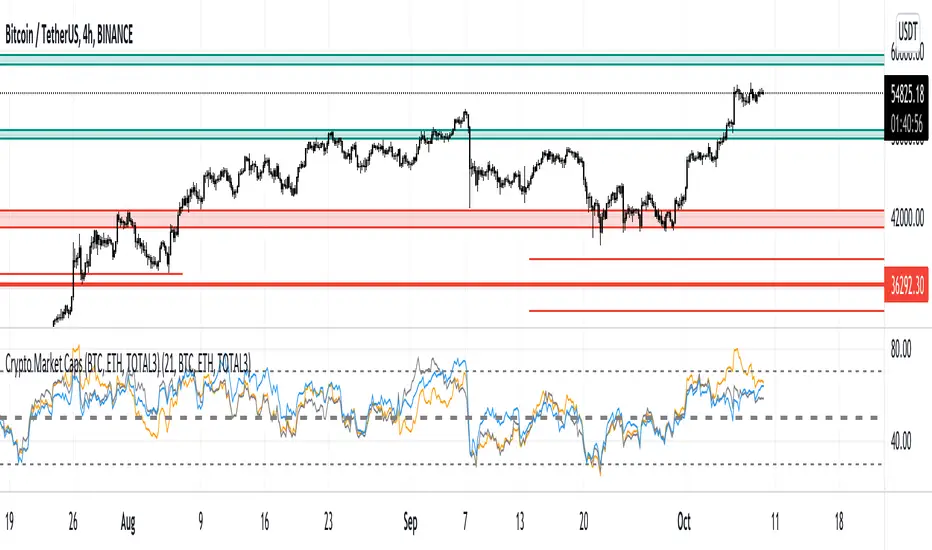
Crypto Market Caps (BTC, ETH, TOTAL3)RSI based Crypto Market Caps (BTC, ETH, TOTAL3) Oscillator
This oscillator displays market caps for:
BTC : CRYPTOCAP:BTC -> in orange
ETH : CRYPTOCAP:ETH -> in gray
ALT (Total crypto excl. BTC & ETH): CRYPTOCAP:TOTAL3 -> in blue
In the settings you can edit:
The 3 market cap symbols
RSI length
All colours ;-)
Hope you enjoy!
kimchi(korea) premium percent - bithumb btc / binance btcThis script was created to confirm the fear of kimchi premium in the cryptocurrency market.
The basic operation formula is as follows.
premium(percent) = (BTC KRW - (BTC USDT x USD KRW) / (BTC USDT x USD KRW)) x 100
By calculating the premium, you can check melt up rally.
Looking at the chart, when kimchi's premium reaches 6-8 percent, BTC faces great volatility (mainly downside).
So, a color warning was made for values outside of -2~2%, which is the general kimchi premium (can be changed in settings).
Also, a zero line has been added for readability.
Also, a color change has been added to the ema to see if the value of each market moves in the opposite direction based on the previous candle's closing price. If the two markets move separately, the ema is colored red.
I think this script is a very simple indicator.
It is usually recommended to get value in a large time frame.
Thank you.
Tango RSI high and low indicator for BTCThis script should be used on the weekly BTC chart.
This script uses RSI data and 100 week Moving Average to signal a possible BTC peak and Bottom.
The green zones signal a bottoming for BTC/USD and the red zones signal a peaking in the value of BTC.
The back testing is promising but what must be kept in mind when using this script is that the data available for BTC is minimal so an increased or decrease in popularity of BTC could through of the signal.
Bear in mind when using this signal: the coloured zones only appear on the weekly close

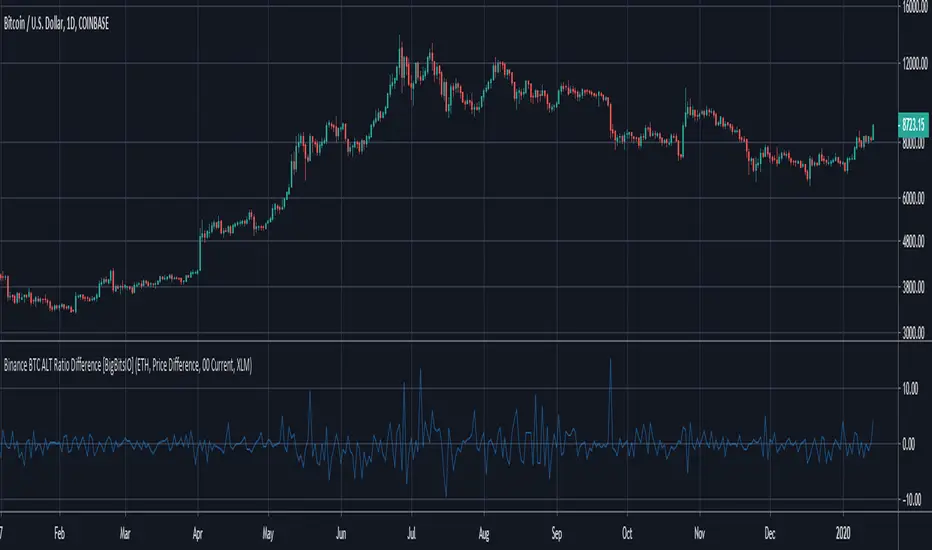
Binance BTC ALT Ratio Difference [BigBitsIO]This was a follower suggested script. This script compares the USDT and BTC relative prices of a particular altcoin traded on Binance by calculating it's USDT price comparative to BTC. This is a very simple calculation (ALT/USDT price divided by ALT/BTC price). From there, we simply subtract the BTC/USDT price from the ALT ration price and we can see if a coin is trading comparatively high or low compared to it's BTC relative price.
This indicator may or may not be useful for you. However, for the purposes of my development series for indicators, I have published it to highlight the ability to concatenate strings to manipulate securities.
Features:
- Dropdown to choose from several built-in altcoin selections.
- Dropdown to choose to show a USDT base difference in the ratio, or a percentage based difference (might be useful for considering fees).
- Dropdown to choose the resolution of the indicator.
- Checkbox to toggle the option to use a custom altcoin.
- Text input to allow entry of a custom altcoin from Binance. Please only use the prefix on its trading pair vs. BTC. I cannot guarantee this will work with all altcoins. They must be traded vs. USDT and BTC on Binance.
- Concatenated strings to manipulate selected securities.
*** DISCLAIMER: For educational and entertainment purposes only. Nothing in this content should be interpreted as financial advice or a recommendation to buy or sell any sort of security or investment including all types of crypto. DYOR, TYOB. ***
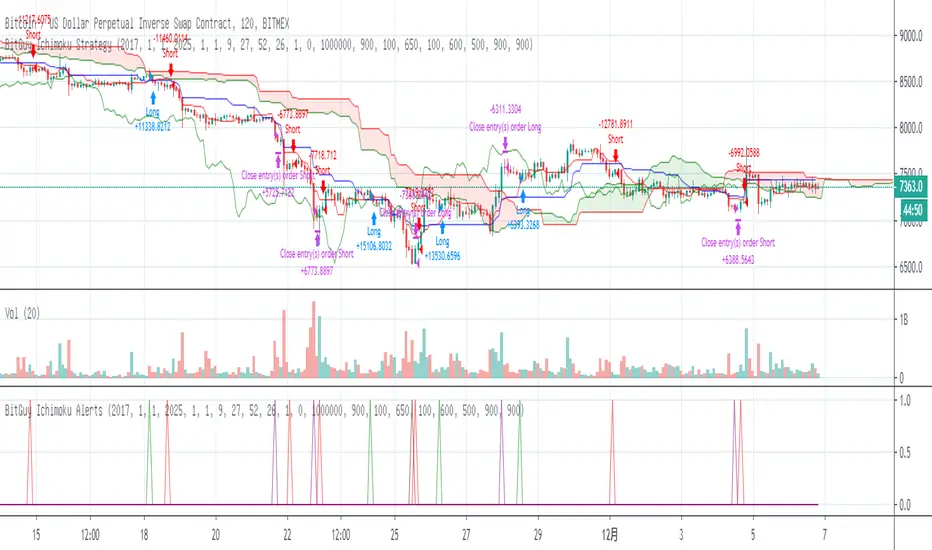
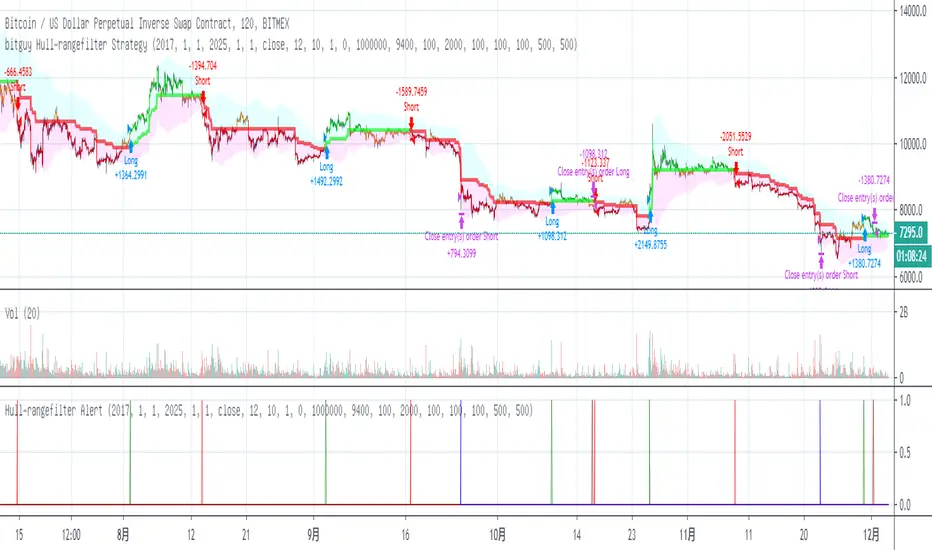
BITMEX Bybit binance HUOBI OKCOIN BTC Ichimoku TREND AlertsBITMEX Bybit binance HUOBI OKCOIN BTC Ichimoku TREND Alerts
This is a very effective trend strategy.
Strategy principle
HOW TO USE
set long position when a green arrow appears in the chart.
set short position when a red arrow appears in the chart.
For the long position and the short direction, you can set the stop profit & stop loss or trailing profit stop & trailing stop loss respectively.
When a purple arrow appears to close a position, an aggressive trader can go in the opposite direction when it is purple.
Strategy applicability
The default setting is for bitmex perpetual swap contract XBTUSD , bybit BTCUSD perpetual futures contract ,binance btcusdt Spot,Bitfinex BTCUSD Spot,bitflyer BTCJPY Spot,bithumb BTCKRW Spot,bitso BTCMXN Spot, bitstamp BTCUSD Spot,bittrex BTCUSDT Spot,Coinbase BTCUSD spot, deribit BTCPERP perpetual futures contract,gemini BTCUSD Spot,Hitbit BTCUSDT Spot,huobi BTCUSDT Spot KRAKEN XBTUSD spot,OKCOIN OKEX BTCUSD3M BTCUSD BTCUSD2W,Poloniex BTCUSDT Spot etc btc symbol with 30 minutes timeframe.
This indicator has broad applicability and can be applied to multiple different symbols.
This indicator also applies to the ETHUSD symbol etc, just adjust the default configuration.
Using the alert of the indicator, it can work well on the trading robot like Gunbot,autoview, without repaint false signals.
这是非常有效的趋势策略。
如何使用
在图表中出现绿色箭头就做多。
在图表中出现红色箭头就做空。
对于多头头寸和空头方向,您可以分别设置止损和止损或尾随利润止损和尾随止损;当出现紫色箭头时平仓,激进的交易者,可以在紫色时就做反方向。
策略适用性
默认设置是针对bitmex交易所 XBTUSD永久掉期合约,BYBIT交易所 BTCUSD永续期货合约,binance币安交易所 btcusdt现货,Bitfinex交易所 BTCUSD现货,bitflyer交易所 BTCJPY现货,bithumb交易所 BTCKRW现货,bitso交易所 BTCMXN现货,bitstamp交易所 BTCUSD现货,bittrex交易所 BTCUSDT现货,Coinbase交易所 BTCUSD现货,deribit交易所 BTCPERP永续期货合约,gemini双子星交易所 BTCUSD现货,Hitbit交易所 BTCUSDT现货,huobi火币交易所 BTCUSDT现货,KRAKEN交易所 XBTUSD现货,OKCOIN OKEX交易所 BTCUSD3M OK BTC季度合约 BTCUSD BTCUSD2W OK BTC次周合约,Poloniex BTCUSDT现货等2小时区间的btc交易。
Bitmex XBTUSD 2H 比特币期货 2 hours Bitcoin Futures
这个指标具有广泛的适用性,可以适用多个不同交易品种。
该指标还适用于ETHUSD,ETHBTC,ADABTC,TRXBTC,XRPBTC交易品种等,只需调整默认配置即可。
Bitmex ETHUSD 2H 以太币合约
binance ADABTC 2H
Binance ETHBTC 90 minutes 分钟
Binance TRXBTC89 minutes 分钟
Binance XRPBTC 90 minutes 分钟
使用该指标的警报设置,它可以在自动交易机器人上很好地工作,而无重绘错误的信号。
BITMEX Bybit binance BTC ETH HR TREND AlertBITMEX Bybit binance BTC ETH HR TREND Alert
This is a very effective trend strategy.
Strategy principle
HOW TO USE
set long position when a green arrow appears in the chart.
set short position when a red arrow appears in the chart.
For the long position and the short direction, you can set the stop profit & stop loss or trailing profit stop & trailing stop loss respectively.
When a purple arrow appears to close a position, an aggressive trader can go in the opposite direction when it is purple.
Strategy applicability
The default setting is for bitmex perpetual swap contract XBTUSD , bybit BTCUSD perpetual futures contract ,binance btcusdt Spot,Bitfinex BTCUSD Spot,bitflyer BTCJPY Spot,bithumb BTCKRW Spot,bitso BTCMXN Spot, bitstamp BTCUSD Spot,bittrex BTCUSDT Spot,Coinbase BTCUSD spot, deribit BTCPERP perpetual futures contract,gemini BTCUSD Spot,Hitbit BTCUSDT Spot,huobi BTCUSDT Spot KRAKEN XBTUSD spot,OKCOIN OKEX BTCUSD3M BTCUSD BTCUSD2W,Poloniex BTCUSDT Spot etc btc symbol with 30 minutes timeframe.
This indicator has broad applicability and can be applied to multiple different symbols.
This indicator also applies to the ETHUSD symbol etc, just adjust the default configuration.
Using the alert of the indicator, it can work well on the trading robot like Gunbot,autoview, without repaint false signals.
这是非常有效的趋势策略。
如何使用
在图表中出现绿色线就做多。
在图表中出现红色线就做空。
对于多头头寸和空头方向,您可以分别设置止损和止损或尾随利润止损和尾随止损;当出现紫色箭头时平仓,激进的交易者,可以在紫色时就做反方向。
策略适用性
默认设置是针对bitmex交易所 XBTUSD永久掉期合约,BYBIT交易所 BTCUSD永续期货合约,binance币安交易所 btcusdt现货,Bitfinex交易所 BTCUSD现货,bitflyer交易所 BTCJPY现货,bithumb交易所 BTCKRW现货,bitso交易所 BTCMXN现货,bitstamp交易所 BTCUSD现货,bittrex交易所 BTCUSDT现货,Coinbase交易所 BTCUSD现货,deribit交易所 BTCPERP永续期货合约,gemini双子星交易所 BTCUSD现货,Hitbit交易所 BTCUSDT现货,huobi火币交易所 BTCUSDT现货,KRAKEN交易所 XBTUSD现货,OKCOIN OKEX交易所 BTCUSD3M OK BTC季度合约 BTCUSD BTCUSD2W OK BTC次周合约,Poloniex BTCUSDT现货等2小时区间的btc交易。
Bitmex XBTUSD 89分钟 比特币期货 89 minutes Bitcoin Futures
Bitmex XBTUSD 2H 比特币现货 2 hours Bitcoin Futures
Bitmex XBTUSD 1小时 比特币期货 1 hour Bitcoin Futures
Bybit BTCUSD 1小时 比特币合约 1 hour Bitcoin Futures
binance BTCUSDT 1H 比特币现货 1 hours Bitcoin Spot
这个指标具有广泛的适用性,可以适用多个不同交易品种。
该指标还适用于ETHUSD交易品种等,只需调整默认配置即可。
Bitmex ETHUSD 1小时 以太币合约 1H ETHUSD Futures
Binance ETHUSD 1小时 以太币现货 1H ETHUSD Spot
Bybit ETHUSD 1小时 以太币合约 1H ETHUSD Futures
使用该指标的警报设置,它可以在自动交易机器人上很好地工作,而无重绘错误的信号。
BITMEX Bybit binance Bitfinex OKCOIN BTC ETH TREND AlertBITMEX Bybit binance Bitfinex Coinbase OKCOIN BTC ETH TREND Alert
This is a very effective trend strategy.
Strategy principle
HOW TO USE
set long position when a green arrow appears in the chart.
set short position when a red arrow appears in the chart.
For the long position and the short direction, you can set the stop profit & stop loss or trailing profit stop & trailing stop loss respectively.
When a purple arrow appears to close a position, an aggressive trader can go in the opposite direction when it is purple.
Strategy applicability
The default setting is for bitmex perpetual swap contract XBTUSD , bybit BTCUSD perpetual futures contract ,binance btcusdt Spot,Bitfinex BTCUSD Spot,bitflyer BTCJPY Spot,bithumb BTCKRW Spot,bitso BTCMXN Spot, bitstamp BTCUSD Spot,bittrex BTCUSDT Spot,Coinbase BTCUSD spot, deribit BTCPERP perpetual futures contract,gemini BTCUSD Spot,Hitbit BTCUSDT Spot,huobi BTCUSDT Spot KRAKEN XBTUSD spot,OKCOIN OKEX BTCUSD3M BTCUSD BTCUSD2W,Poloniex BTCUSDT Spot etc btc symbol with 30 minutes timeframe.
This indicator has broad applicability and can be applied to multiple different symbols.
This indicator also applies to the ETHUSD symbol etc, just adjust the default configuration.
Using the alert of the indicator, it can work well on the trading robot like Gunbot,autoview, without repaint false signals.
这是非常有效的趋势策略。
如何使用
在图表中出现绿色箭头就做多。
在图表中出现红色箭头就做空。
对于多头头寸和空头方向,您可以分别设置止损和止损或尾随利润止损和尾随止损;当出现紫色箭头时平仓,激进的交易者,可以在紫色时就做反方向。
策略适用性
默认设置是针对bitmex交易所 XBTUSD永久掉期合约,BYBIT交易所 BTCUSD永续期货合约,binance币安交易所 btcusdt现货,Bitfinex交易所 BTCUSD现货,bitflyer交易所 BTCJPY现货,bithumb交易所 BTCKRW现货,bitso交易所 BTCMXN现货,bitstamp交易所 BTCUSD现货,bittrex交易所 BTCUSDT现货,Coinbase交易所 BTCUSD现货,deribit交易所 BTCPERP永续期货合约,gemini双子星交易所 BTCUSD现货,Hitbit交易所 BTCUSDT现货,huobi火币交易所 BTCUSDT现货,KRAKEN交易所 XBTUSD现货,OKCOIN OKEX交易所 BTCUSD3M OK BTC季度合约 BTCUSD BTCUSD2W OK BTC次周合约,Poloniex BTCUSDT现货等2小时区间的btc交易。
Bitmex XBTUSD 30分钟 比特币期货 30 minutes Bitcoin Futures
Bitfinex BTCUSD 30分钟 比特币现货 30 minutes Bitcoin Spot
Bybit BTCUSD 30分钟 比特币合约 30 minutes Bitcoin Futures
OKEX BTCUSD2M 30分钟 比特币次周合约 30 minutes Half a month Bitcoin Futures
Bitmex XBTUSD 2H 比特币现货 2 hours Bitcoin Futures
binance BTCUSDT 2H 比特币现货 2 hours Bitcoin Spot
Bybit BTCUSD 2H 比特币期货 2 hours Bitcoin Futures
这个指标具有广泛的适用性,可以适用多个不同交易品种。
该指标还适用于ETHUSD交易品种等,只需调整默认配置即可。
Bitmex ETHUSD 30 以太币合约
Bybit ETHUSD 30分钟合约
OKCOIN ETHUSD3W 30分钟季度合约
Bitmex ETHUSD 2H 以太币合约
Bybit ETHUSD 2H 以太币合约
HUOBI ETHUSD 2H 火币以太币现货
使用该指标的警报设置,它可以在自动交易机器人上很好地工作,而无重绘错误的信号。
