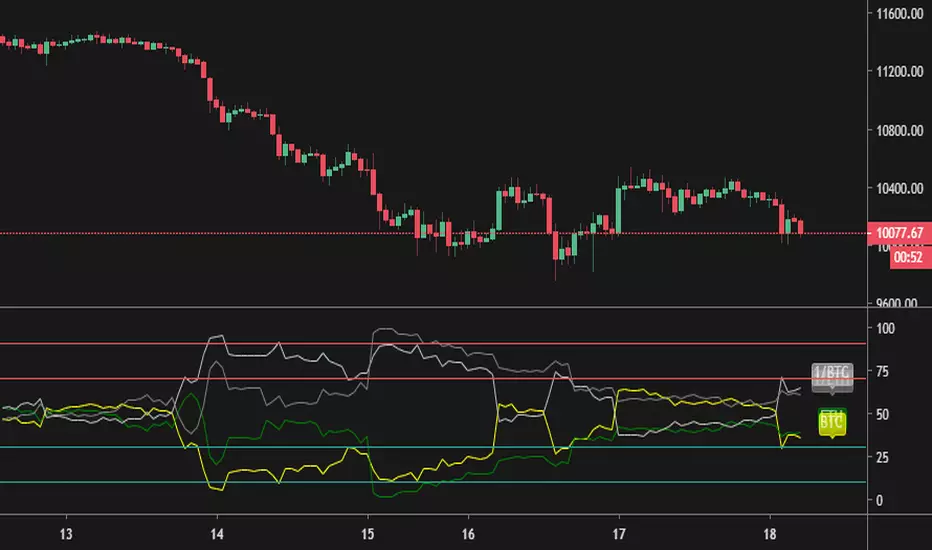
Compare - Oscillator vs BTC momentumI've made a simple indicator to compare the momentum of a trading pair against the momentum of BTC to the dollar. I use it to see how a pair is affected by BTC's momentum... I wouldnt use it to trade off alone, but it can be a useful tool alongside other indicators.
The time range can be adjusted, but I wouldnt reccomend setting it to anything over 12M, or under 1W.... as I'm not sure if it would work.
Any feedback is welcome!
This is an idea I had after looking at a wonderful visualisation made by BarclayJames, link below:
www.tradingview.com
ابحث في النصوص البرمجية عن "BTC"
% Δ, BTC Futures vs. BTC Spot By @Cipher_ScienceAlternative Version to my previous script:
I had fellow traders ask for a delta% version instead of using the delta$!
BTC Energy + HR + Longs + M2
BTC Energy Ratio + Hashrate + Longs + M2
The #1 Bitcoin Macro Weapon on TradingView 🚀🔥
If you’re tired of getting chopped by fakeouts, ETF noise, and Twitter hopium — this is the one chart that finally puts you on the right side of every major move.
What you’re looking at:
Orange line → Bitcoin priced in real-world mining energy (Oil × Gas + Uranium × Coal) × 1000
→ The true fundamental floor of BTC
Blue line → Scaled hashrate trend (miner strength & capex lag)
Green line → Bitfinex longs EMA (leveraged bull sentiment)
Purple line → Global M2 money supply (US+EU+CN+JP) with 10-week lead (the liquidity wave BTC rides)
Why this indicator prints money:
Most tools react to price.
This one predicts where price is going based on energy, miners, leverage, and liquidity — the only four things that actually drive Bitcoin long-term.
It has nailed:
2022 bottom at ~924 📉
2024 breakout above 12,336 🚀
2025 top at 17,280 🏔️
And right now it’s flashing generational accumulation at ~11,500 (Nov 2025)
13 permanent levels with right-side labels — no guessing what anything means:
20,000 → 2021 Bull ATH
17,280 → 2025 ATH
15,000 → 2024 High Resist
14,000 → Overvalued Zone
13,000 → 2024 Breakout
12,336 → Bull/Bear Line (the most important level)
12,000 → 2024 Volume POC
10,930 → Key Support 2024
9,800 → Strong Buy Fib
8,000 → Deep Support 2023
6,000 → 2021 Mid-Cycle
4,500 → 2023 Accum Low
924 → 2022 Bear Low
Live dashboard tells you exactly what to do — no thinking required:
Current ratio (updates live)
Hashrate + 24H %
Longs trend
Risk Mode → Orange vs Hashrate (RISK ON / RISK OFF)
180-day correlation
RSI
13-tier Zone + SIGNAL (STRONG BUY / ACCUMULATE / HOLD / DISTRIBUTE / EXTREME SELL)
Dead-simple rules that actually work:
Weekly timeframe = cleanest view
Blue peaking + orange holding support → miner pain = next leg up
Green spiking + orange failing → overcrowded longs = trim
Purple rising → liquidity coming in = ride the wave
Risk Mode = RISK OFF → price is cheap vs miners → buy
Set these 3 alerts and walk away:
Ratio > 12,336 → Bull confirmed → add
Ratio > 14,000 → Start scaling out
Ratio < 9,800 → Generational buy → back up the truck
No repainting • Fully open-source • Forced daily data • Works on any TF
Energy is the only real backing Bitcoin has.
Hashrate lag is the best leading indicator.
Longs show greed.
M2 is the tide.
This chart combines all four — and right now it’s screaming ACCUMULATE.
Load it. Trust it.
Stop trading hope. Start trading reality.
DYOR • NFA • For entertainment purposes only 😎
#bitcoin #macro #energy #hashrate #m2 #cycle #riskon #riskoff

BTC OHLC by tncylyvBTC OHLC Projection Levels
📜 Indicator Description
This indicator projects key potential price levels for Bitcoin (BTC) based on historical price behavior. Using the opening price of a user-selected timeframe (4H, 1D, or 1W) as a baseline, it calculates and displays statistically-derived levels for potential "Manipulation" and "Distribution" phases of price action.
These projections are designed to provide traders with potential zones of interest for support, resistance, stop-loss placement, and take-profit targets for the current trading period.
________________________________________
🧠 Core Concepts Explained
The indicator is built on two key concepts derived from candlestick analysis:
• Manipulation: This represents the initial price movement that occurs against the candle's eventual primary direction.
o For a bullish candle, it's the extent of the lower wick (the move from Open down to Low).
o For a bearish candle, it's the extent of the upper wick (the move from Open up to High).
o The "M" levels on the chart project the average (mean and median) historical size of this manipulation wick, suggesting potential areas for liquidity grabs or stop hunts.
• Distribution: This represents the primary price movement in the direction of the candle's trend.
o For a bullish candle, it's the total move from Open to High.
o For a bearish candle, it's the total move from Open to Low.
o The "D" levels project the average (mean and median) historical range of this price expansion, suggesting potential targets for the period.
________________________________________
📊 Data & Methodology
It is important to note that the statistical ratios used for the projections are not calculated in real-time by the indicator itself.
These values have been pre-calculated through an extensive historical analysis performed in Python. The analysis used the complete historical BTC/USD price data from the Coinbase exchange to determine the mean and median ratios for both manipulation and distribution across the different timeframes. The resulting fixed values are then hard-coded into the script to ensure performance and consistency.
________________________________________
⚙️ How to Use It
At the beginning of each new period (e.g., at the start of a new day on the 1D timeframe), the indicator will draw a new set of horizontal lines and zones based on that period's opening price.
• The central dotted line represents the Opening Price for the selected timeframe.
• Manipulation Levels (+M / -M): These inner levels can be interpreted as potential reversal zones. Price may test these areas to trigger stops before moving in the primary direction for the session.
• Distribution Levels (+D / -D): These outer levels can be used as potential take-profit targets, representing the average historical price extension for a period.
• Mean vs. Median Zones: The script plots levels based on both the historical mean (average) and median (middle value). The shaded area between them creates a zone rather than a single price line, offering a more practical range for analysis.
________________________________________
🛠️ Settings and Features
• Projection Timeframe: Select the primary timeframe for the analysis (4H, 1D, or 1W). The historical data used for projections is specific to the chosen timeframe.
• Historical Periods to Show: Adjust how many past periods of data you want to see on your chart. A value of 1 will only show the projections for the current, active period.
• Timezone (UTC-4): The 4H calculations are based on a fixed UTC-4 timezone to align with specific, high-volume market sessions (e.g., New York open). This is not changeable to ensure data consistency.
• Visual Customization: You have full control over the appearance of the indicator.
o Toggle the visibility, colors, and line styles for the Open price line and each of the Manipulation/Distribution levels using their respective checkboxes and inputs.
o Enable or disable the shaded fills between the mean and median levels.
o Tip: To quickly hide all price labels at once, edit the "Label Color" setting and set its opacity to 100% (fully transparent).

BTC/USD 3-Min Binary Prediction [v7.2 EN]BTC/USD 3-Minute Binary Prediction Indicator v7.2 - Complete Guide
Overview
This is an advanced technical analysis indicator designed for Bitcoin/USD binary options trading with 3-minute expiration times. The system aims for an 83% win rate by combining multiple analysis layers and pattern recognition.
How It Works
Core Prediction Logic
- Timeframe: Predicts whether BTC price will be ±$25 higher (HIGH) or lower (LOW) after 3 minutes
- Entry Signals: Generates HIGH/LOW signals when confidence exceeds threshold (default 75%)
- Verification: Automatically tracks and displays win/loss statistics in real-time
5-Layer Filter System
The indicator uses a sophisticated scoring system (0-100 points):
1. Trend Filter (25 points) - Analyzes EMA alignments and price momentum
2. Leading Indicators (25 points) - RSI and MACD divergence analysis
3. Volume Confirmation (20 points) - Detects unusual volume patterns
4. Support/Resistance (15 points) - Identifies key price levels
5. Momentum Alignment (15 points) - Measures acceleration and deceleration
Pattern Recognition
Automatically detects and visualizes:
- Double Tops/Bottoms - Reversal patterns
- Triangles - Ascending, descending, symmetrical
- Channels - Trending price channels
- Candlestick Patterns - Engulfing, hammer, hanging man
Multi-Timeframe Analysis
- Uses 1-minute and 5-minute data for confirmation
- Aligns multiple timeframes for higher probability trades
- Monitors trend consistency across timeframes
Key Features
Display Panels
1. Statistics Panel (Top Right)
- Overall win rate percentage
- Hourly performance (wins/losses)
- Daily performance
- Current system status
2. Analysis Panel (Left Side)
- Market trend analysis
- RSI status (overbought/oversold)
- Volume conditions
- Filter scores for each component
- Final HIGH/LOW/WAIT decision
Visual Signals
- Green Triangle (↑) = HIGH prediction
- Red Triangle (↓) = LOW prediction
- Yellow Background = Entry opportunity
- Blue Background = Waiting for result
Configuration Options
Basic Settings
- Range Width: Target price movement (default $50 = ±$25)
- Min Confidence: Minimum confidence to enter (default 75%)
- Max Daily Trades: Risk management limit (default 5)
Filters (Can be toggled on/off)
- Trend Filter
- Volume Confirmation
- Support/Resistance Filter
- Momentum Alignment
Display Options
- Show/hide signals, statistics, analysis
- Minimal Mode for cleaner charts
- EMA line visibility
Important Risk Warnings
Binary Options Trading Risks:
1. High Risk Product - Binary options are extremely risky and banned in many countries
2. Not Investment Advice - This tool is for educational/analytical purposes only
3. No Guaranteed Returns - Past performance doesn't predict future results
4. Capital at Risk - You can lose your entire investment in seconds
Technical Limitations:
- Requires stable internet connection
- Performance varies with market conditions
- High volatility can reduce accuracy
- Not suitable for news events or low liquidity periods
Best Practices
1. Paper Trade First - Test thoroughly on demo accounts
2. Risk Management - Never risk more than 1-2% per trade
3. Market Conditions - Works best in normal volatility conditions
4. Avoid Major Events - Don't trade during major news releases
5. Monitor Performance - Track your actual results vs displayed statistics
Setup Instructions
1. Add to TradingView chart (BTC/USD preferred)
2. Use 30-second or 1-minute chart timeframe
3. Adjust settings based on your risk tolerance
4. Monitor F-Score (should be >65 for entries)
5. Wait for clear HIGH/LOW signals with high confidence
Alert Configuration
The indicator provides three alert types:
- HIGH Signal alerts
- LOW Signal alerts
- General entry opportunity alerts
Legal Disclaimer
Binary options trading may not be legal in your jurisdiction. Many countries including the USA, Canada, and EU nations have restrictions or outright bans on binary options. Always check local regulations and consult with financial advisors before trading.
Remember: This is a technical analysis tool, not a money-printing machine. Successful trading requires discipline, risk management, and continuous learning. The displayed statistics are historical and don't guarantee future performance.

BTC CME Gap – detector & single signals# BTC CME Gap — Detector & Single Signals (Pine v5)
**What it does**
This indicator finds the **weekend gap** on **CME Bitcoin futures** and turns it into a clean, tradable object:
* Draws a **gap zone** (Friday close ↔ Monday open) as a right-extending box.
* Fires **one-time signals** per gap:
* **ENTER** – first touch of the gap zone by price.
* **FILL** – gap is considered filled when price tags **Friday’s close**.
It works on any BTC chart (spot or futures). The gap itself is calculated from **CME\:BTC1!** daily data.
---
## How it works
1. Pulls **daily** `open`/`close` from `CME:BTC1!` (`request.security`, no lookahead).
2. On **Monday**, compares Monday **open** with previous **Friday close**:
* If different → a **gap** exists.
3. Defines the zone:
* `gapTop = max(MonOpen, FriClose)`
* `gapBot = min(MonOpen, FriClose)`
4. Renders a box + boundary lines, **extending right** until price action resolves it.
5. Signals:
* **ENTER**: the first bar that **enters** the gap zone.
* **FILL**: first bar that **touches Friday close** (gap completion).
6. Each new Monday gap **replaces** the previous box and signals.
---
## Inputs
* **CME symbol** (default `CME:BTC1!`)
* **Gap timeframe** (default `D`)
* **Colors** for the box and edges
---
## Plot & Signals
* **Box** = visual gap zone (transparent fill, outlined).
* **ENTER** = triangle up below bar.
* **FILL** = triangle down above bar.
* Optional label prints **Top / Bottom / Fill** levels.
---
## Notes on behavior
* Uses `barmerge.lookahead_off` and daily aggregation, so the gap definition **does not repaint** once Monday’s daily bar is confirmed.
* Signals are **single-shot** per gap (no clutter).
* Works on any chart timeframe; the gap logic always references **CME daily**.
---
## Practical use
* Track obvious **“magnets”** for mean-reversion, stop-runs, or liquidity grabs.
* Combine with your higher-timeframe bias (e.g., **1D trend filter**) and execution on **4H/1H**.
* Typical outcomes: quick Monday fill, staged fill after partial rejection, or delayed fill during later consolidation.
---
## Customization ideas
* Add `alertcondition(enterSignal, …)` / `alertcondition(fillSignal, …)` for automation.
* Gate trades with trend filters (EMA/SMA, Kernel regression, ADX) or session tools (VWAP/POC).
* Persist multiple historical gap boxes if you want to track **unfilled** gaps.
---
**Credits**: Built for BTC CME weekend gaps; minimal, publication-ready visualization with single-event signals to keep charts clean.

BTC vs MSTR PerformanceBTC vs MSTR Performance - BULL
• Green: MSTR has outperformed BTC over the selected time period.
• Red: BTC has outperformed MSTR during the same time period.
• Horizontal line at 0: Separates positive from negative outperformance.

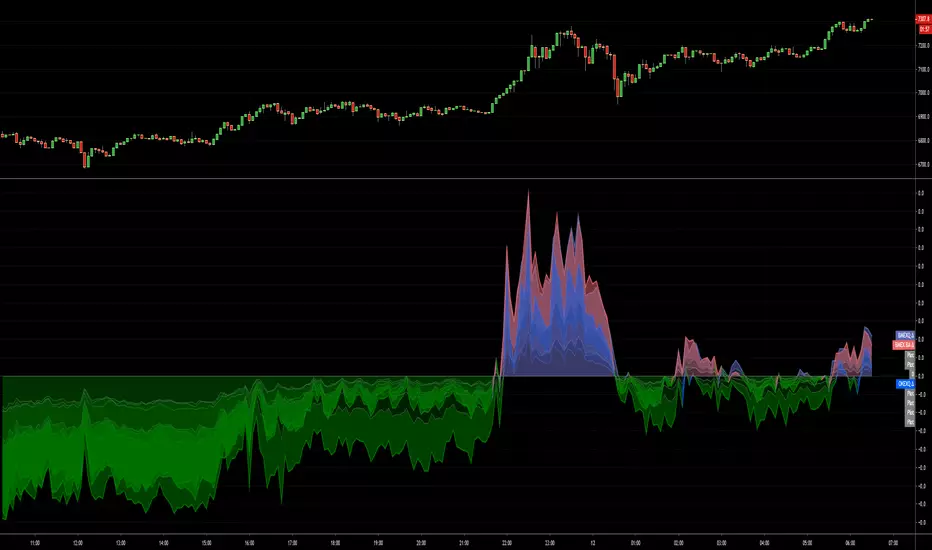
BTC Perp-Spot PremiumBTC Perp‑Spot Premium w/ EMA Cross
This indicator measures the premium or discount between BTC spot prices and perpetual futures across major exchanges. It visualizes real-time sentiment in the derivatives market and identifies potential inflection points by comparing the behavior of spot traders (real demand) and perp traders (speculative positioning).
What It Does
Calculates the premium spread
Shows the percentage difference between perp and spot prices as a color-coded histogram. Blue bars indicate perps trading above spot (aggressive longs), while red bars suggest perps below spot (risk-off or bearish positioning).
7-exchange composite data feed
Uses a robust average of six perpetual futures sources and seven spot market sources across Binance, Bybit, OKX, Coinbase, Bitfinex, Kraken, and Bitstamp for a balanced and high-fidelity view.
EMA crossover signals
Includes a customizable EMA and MA of the premium. Crossovers are visualized with subtle circle markers to signal sentiment shifts—blue for EMA crossing above, red for crossing below.
Zero baseline
A horizontal line at zero makes it easy to identify when perps flip from premium to discount territory and vice versa.
Dynamic stats table
Displays live values for the perp average, spot average, and premium % in a neatly formatted corner table.
Why It's Useful
This tool helps traders:
Monitor market sentiment and speculative aggression
Spot inefficiencies between derivatives and spot markets
Identify early reversal or continuation signals
Track potential liquidation zones or trend exhaustion
Confirm breakouts with perp/spot alignment
Whether you're trading short-term momentum or watching for mean-reverting setups, this premium analysis tool brings deeper context to BTC price action directly on your chart.

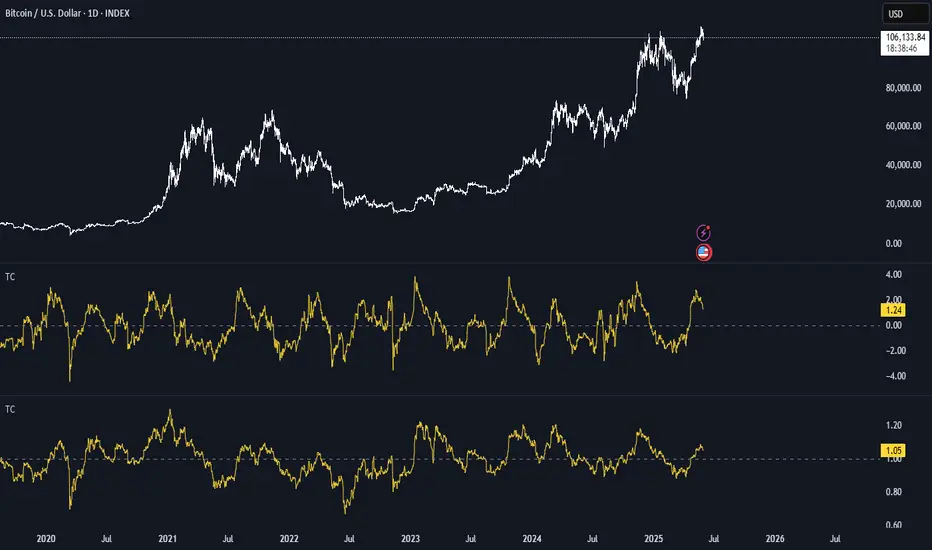
BTC Thermocap Z-ScoreBTC Thermocap Indicator Overview
The BTC Thermocap is a specialized on-chain ratio indicator designed to provide deeper insight into Bitcoin's market valuation relative to its cumulative issuance. By comparing the current market price of Bitcoin to the total value of all BTC ever mined (also known as "thermocap"), this indicator helps identify potential overvaluation or undervaluation periods within the Bitcoin market cycle.
Key Features and Customizable Inputs:
Moving Average Length (MA Length)
Moving Average Type (MA Type) - SMA or EMA
Z-Score Calculation Length
Z-Score Toggle (Use Z-Score)
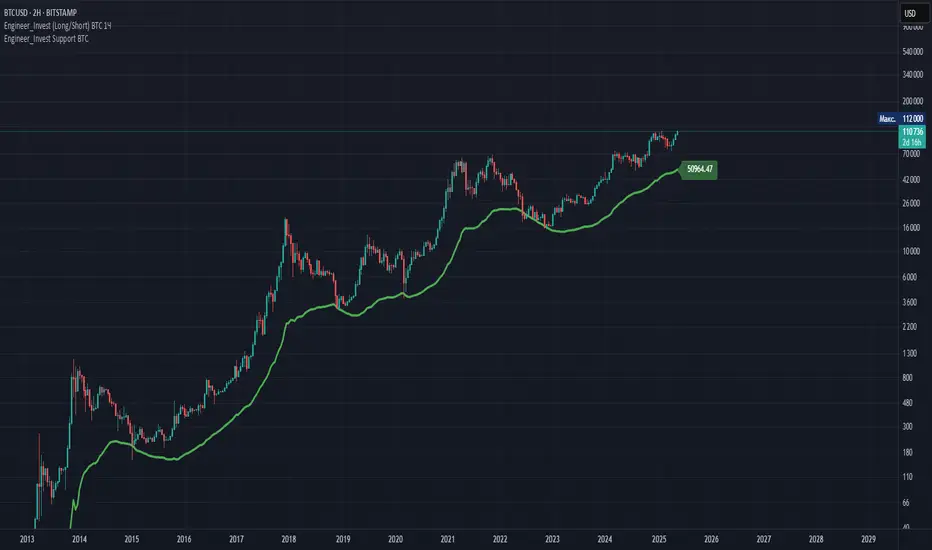
Engineer_Invest Support BTCDescription of the "Engineer_Invest Support BTC" indicator
The indicator is designed to highlight a dynamic support level using a combination of a smoothed trend and an assessment of market volatility. Its key features are:
1. Calculating the baseline using the EMA:
The script calculates an exponential moving average (EMA) of the opening price with a configurable period (200 by default). This allows you to create a reliable basis for interpreting price movements, minimizing the impact of short-term fluctuations.
2. Volatility assessment via ATR:
To analyze market variability, the method of calculating the average true range (ATR) multiplied by a given coefficient (default is 5) is used. This approach helps accurately reflect the current market volatility by adjusting the support level depending on the intensity of price fluctuations.
3. Fixed estimated timeframe:
The main calculation is performed on a fixed 3-day interval, which guarantees the stability of the plotted lines regardless of the selected base time interval of the graph. This avoids the undesirable effects of short-term "noise" and ensures the consistency of analytics, especially in highly volatile markets such as cryptocurrencies.
4. Dynamic line formation:
Based on the calculated values of EMA and ATR, the lower boundary of the channel is determined, which is drawn with a bold green line – it serves as a dynamic support zone. At the same time, the ATR value from the previous bar is used to increase the stability of the calculation, which helps smooth out extreme market surges.
5. Flexibility and customization:
Indicator parameters such as the ATR period, the ATR Multiplier coefficient, and a fixed estimated timeframe are available for change. This allows traders to adapt the script to individual strategies and features of the analyzed asset.
Practical application:
- Determining support levels: The indicator helps to identify potential areas where the asset price may find support in a decline.
- Adaptability to market conditions: Using ATR makes it possible to take into account volatility, which is especially important for active markets, for example, for BTC.
- Stability of signals on any timeframe: Due to the fixed 3-day calculation interval, the support line remains unchanged even when the base graphical interval is changed.
The "Engineer_Invest Support BTC" indicator is a well-thought-out analytical solution for technical analysis, combining elements of trend smoothing and a volatility filter. It can be used as an independent tool to find key support levels, or combined with other analysis methods to form a more complete picture of market dynamics.
Important!
This indicator is designed and optimized exclusively for working with BTC. His calculations take into account the unique features of bitcoin's market dynamics and volatility, which provides the most reliable determination of support levels for this particular asset. The use of this instrument in other markets may not provide the expected signal accuracy.
BTC DCA RangeBTC DCA Range indicator is designed to help traders identify potential Dollar-Cost Averaging (DCA) opportunities for Bitcoin (BTC) based on deviations from a reference moving average (MA). It highlights price zones where BTC is trading significantly below a long-term moving average, suggesting potential undervaluation or buying opportunities.
The indicator dynamically adjusts the moving average length based on the selected chart timeframe, ensuring consistency across different timeframes (e.g., daily, weekly, or monthly). It also allows users to set a custom deviation threshold to identify when the price is trading at a significant discount relative to the moving average.
Adjust the Reference MA Length and Deviation Threshold inputs to suit your trading strategy

Scalping The Bull - BTC Chart for Trend AnalysisName: BTC Chart for Trend Analysis
Category: Scalping, Trend Analysis .
Timeframe: 1M, 5M, 30M, 1D depending on the specific technique.
Technical Analysis: The indicator supports the operations of the trader named "Scalping The Bull" who uses BTC as an Index for Crypto trading.
Suggested usage: When trading on altcoins, to check whether or not they are trending with Bitcoin and whether those anticipate its movements.
It is therefore possible to see Bitcoin specifically if it makes red or green candles and how it is positioned with respect to the EMA 5, 10, 60, 223, however configurable from the panel.
Used in conjunction with Scalping The Bull Indicator or PRO Indicator, on the main panel.
Configuration:
EMA Length:
- EMA 1: by default 5, configurable
- EMA 2: by default 10, configurable
- EMA 3: by default 60, configurable
- EMA 4: by default 223, configurable
Colors can be modified from "Settings" > "Style"
Designed to be used with the following the indicator:

.b BTC-Exchange volumeBINANCE:BTCUSDT
It's tool to check exchange trading status.
You can see "BTC-exchange's realtime trading volume, previous closed volume" at once.
You can switch to see 'Previous close volume' on script's panel.
Timeframe recommended ; 15m, 1H, 4H, D, W, whatever.
Each exchange may have a different volume display unit, so I converted it into roughly BTC units. (using hl2 price)
This indicator aims to recognize the difference in the trading volume of the exchange at once.
It's not for the purpose of check the exact trading volume.
All data come from tradingview.
The comparison target exchanges refer to the ranking of CoinMarketCap.
if you have any questions freely contact to me by message on tradingview, or telegram @sr_bt
but please understand that responses may be quite late.

ROC vs BTCThis is a modification of my Rate of Change Percentile script, used to compare the current ticker (e.g. Altcoins) to BTC.
Essentially we are looking at (Current Ticker ROC percentile) vs (Bitcoin ROC percentile).
In other words, we are using the ROC value of both the current ticker and BTC, and ranking each based on their previous ROC.
We compare the rankings to gauge the relative overperformance or underperformance of the current ticker vs BTC.
The blue line is BTC, the columns are the current ticker.
Green columns above the blue line indicate positive ROC and current ticker has higher ROC ranking than BTC.
Red columns below the blue line indicate negative ROC and current ticker has a higher ROC ranking than BTC.
*** PLEASE LEAVE A LIKE AND FOLLOW IF YOU ENJOY THE SCRIPT ***
Any questions, comments or feedback I'd love to hear from you below!

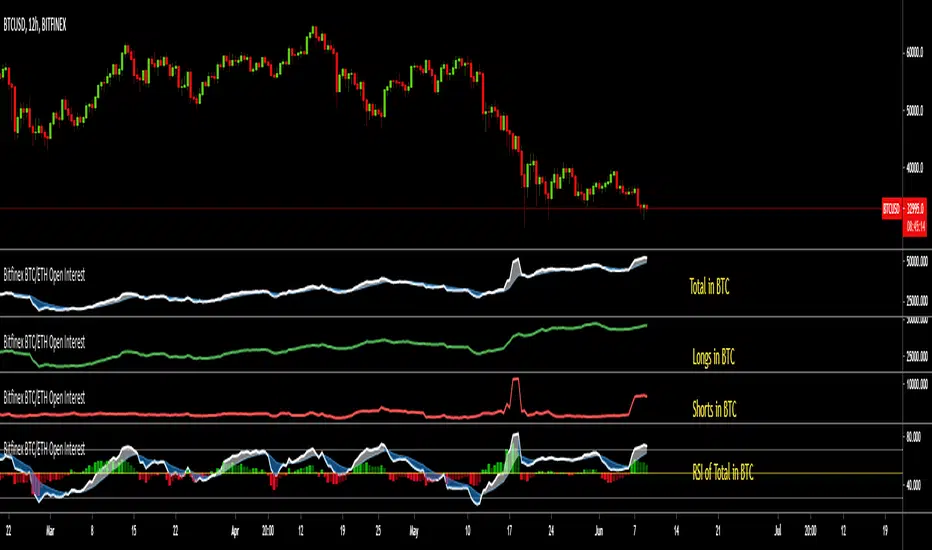
Bitfinex BTC/ETH Open InterestThe Bitfinex Exchange is providing the Open Long and Short positions as data feeds in Tradingview. This information can be valuable in order to judge how the big players are positioned.
This indicator allows to analyze this Bitfinex Open Interest data for BTC and ETH. By default it shows the Total Open Interest (Longs + Shorts) in BTC. A 10 period EMA is applied to the data.
The following alternative displays are available:
- Show ETH instead of BTC
- Show Long positions separately
- Show Short Positions separately
- Show the results in USD (Number of coins multiplied by period closing price)
- Show RSI instead of absolute value (see below)
Instead of displaying the absolute value, it is possible to show the RSI (current default length is 20) to make the changes easier visible. If RSI display is selected, then the Overbought, Oversold and Middle Line are shown automatically. Additionally a histogram is displayed which shows the difference between the RSI and the EMA of the RSI.
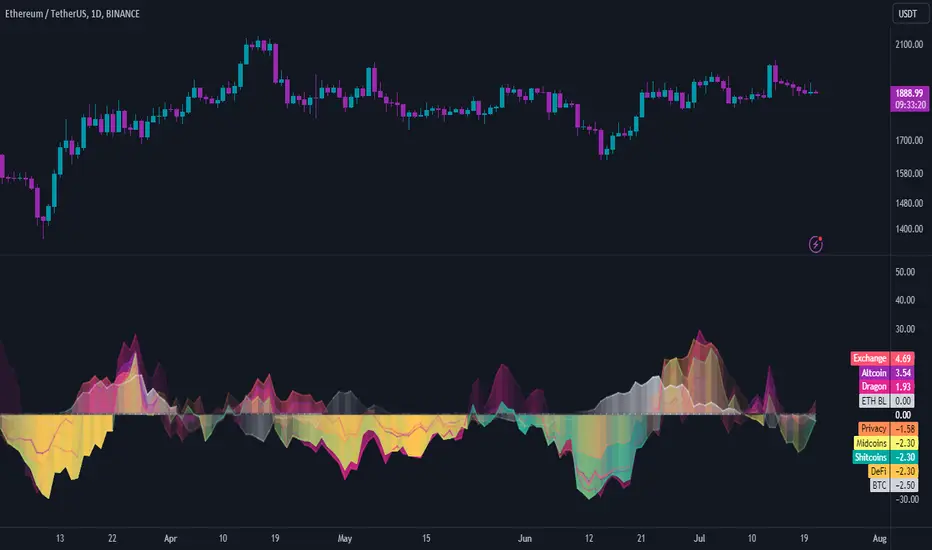
INDICES against BTC & ETHThe idea is the following; you can easily chart the FTX perp indices against (currently) two baselines, ETH & BTC.
I always choose ETH since it is way harder to outperform ETH at the moment. Doing this helps me see certain trends and/or fractal that might happen again in the future.
Since I already made D.A.M (Defi against Majors / Pricing Defi categories against BTC & ETH: ) I came across the idea of doing the same thing but with the perp indices that FTX offer. At first, I wanted to add this to D.A.M but it has no place in this indicator since this will not only look at Defi but the macro market as a whole.
The indicator currently only looks at the following indexes (weighting can be found here: https:// help. ftx. com/hc/en-us/articles/360027668812-Index-Calculation) :
DRGN: THE DRAGON INDEX
ARPA, BTM, IOST, NEO, NULS, ONT, QTUM, TRX, VET
ALT: ALTCOIN INDEX
BCH, BNB, EOS, ETH, LTC, XRP, TRX, DOT, LINK, ADA
MID: THE MID CAP INDEX
ALGO, ATOM, BAT, CRO, DASH, DCR, DOGE, HT, IOTA, LEO, NEO, OKB, ONT, QTUM, VET, XEM, XLM, XMR, XTZ, ZEC, ZRX, OMG, COMP, BSV, FTT, YFI, UNI, SNX, MKR, AAVE
SHIT: THE SHITCOIN INDEX
AE, AION, ARDR, ARPA, BCD, BEAM, BTG, BTM, BTS, BTT, CHZ, CKB, DGB, ELF, ENJ, GNT, GRIN, GT, HBAR, HC, ICX, IOST, KMD, KNC, LAMB, LRC, LSK, MANA, MATIC, MCO, NANO, NULS, OMG, POWR, PUNDIX, REN, REP, RVN, SC, SNT, STEEM, THETA, TOMO, VSYS, WAVES, XVG, XZC, ZEN, ZIL, ZRX
PRIV: THE PRIVACY INDEX
BEAM, DCR, GRIN, KMD, XMR, XVG, XZC, ZEC, ZEN
DEFI: THE DECENTRALIZED FINANCE INDEX
KNC, MKR, ZRX, REN, REP, SNX, COMP, TOMO, RUNE, CRV, DOT, LINK, MTA, SOL, CREAM, BAND, SRM, SUSHI, SWRV, AVAX, YFI, UNI, WNXM, AAVE, BAL
X Exchange BTC Cash Flow Index (Multi-Exchange)Custom Cash flow Index (Similar to MFI) indicator based on BTC World Volume across all exchanges.
Volume Data based on "BTC WORLD VOLUME" by Phil Ledru
How it works:
Use this indicator like to see momentum changes in Price and Volume across all exchanges for Bitcoin.
When momentum is positive, indicator will turn Blue.
When momentum is slowing down and price is declining, indicator will turn Red.
Like your usual RSI, OB & OS levels are 80 & 20.
What to watch out for:
- Watch out for Bullish and bearish divergences in Volume
- Wedges, Head and shoulders and other formations.
Enjoy!

Total Volume BTC - Dollar [Sobhm]
Do you want an indicator that shows the total volume in Bitcoin vs Dollar?!
The BTCUSD - BTCUSDT - BTCUSDC total volume is covered by the "Total Volume BTC - Dollar " indicator.
You can see the differences between simple volume and the collected volume using "Total Volume BTC - Dollar ".
The volume of the following pairs are collected:
'BITMEX:XBTUSD'
'BINANCE:BTCUSDT'
'BINANCE:BTCUSDTPERP'
'BITSTAMP:BTCUSD'
'COINBASE:BTCUSD'
'BITFINEX:BTCUSD'
'BYBIT:BTCUSD'
'GEMINI:BTCUSD'
'OANDA:BTCUSD'
'FTX:BTCUSD'
'FX:BTCUSD'
'HUOBI:BTCUSDT'
'BYBIT:BTCUSDT'
'COINBASE:BTCUSDC'
'BITSTAMP:BTCUSDC'
'POLONIEX:BTCUSDC'
'KUCOIN:BTCUSDC'
'HITBTC:BTCUSDC'
The timeframe is adjustable based on minutes.

PROFIT MAKER |Crypto|ETH|BTC|YFI - SignalThis is the version with alerts of this strategy:
Description:
This is a trend-following strategy that works very well for many Crypto assets in the usd or usdt pair
It can be used for both futures and spot!
Some of the assets in which this strategy is proven are
Asset Exchange TF
BINANCE:ADAUSDT Binance 45m
BINANCE:BTCUSDT Binance 1h
BINANCE:YFIUSDT Binance 30m
BINANCE:DOTUSDT Binance 45m
BINANCE:ETHUSDT Binance 30m
BINANCE:LINKUSDT Binance 45m
BINANCE:DOGEUSDT Binance 1h
And many others..
What is this strategy based on?
It is a combination of various parameters, including
-RSI: The relative strength index ( RSI ) is a momentum indicator used in technical analysis that measures
the magnitude of recent price changes to evaluate overbought or oversold conditions in the price of a stock or other asset.
-MACD: Moving average convergence divergence ( MACD ) is a trend-following momentum indicator that shows
the relationship between two moving averages of a security’s price.
-ADX: ADX is used to quantify trend strength. ADX calculations are based on a moving average of price range expansion over a given period of time.
-DMI: DMI is a moving average of range expansion over a given period (the default is 14 days). The positive directional
movement indicator ( +DMI ) measures how strongly price moves upward; the negative directional movement indicator ( -DMI )
measures how strongly price moves downward. The two lines reflect the respective strength of the bulls versus the bears.
Included:
Different forms of Take profit, included:
Take profit on squeeze candles
Take profit based on Risk-Benefit (RR)
Take profit a pre-determined %.
Different forms of Stop Loss, including
ATR-based stop loss
Trail stop loss (with option to use a trigger)
Stop loss a pre-determined %.
For access you can send a message or consult in my social networks.
Links in my tradingview signature (below).
Examples:
The default configuration works very well for most pairs.
You just have to look for which time frame goes better with each one.
Recommended to try with 30m, 45m and 1 hour.

Binance Weighted BTC IndexThis is the weighted index for Binance's tether-margined BTC and ETH markets.
It was created to test the accuracy of the weighting and ensure the index was correct. With consideration to the history of tether's effect on Bitfinex's spot market, I had interest in the differences in Bitfinex's USD and UST pairs. Although the difference now is minor, xxx/UST pairs in the index are more accurate.
Options to configure are choosing the base currency, BTC or ETH, and the quote currency, USD or UST (USDT).

Truenomic's Universal BTC and ETH VolumeA simple indicator to display the total volume of BTC or ETH from different exchanges. The difference between this indicator and others is the ability to see the total volume in BTC or ETH (not USD) from all exchanges simultaneously, including derivative ones.
Spot Exchanges:
Binance;
Coinbase;
Kraken;
Gemini;
Bitfinex;
Bitstamp;
Derivatives Exchanges:
Bitmex;
Okex;
Deribit;
FTX;
Binance;
This list is relevant only at the time of publication, stay tuned for further indicator updates!

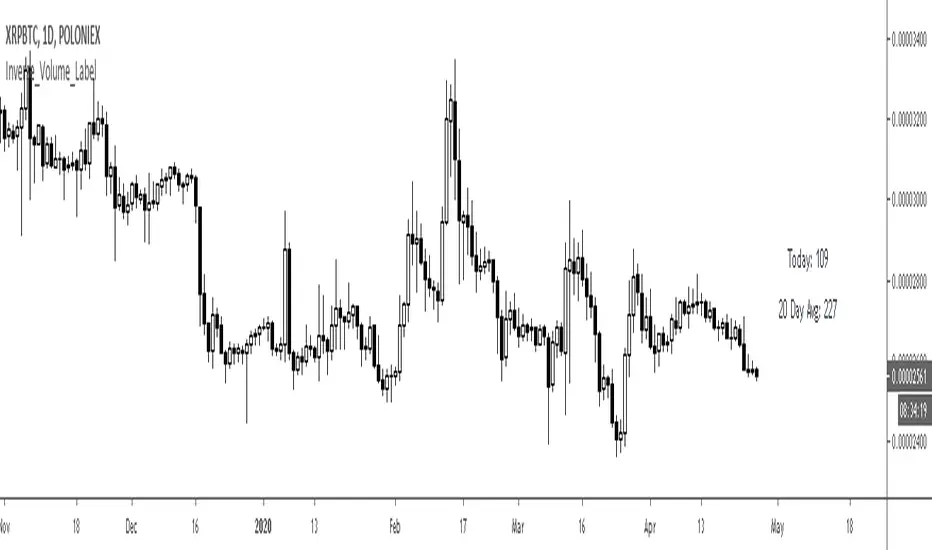
BTC/Fiat Volume Info for Altcoins: Quickly gauge liquidityBTC/Fiat Volume Info for Altcoins - Quickly gauge liquidity
On chart info that:
displays the daily Alt Coin volume in BTC if it is a BTC pair (or whatever the quote currency is)
displays the daily Alt Coin volume in USDT if it is a USDT pair (or whatever the quote currency)
displays the current timeframes volume for the above also.
each option can be configured on/off
Various Volume RSI (BTC vs ETH) [mushoku]RSI to show btc and eth fight(BINANCE)
Binance(バイナンス) のBTCとETHを同時に表示する RSI です。
無料で使用できます。
こちらでも簡単ですが紹介しています。
note.mu