Quantitative Trend Strategy- Uptrend longTrend Strategy #1
Indicators:
1. SMA
2. Pivot high/low functions derived from SMA
3. Step lines to plot support and resistance based on the pivot points
4. If the close is over the resistance line, green arrows plot above, and vice versa for red arrows below support.
Strategy:
1. Long Only
2. Mutable 2% TP/1.5% SL
3. 0.01% commission
4. When the close is greater than the pivot point of the sma pivot high, and the close is greater than the resistance step line, a long position is opened.
*At times, the 2% take profit may not trigger IF; the conditions for reentry are met at the time of candle closure + no exit conditions have been triggered.
5. If the position is in the green and the support step line crosses over the resistance step line, positions are exited.
How to use it and what makes it unique:
Use this strategy to trade an up-trending market using a simple moving average to determine the trend. This strategy is meant to capture a good risk/reward in a bullish market while staying active in an appropriate fashion. This strategy is unique due to it's inclusion of the step line function with statistics derived from myself.
This description tells the indicators combined to create a new strategy, with commissions and take profit/stop loss conditions included, and the process of strategy execution with a description on how to use it. If you have any questions feel free to PM me and boost if you enjoyed it. Thank you, pineUSERS!
ابحث في النصوص البرمجية عن "BULL"

Volume accumulation [TCS] | VTAThe indicator calculates buy and sell volume values for different look-back periods, based on the high, low, close, and tick volume data of the chart.
The calculated buy and sell volume values are stored in separate variables, which represent cumulative volume values over the respective look-back periods.
It's important to note that the code provided calculates the buy and sell volume values individually for each look-back period and after sum them.
It can be useful to understand who is in control of the market based on the look-back period.
For example if the price is decreasing but the volume in the past candle are bullish it means that the trend probably will turn.
Please note that this indicator is for educational purposes only and should not be used for trading without further testing and analysis.

FOREX MASTER PATTERN Companion ToolWhat This Indicator Does
The Forex Master Pattern uses candlesticks, which provide more information than line, OHLC or area charts. For this reason, candlestick patterns are a useful tool for gauging price movements on all time frames. While there are many candlestick patterns, there is one which is particularly useful...
The Engulfing Pattern
An engulfing pattern provides an excellent trading opportunity because it can be easily spotted and the price action indicates a strong and immediate change in direction. In a downtrend, an up candle real body will completely engulf the prior down candle real body (bullish engulfing). In an uptrend a down candle real body will completely engulf the prior up candle real body (bearish engulfing).
Used in conjunction with the FOREX Master Pattern value line, the Engulfing Pattern can assist the trader with reversal timing or trend confirmation during the expansion and trend phases.
As shown in the screenshot below. Engulfing Candles usually precede a sharp move in price in the direction of the engulfing candle.
As shown in the screenshot below, when the Show Lines option is ON while using the indicator, both red and green lines are drawn on the chart automatically when engulfing candles form. These lines are projected forward 100 bars and tend to be reliable support and resistance areas. These areas are typically hidden from view.
In addition to the Show Lines option, the indicator (by default) creates boxes around trading zones that are created when an engulfing candle is formed. (There is an option to hide these from view if desired).
As seen in the screenshot below, these areas / zones are wider than a line and encompass a resistance / support zone rather than a specific price. Liquidity is usually high in these areas and a lot of selling / buying occurs here. These zones are drawn in advance out into the future giving the trader an idea of where price will revert to eventually.
A combination of LINES and AREAS can be used giving the user a better idea of where within the zone price will go.
As seen on the screenshot below, this combination provides a pretty accurate indication of the reversal point well in advance.
As seen in the screenshot below, when a ZONE / AREA has been fully breached (crossed) by price, the area is deactivated an no longer continues forward on the chart. Until price breaches an area, it remains valid and continues on the chart until and only if it is breached by price.
The Indicator is fully customizable.
The use can change the color of the engulfing candles, the color of the zones, transparency etc. You can turn OFF or ON any of the features such as lines, zones, bar coloring, and plotted arrows.
I really hope you get value from this indicator and... HAPPY TRADING!!

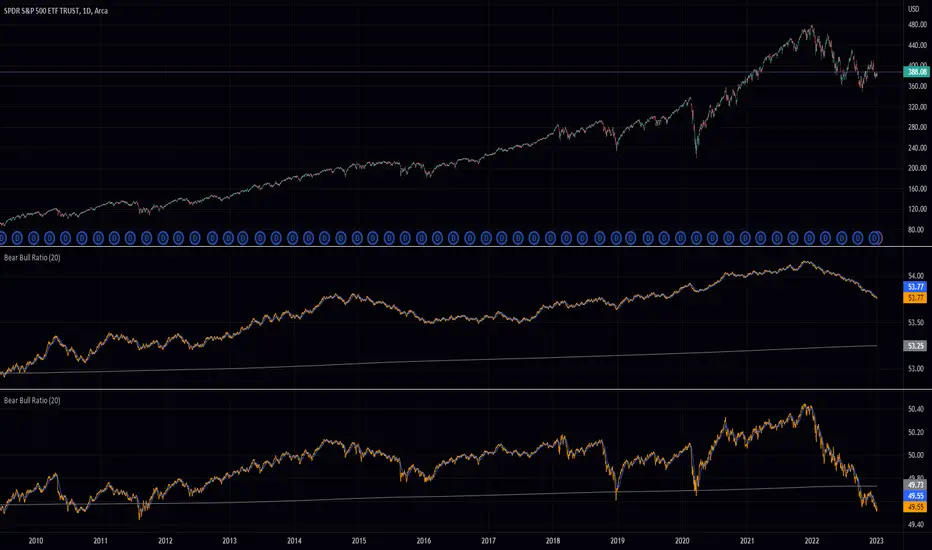
Bear Bull Ratio (BBR)This indicator calculates the ratio of bearish to bullish candles over a certain window of time. It does this by keeping track of the number or distance (depending on the "Enable True Range Mode" input) between the high and low prices of bullish and bearish candles, respectively, and then dividing the total distance of bullish candles by the sum of the distances of both bullish and bearish candles. The resulting ratio is then plotted on the chart as a percentage. The indicator also plots a smoothed version of the ratio using a weighted moving average and the average of the ratio over the entire length of the chart, for both the "True Range Mode" and "Normal Mode".
Stock Market Emotion Index (SMEI)Implementation of Charlie Q. Yang's research paper “The stock market emotion index”, subtitle “A New Sentiment Measure Using Enhanced OBV and Money Flow Indicators”, (2007) where he combined “five simple emotion statistics” - Close Emotion Statistic (CES), Money Flow Statistic (MFS), Supply Demand Statistic (SDS), Relative Strength Statistic (RSS), and Psychological Level Statistic (PLS) - into one indicator.
Quotations:
“The index calculation is solely based on observed short term market volatility as reflected by each day’s trading volume, open, high, low, and close prices”
“The basic premise of Dow theory is that the market discounts everything, including the emotions of all traders. The fundamentals of a company do not change suddenly when its daily stock price is fluctuating as driven by human emotions that are often irrational. However, over a longer time period, a company's fundamentals do change. Again, different types of human emotions, triggered by the flow of material events, are moving the stock price trend up or down. This paper summarizes the author’s attempt in understanding primary trend extent and duration by proposing a new sentiment measure using statistical analysis of stock market human emotion.”
Even though “indicator is intended for identifying primary trend cycles that typically last one year or longer“ where Mr. Yang used a fixed averaging length of 260 days and only days as time frame, my implementation has been changed slightly to accommodate for all time frames and to adapt faster using shorter averaging (timeframe dependent).
How to use it:
Positive values indicating a bullish trend and negative values indicating a bearish trend. Background color is set to green or red accordingly.
Positive and negative bar to bar changes are indicated with green and red to show bar to bar (ultra short term) trends.
(No financial advise, use for testing purposed only)

Infiten's Adjusted Bull-Bear Power Oscillator An extension of TradingView's new ADR and bull-bear power indicators, this indicator is helpful for spotting abnormal bullish and bearish activity to get good contrarian entry points.
How to interpret the indicator
When the white columns cross over the red line, it's a bearish indicator since the asset has been overbought.
When the white columns cross under the green line, it's a bullish indicator since the asset has been oversold.
How it's calculated
The adjusted bull-bear power oscillator is calculated by multiplying the bull-bear power indicator by my NDO indicator, to adjust the bull-bear power for volume. The upper green line and lower red line are calculated as the product of a multiplier input and the average daily range indicator.

Momentum With Bullish & Bearish LabelMOMENTUM WITH BULLISH AND BEARISH SIGNALS
This is a momentum oscillator that paints red or green depending on whether Momentum is above or below the zero line. It includes a label on the right hand side that will reflect the bullish or bearish direction of the current momentum by changing colors to red or green and text telling you Bullish or Bearish.
***HOW TO USE***
When Momentum is above zero, it is bullish. When Momentum is below zero it is bearish.
A label on the right side will update in real time to tell you if momentum is Bullish or Bearish for faster recognition of the trend.
When momentum is above the zero line(Bullish) but trending downward, a second label will show up in purple to notify you of a change in momentum direction.
When momentum is below the zero line(Bearish) but trending upward, a second label will show up in purple to notify you of a change in momentum direction.
This indicator was built to help you quickly identify the Bullish or Bearish nature of the current Momentum using colors as well as a live color changing label so you can glance at the label and understand it's direction without analyzing the indicator data.
***MARKETS***
This indicator can be used as a signal on all markets, including stocks, crypto, futures and forex.
***TIMEFRAMES***
This momentum indicator can be used on all timeframes.
***TIPS***
Try using numerous indicators of ours on your chart so you can instantly see the bullish or bearish trend of multiple indicators in real time without having to analyze the data. Some of our favorites are our Auto Fibonacci, Directional Movement Index, Volume Profile, Auto Support And Resistance and Money Flow Index in combination with this Momentum Oscillator. They all have real time Bullish and Bearish labels as well so you can immediately understand each indicator's trend.

RSI with Divergences, Reverse Formulas, and Bull/Bear ZonesRegular RSI indicator that can underline divergences, turn green or red specifying user specified bull/bear zones, and with a label showing the price needed to turn bull/bear!
Specify the inputs:
+ RSI Length
+ Bull Threshold
+ Bear Threshold
+ Panel Position Offset
Also with toggle-able:
+ Bullish Divergence
+ Bearish Divergence
+ Hidden Bullish Divergence
+ Hidden Bearish Divergence
The zones included in the indicator are default and not meant to be used for all markets. The goal is to alter the bull/bear zones to find good breakout points and selloff points for your chosen security. Does not currently support automatic zone creation, or saving zones for each security (if that is even possible, may just need to create different layouts for each security).
Thanks!

Rebalance as a Bear/Bull indicatorCheck if the current market has a Bear tendency or a Bull tendency.
Bear areas are marked as red squares going down from 0.
Bull areas are marked as green squares going up from 0.
Buying/Selling windows of opportunity
On top of the Bear/Bull squares, this indicator tries to show you the windows where to look for good buying/selling opportunities.
These are marked as full columns:
Blue columns represent a window to look out for good buying opportunities
Pink columns represent a window to look out for good selling opportunities
How is this possible?
This is an indicator of a simple idea to check if the market has a Bear or Bull tendency:
1. Start with a virtual portfolio of 60/40 tokens per fiat.
2. Rebalance it when its ratio oscillates by a given % (first input)
3. Count the number of times the rebalancer buys, and sells
4. When the number of buys is greater than the number of sells => the market is going down
5. When the number of sells is greater than the number of buys => the market is going up
This is shown as the "Bear/Bull Strength" squares (red when bear, green when bull)
An extra rebalancer is also kept that works at each bar (regardless of the input %).
This is used to calculate an amount of tokens beying sold/bought and used as a "market force" coefficient.
Another extra: based on both the bear/bull strengh and market force an attempt is made to
provide good buying/selling windows of analysis.
The blue background is a buying opportunity, the red background is a sell opportunity.
In a bear market sales are delayed, and in a bull market buys are delayed.

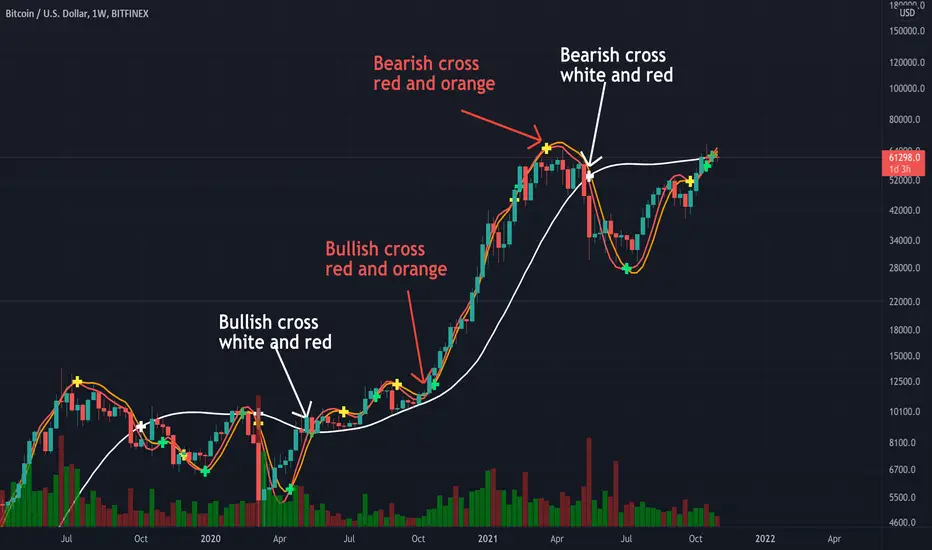
Triple Modified Hull Moving Average Cross By <Zakaria>Triple Modified Hull Moving Average Cross By
What is this?
this is a modified formula for Hull moving average, it is more accurate and predicts the golden and death cross earlier.
How to use?
Work better in high time frames (1D,1W)
the white line vs the red and the orange lines :
1 - when the white line crosses the red and the orange lines from the bottom the price will go down . Death cross!
2 - when the white line crosses the red and the orange lines from the top the price will go up . Golden Cross!
the red line vs the orange line :
1- when the orange line crosses the red line from the bottom the price will go down . Death cross!
2 - when the orange line crosses the red line from the top the price will go up . Golden Cross!
p.s: the lag between these two lines will be very small. use it in the 1W time frame to predict where exactly the bull market will end.
You can input your personalized values if you want!
CandleEvaluationLibrary "CandleEvaluation"
Contains functions to evaluate bullish and bearish, engulfing, and outsized candles. They are different from the built-in indicators from TradingView in that these functions don't evaluate classical patterns composed of multiple candles, and they reflect my own understanding of what is "bullish" and bearish", "engulfing", and "outsized".
isBullishBearishCandle()
Determines if the current candle is bullish or bearish according to the length of the wicks and the open and close.
int _barsBack How many bars back is the candle you want to evaluate. By default this is 0, i.e., the current bar.
returns Two values, true or false, for whether it's a bullish or bearish candle respectively.
isTripleBull()
Tells you whether a candle is a "Triple Bull" - that is, one which is bullish in three ways:
It closes higher than it opens
It closes higher than the body of the previous candle
The High is above the High of the previous candle.
int _barsBack How many bars back is the candle you want to evaluate. By default this is 0, i.e., the current bar.
returns True or false.
isTripleBear()
Tells you whether a candle is a "Triple Bear" - that is, one which is bearish in three ways:
It closes lower than it opens
It closes lower than the body of the previous candle
The Low is below the Low of the previous candle.
int _barsBack How many bars back is the candle you want to evaluate. By default this is 0, i.e., the current bar.
returns True or false.
isBigBody()
Tells you if the current candle has a larger than average body size.
int _length - The length of the sma to calculate the average
float _percent - The percentage of the average that the candle body has to be to count as "big". E.g. 100 means it has to be just larger than the average, 200 means it has to be twice as large.
returns True or false
isBullishEngulfing()
Tells you if the current candle is a bullish engulfing candle.
int _barsBack How many bars back is the candle you want to evaluate. By default this is 0, i.e., the current bar.
int _atrFraction The denominator for the ATR fraction, which is the small amount by which the open can be different from the previous close.
returns True or false
isBearishEngulfing()
Tells you if the current candle is a bearish engulfing candle.
int _barsBack How many bars back is the candle you want to evaluate. By default this is 0, i.e., the current bar.
int _atrFraction The denominator for the ATR fraction, which is the small amount by which the open can be different from the previous close.
returns True or false

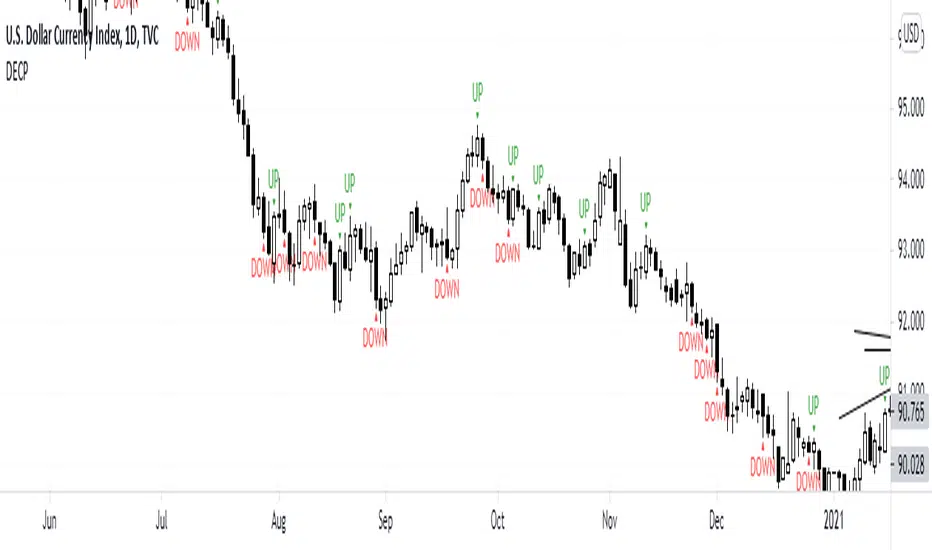
DECPDECP is simple and easy to use!
It detects bullish and bearish engulfing candlestick patterns.
After detecting the patterns I've said, it mentions that the pattern is going to continue its direction to up or down.
But remember candlestick patterns don't determine targets and it's possible that predicted directions fail.
So use it carefully and enjoy it!
Best Bulls Bears Volume trend Breakout V2 [badshah_e_alam]This is a intraday indicator. Only to be used on timeframe less than daily charts.
This indicator purely uses volume to plot the graph. The indicator helps in conforming a breakout strategy.
This indicator is advanced version of my previously developed indicator you can check this link
Total volume is made up of buying volume and selling volume . Buying volume is the number of shares, contracts, or lots that were associated with green bars, and selling volume is the number that were associated with red bars.
The labels on the right side are the current bar value and that days bulls /bears weightage.
the first value shows the current bar volume.
second value show the bulls weight in %
third value show the bears weightage throughout the day ( %)
The Blue plot in graph keeps the track of bulls movement in intraday( %)
The Red plot in graph keeps the track of bears movement in intraday ( %)
X axis is time.
Y axis ranges from 100 to -100
I use 1:2 risk to reward ratio. Do your own research.
**not a financial advice**
Example of price increasing, volume decreasing
this indicator can be used for confirming a breakout strategy with bulls or bears in action. In the current example, the buyer’s volume percentage is reducing and the price is increasing throughout the day. Hence a breakout of the trendline is confirmation of a short trade.
Example of Price reducing, volume decreasing
example of price moving down , bears losing the grip
Example of price decreasing volume increasing
Thanks to nizar9599 for giving idea to improve my previous indicator.
DISCLAIMER
Any and all liability for risks resulting from investment transactions or other asset dispositions carried out by the user based on information received or a market analysis is expressly excluded by me.
All the information made available here is generally provided to serve as an example only, without obligation and without specific recommendations for action. It does not constitute and cannot replace investment advice. We therefore recommend that you contact your personal financial advisor before carrying out specific transactions and investments.
Do your own research, This is not a financial advice.

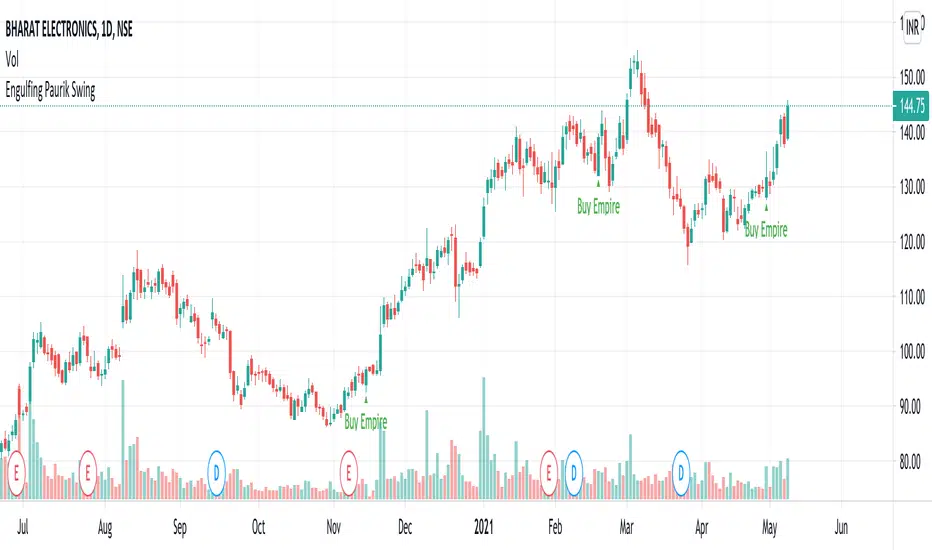
Engulfing Empire at over Sold Over <50 Bought >50Shows bulling engulfing patterns only if above >50 rsi and Shows Bearish engulfing patterns only if above <50 rsi
. Very simple.
Indicator Conditions RSI above 50 overbought/below 50 oversold, price is above/below)
Entry Reasons (eg. a bullish or bearish engulfing candle)
Percentile Rank Market FilterA simple script to filter bull and bear markets by using percentile rank filter. Using market regimes to filter by bull/bear/sideways markets helps to understand how your strategy will
behave in various market regimes and allows you to avoid unprofitable regimes and only trade in profitable ones.
The idea of market regime filtering is used in the most successful technical algorithmic trading strategies, as one should always design a trading strategy with a particular market in mind according to trading legend, Larry Connors
Feel free to use this script in your strategies to improve your profits and lower drawdowns.

ATR with EOM and VORTEXThis is a strategy, designed for long trends for stock and crypto market.
Its made of ATR for volatility, EOM for volume and VORTEX for the trend direction.
In this case on the ATR, I applied an EMA to check if current position is above the EMA -> bull trend, below ema -> bear trend
For EOM I am using the positive and negative value scale, if its positive we are in a bull movement, otherwise a bear movement.
Lastly for VORTEX, I took the min and max, and made an average, after that I am using the average and compare it with 1 value. Above 1 -> bull, belowe 1-> bear.
This strategy only goes long.
If you have any questions, let me know.

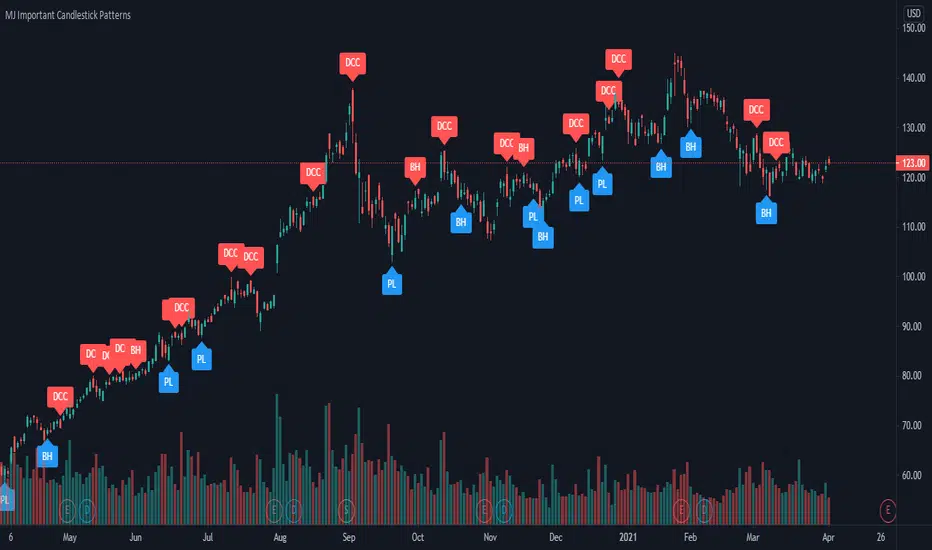
MJ Important Candlestick Patterns + Smart TrendThis script detects 6 important candlestick patterns defined by the author and puts chart labels on your chart for your attention. It also includes a smart trend checking algorithm to detect trends.
The six candlestick patterns covered are:
Bullish Engulfing
Bearish Engulfing
Piercing Line
Dark Cloud Cover
Bullish Harami
Bearish Harami
*** Smart feature of this indicator is that it can detect uptrends or downtrends before alerting you regarding the bullish or bearish reversal candlestick pattern. This is achieved by comparing the typical price (high+low+close divided by 3) of today's candle versus three days ago.
Scalping Dips On Trend (by Coinrule)Coinrule's Community is an excellent source of inspiration for our trading strategies.
In these months of Bull Market, our traders opted mostly on buy-the-dips strategies, which resulted in great returns recently. But there has been an element that turned out to be the cause for deep division among the Community.
Is it advisable or not to use a stop-loss during a Bull Market?
This strategy comes with a large stop-loss to offer a safer alternative for those that are not used to trade with a downside protection.
Entry
The strategy buys only when the price is above the Moving Average 50 , making it less risky to buy the dip, which is set to 2%.
The preferred time frame is 1-hour.
The stop-loss is set to be quite loose to increase the chances of closing the trade in profit, yet protecting from unexpected larger drawdowns that could undermine the allocation's liquidity.
Exit
Stop loss: 10%
Take Profit: 3%
In times of Bull Market, such a trading system has a very high percentage of trades closed in profit (ranging between 70% to 80%), which makes it still overall profitable to have a stop-loss three times larger than the take profit.
Pro tip: use a larger stop-loss only when you expect to close in profit most of the trades!
The strategy assumes each order to trade 30% of the available capital and opens a trade at a time. A trading fee of 0.1% is taken into account.

Crypto BULL signalThis BULL signal will pop up if the EMAs on the chart are looking bullish and the MACD crosses bullish. Of course it will never be a 100% hit rate, please practice good risk management.

Probability: Bull/Bear Dominance | Ratio | Bar CountIntro
What's the probability of the next bar being red? How about green? Well, there are many ways to quantify the probability but I am presenting just one stupidly simple (but generally accurate) way to measure it.
Strangely... no one has done this before that I can find. I try to check if someone else has done it first (Pro Tip: Plz do this. We honestly don't need the 5 trillionth "MTF MAs" script.)
Indicator
Its a basic counting script, but the nice thing about this script is you choose the time range. It starts counting from a specified point of your choosing. It counts up the bull bars and bear bars separately.
Bull Bar = Close > Open
Bear Bar = Open > Close
You can look at them in sum or as a ratio of Green Bars : Red Bars
I know, it's almost too simple. But, here's some interesting food for thought from a layman to fellow laymen.
Analysis/Edge
Between the time of candle open and candle close, the price can do one of three things, close higher, close lower, or close equal to.
'Equal to' is rare on higher timeframes in liquid markets and it provides no useful information. Thus, we'll nix it for purposes of this conversation.
So boil it down. The next candle is going to be a red candle or a green candle.
It is popular to refer to the general probability of most candles as 50/50, with trader's mission in life being to seek an edge that tilts the probabilities slightly in their favor.
The truth is the odds are probably never actually 50/50, but knowing the precisely correct probability is unknowable, just like the accuracy of a weather forecast is inherently unknowable. What we're trying to do as traders is develop systems that give us predictive probabilistic outcomes that correspond with future realities based on various ways of measuring the market (most often heavily dependent on the past).
The reality is that the market can be measured in many, many different ways. The important thing is that you measure it in a way that is accurate, relevant, and universally applicable.
So look at this indicator here:
You start from a point in time on a chosen timeframe and you put red bars in the red column, green in the green column, and count them all up.
Then you make a ratio, in this case, Green : Red.
What the ratio shows you is the percentage of green bars compared to red bars . At the time of this screenshot, the 4h on the SPX starting from the 2020 bottom is showing a ratio of 1.2.
This means there have been 20% more green bars than there have been red bars.
Now there are 1,000 directions you can take this discussion. What is the overall volatility picture, the size of the red bars vs the green bars, what happens if you miss out on the 5 biggest green bars... so many more variables that you would need to take into account to develop a true edge from this idea. But, the bottom line fact (which is what I like about this) is that we can take this data and say with a certain level of confidence that on the SPX you have a 20% better shot at making money (otherwise stated there's a 60/40 chance) if you open a LONG trade at the beginning of a 4h candle than if you open a short.
That's useful information. One could argue that it's not a complete strategy in and of itself (although I bet it could be with a couple of additional parameters). But I can tell you, based on the 4h candles in the 2020 rally if you open a short, the deck is stacked against you from this perspective. And we can actually somewhat demonstrate this to be true for our dataset because we can look at the price history and see who likely made more money. The SPX is up 1000pts off the bottom. So, thus far, for this dataset, it rings true; Bulls have been doing way better in the latter part of 2020 than the bears.
Conclusion
Predictive systems with a small number of variables tend to be more robust than a system with many variables when applied to a complex system. I may keep updating this script if people like it and determine aspects like population vs sample size, confidence intervals, volatility, and exclusion of outliers. For now, this is just an opening foray into the basic idea of how we can establish an edge in the markets. It really can be this simple.
Thanks for Reading.

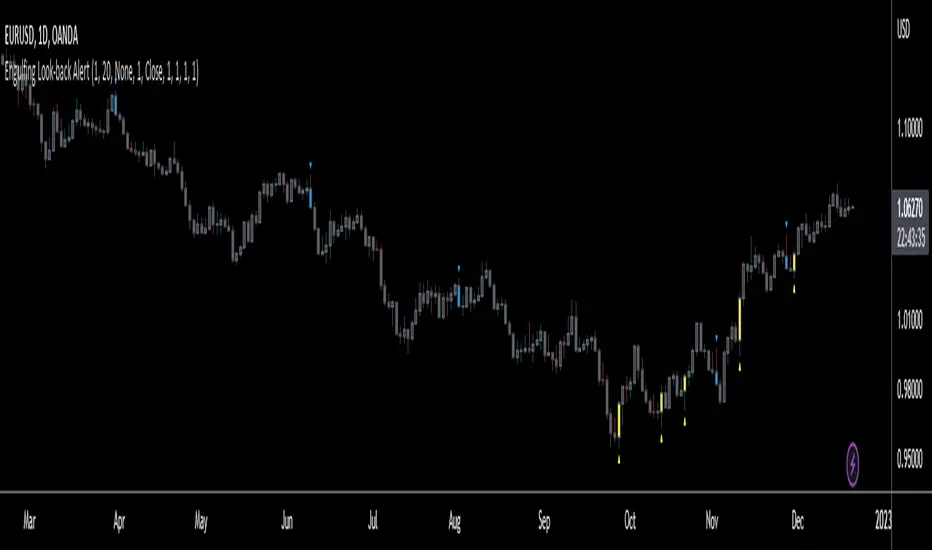
Engulfing Look-back AlertThis script is an extension of the classical engulf pattern with added rules and user defined features.
Engulfing Candle Definition:
- Bullish Engulfing: Trade BELOW the prior candle's LOW and CLOSE ABOVE the prior candle's HIGH. Previous candle can be an up (bullish) or a down (bearish) candle
- Bearish Engulfing: Trade ABOVE the prior candle’s HIGH and CLOSE BELOW the prior candle’s LOW. Previous candle can be an up (bullish) or a down (bearish) candle
Features:
- Set the look-back period for engulfing candle high and low -> default = 1; e.g. Did the bullish eng candle trade below the lows of the last 3 candles and trade above the highs of the last 4 candles? Set the input values accordingly
- Choose time frame(s) engulfing candle is to be displayed on -> default = M/W/D/4H/1H/15M
- Ability to enable Alerts (includes time frame alert was triggered on): IMPORTANT - when setting alerts ensure to choose "ONCE PER BAR"; otherwise alerts will NOT trigger as intended
prntscr.com
Red and Green Ignored Bar by Oliver VelezOn this occasion I present a script that detects Ignored Red Candles and Ignored Green Candles, basically it is a Price Action event that indicates a possible continuation of the current trend and gives the opportunity to climb it with a Very tight risk, before delving into detail I would like to leave this note:
Note: the detection of this event does not guarantee that the signal will be good, the trader must have the ability to determine its quality based on aspects such as trend, maturity, support / resistance levels, expansion / contraction of the market, risk / benefit, etc, if you do not have knowledge about this you should not use this indicator since using it without a robust trading plan and experience could cause you to partially or totally lose your money, if this is your case you should train before If you try to extract money from the market, this script was created to be another tool in your trading plan in order to configure the rules at your discretion, execute them consistently and have AUTOMATIC ALERTS when the event occurs, which is where I find more value because you can have many instruments waiting for the event to be generated, in the time frame you want and without having to observe the mer When the alert is generated, the Trader should evaluate the quality of the alert and define whether or not to execute it (higher timeframes, they can give you more time to execute the operation correctly).
Let's continue….
This event was created by Oliver Velez recognized trader / mentor of price action, the event has a very interesting particularity since it allows to take a position with a very limited risk in trend movements, this achieves favorable operations of good ratio and small losses when taking An adjusted risk, if the trade works, a good ratio is quickly achieved and we agree with a key point in the “Keep small losses and big profits” trading, this makes it easier to have a positive mathematical hope when your level of Success is not very high, so leave you in the field of profitability.
THE EVENT:
The event has a bullish configuration (Ignored Red Candle) and a bearish configuration (Ignored Green Candle), below I detail the “Hard” rules (later I explain why “Hard”):
1- Last 3 bars have to be GREEN-RED-GREEN (possible bullish configuration) or RED-GREEN-RED (possible bearish configuration), the first bar is called Control Bar, the second is called Ignored Bar and the third Signal Bar as shown in the following image:
2- Be in a trend determined by simple moving averages (Slow of 20 periods and Fast of 8 periods), as a general rule you can take the direction of MA20 but the Trader has to determine if there is a trend movement or not.
3- Control bar of good range, little tail and with a body greater than 55%.
4- Ignored bar preferably narrow range, little tail and that is located in the upper 1/3 of the control bar.
5- Signal bar cannot override the minimum of the ignored bar.
6- Activation / Confirmation of event by means of signal bar in overcoming the body of the ignored bar.
Some examples of ignored bars (with “Hard” and “Flexible” rules):
Features and configuration of the indicator:
To access the indicator settings, press the wheel next to the indicator name VVI_VRI "Configuration options".
- Operation mode (Filtering Type):
• Filtering Complete: all filters activated according to the configuration below.
• Without Filtering: all filters deactivated, all VRI / VVI are displayed without any selection criteria.
• Trend Filter only: shows only VRI / VVI that are in accordance with what is set in “Trend Settings”
- Configuration Moving Averages:
• See Slow Media: slow moving average display with direction detection and color change.
• See Fast Media: display of fast moving average with direction detection and color change.
• Type: possibility to choose the type of media: DEMA, EMA, HullMA, SMA, SSMA, SSMA, TEMA, TMA, VWMA, WMA, ZEMA)
• Period: number of previous bars.
• Source: possibility to choose the type of source, open, close, high, low, hl2 hlc3, ohlc4.
• Reaction: this configuration affects the color change before a change of direction, 1 being an immediate reaction and higher values, a more delayed reaction obtaining les false "changes of direction", a value of 3 filters the direction quite well.
- Trend Configuration
• Uptrend Condition P / VRI: possibility to select any of these conditions:
o Bullish MA direction
o Quick bullish MA direction
o Slow and fast bullish MA direction
o Price higher than slow MA
o Price higher than fast MA
o Price higher than slow and fast MA
o Price higher than slow MA and bullish direction
o Price higher than fast MA and bullish direction
o Price higher than slow, fast MA and bullish direction
o No condition
• Condition P / VVI bear trend: possibility of selecting any of these conditions:
o Slow bearish MA direction
o Fast bearish MA direction
o Slow and fast bearish MA direction
o Price less than slow MA
o Price less than fast MA
o Price less than slow and fast MA
o Price lower than slow MA and bearish direction
o Price less than fast MA and bearish direction
o Price less than slow, fast MA and bearish direction
o No condition
- Control bar configuration
• Minimum body percentage%: possibility to select what body percentage the bar must have.
• Paint control bar: when selected, paint the control bar.
• See control bar label: when selected, a label with the legend BC is plotted.
- Configuration bar ignored
• Above X% of the control bar: possibility to select above what percentage of the control bar the ignored bar must be located.
• Paint ignored bar: when selected, paint the ignored bar.
- Signal bar configuration
• You cannot override the minimum of the ignored bar: when selected, the condition is added that the signal bar cannot override the minimum of the ignored bar.
• Paint signal bar: when selected, paint the signal bar.
• See arrow: when selected it shows the direction arrow of the possible movement.
• See bear and arrow: when selected it shows bear and arrow label
• See bull and arrow: when selected it shows bull and arrow label
The following image shows the ignored bar and painted signal:
- Take profit / loss
The profit / loss taking varies depending on the trader and its risk / monetary plan, the proposal is a recommendation based on the nature of the event that is to have a small risk unit (stop below the minimum of the ignored bar), look for objectives in ratios greater than 2: 1 and eliminate the risk in 1: 1 by taking the stop to BE, all parameters are configurable and are the following:
• See recommended stop loss and take profit: trace the levels of Stop, BE, TP1 and TP2, as well as their prices to know them quickly based on the assumed risk
• To: select which event you want to draw the SL and TP (VRI, VVI)
• Extend stop loss line x bars: allows extending the stop line by x number of bars
• Extend take profit line x bars: allows extending the stop line by x number of bars
• Ratio to move to break even: allows you to select the minimum ratio to move stop to break even (default 1: 1)
• Take profit 1 ratio: allows you to select the ratio for take profit 1 (default 2: 1)
• Take profit 2 ratio: allows you to select the ratio for take profit 2 (default 4: 1)
- Alerts
• It is possible to configure the following alerts:
-VRI DETECTED
-VVI DETECTED
-VRI / VVI DETECTED
Final Notes:
- The term hard rules refers to the fact that an event is sought with the rules detailed above to obtain a high quality event but this brings 2 situations to consider, less
number of events and events that are generated in a strong impulse may be leaked, a very large control bar followed by an ignored narrow body away from moving averages, despite having a good chance of continuing, taking a stop very tight in a strong impulse you can touch it by the simple fact of the own volatility at that time.
- The setting of the parameters “Minimum body percentage% (control bar)”, “Above x% of the control bar (bar ignored)” and “Cannot override the minimum of the ignored bar” can bring large Benefits in terms of number of events and that can also be of high quality, feel free to find the best configuration for your instrument to operate.
- It is recommended to look for trending events, near moving averages and at an early stage of it.
- The display of several nearby VRIs or VVIs in an advanced trend may indicate a depletion of it.
- The alerts can be worked in 2 ways: at the closing of the candle (confirms event but the risk unit may be larger or smaller) or immediately the body of the ignored bar is exceeded, in case you are operating from the mobile and miss many events because of the short time I recommend that you operate in a superior time frame to have more time.
- The indicator is configured with “flexible” rules to have more events, but without any important criteria, each trader has to look for the best configuration that suits his instrument.
- It is recommended to partially close the operation based on the ratio and always keep a part of the position to apply manual trailing stop and try to maximize profits.
The code is open feel free to use and modify it, a mention in credits is appreciated.
If you liked this SCRIPT THUMB UP!
Greetings to all, I wish you much green!

Dependent Variable Odd Generator For Machine Learning TechniquesCAUTION : Not suitable for strategy, open to development.
If can we separate the stagnant market from other markets, can we be so much more accurate?
This project was written to research it. It is just the tiny part of the begining.
And this is a very necessary but very small side function in the main function. Lets start :
Hi users, I had this idea in my mind for a long time but I had a hard time finding the parameters that would make the market stagnant. This idea is my first original command system. Although it is very difficult to make sense of the stagnant market, I think that this command system can achieve realistic proportions. With 's money flow index, I opened the track to determine the level. On the other hand, the prices were also using a money flow index, and it forced me to make the limitations between the levels in a logical way. But the good thing is that since the bollinger bandwidth uses a larger period, we are able to print normal values at extreme buy and sell values.
In terms of price, we can define excessive purchase and sale values as the period is smaller. I have repeatedly looked at the limit values that determine the bull, bear, and bollinger bandwidth (mfi), and I think this is the right one. Then I have included these values in the probability set.
The bull and bear market did not form the intersection of the cluster, and because there are connected events, the stagnant market, which is the intersection, will be added to the other markets with the same venn diagram logic and the sum of the probability set will be 1. is equal to. I hope that we can renew the number generators in the very important parameters of machine learning such as Markov Process with generators dependent on dependent variables, which bring us closer to reality. This function is open to development and can be made of various ideas on machine learning. Best wishes.
This code is open source under the MIT license. If you have any improvements or corrections to suggest, please send me a pull request via the github repository github.com
