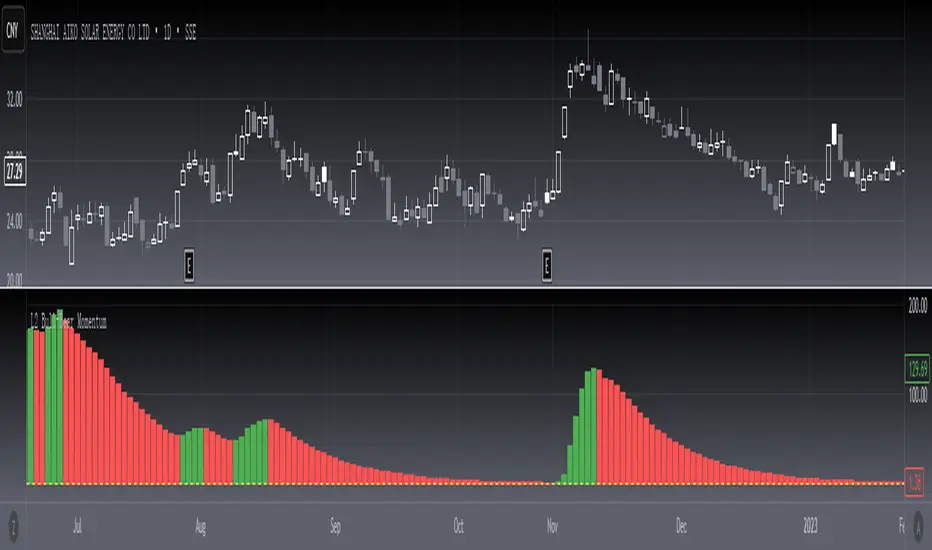
[blackcat] L2 Bull-Bear MomentumLevel 2
Background
Momentum effect is generally called "inertia effect". Momentum effect was proposed by Jegadeesh and Titman (1993), which refers to the tendency of the return rate of the stock to continue the original direction of movement, that is, the return rate of the stock with a higher return rate in the past period will still be higher than the return rate in the past low-yielding stocks.
Function
The Bullish and Bearish Momentum Technical Indicator is a strategy for buying and selling by analyzing the strength and weakness of recent price trends. Traders seek to take advantage of the rising or falling trend of stock prices. When this technical indicator indicates that the stock is entering a strong upward trend, the trader will buy the stock; Will choose to short the stock.
In short, momentum trading is trading with the trend. Momentum trading is based on the idea that if there is enough momentum behind the current price action, it will continue to move in the same direction. When an asset reaches a higher price, it usually attracts more investor attention, driving up the market price. The price rise continues until sellers start to enter the market consistently, and once sellers slowly outpace buyers, momentum weakens and the trend may reverse.
I have not marked special tags for this indicator usage. Users are expected to define according to their own understanding. On the whole, the basic usage is to start long positions when the first green column appears; when the first red column appears, close long positions or open short positions.
Remarks
Feedbacks are appreciated.
ابحث في النصوص البرمجية عن "BULL"
Breakout Candles + RSIHello!
This is my firt script :)
This indicator looks for candles that are significantly larger than the previous X candle.
It is possible to set the following:
Multiplier: deviation from the size of the previous X candle (if set to 3 the size of the actual candle's body /abs(open - close)/ must be larger than the size of the bigger candle from the prevous X candles)
Previous candles: the number of previous candles to size check
Upper RSI limit: if the RSI14 close higher than the specified number, the candle will ignore
Lower RSI limit: if the RSI14 close lower than the specified number, the candle will ignore
Without dojis: if checked, watches candles only that do not have a bottom spike (bullish) or top spike (bearish). Useful for Heikin-Ashi candles
Feel free to left any suggestion!
Thank You!

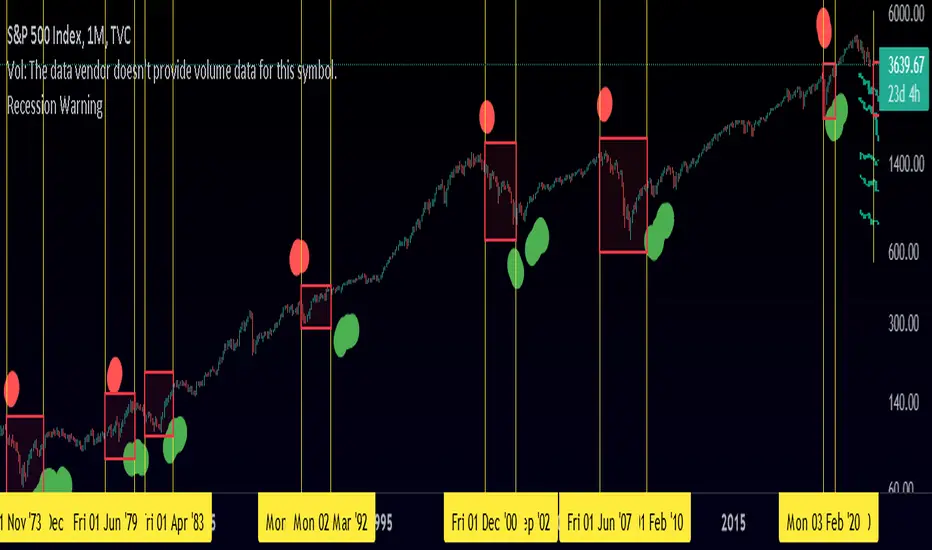
Recession And Bull Run WarningThis script uses 2 moving averages of Unemployment and projects a possible recession period or bull run period.
A Red Dot means a recession could've started or is coming soon - markets could possibly fall for the next few months.
A Green Dot means a bull run could begin following a recessionary period - markets could possibly rally for the next few months.
Using Unemployment to define recessionary periods has been highly accurate and has very often predicted many downturns and bull runs way before they occurred, as history suggests of course.
Have fun with this indicator!
Elder Ray (Bull Power) TP and SL Developed by Dr Alexander Elder, the Elder-ray indicator measures buying
and selling pressure in the market. The Elder-ray is often used as part
of the Triple Screen trading system but may also be used on its own.
Dr Elder uses a 13-day exponential moving average (EMA) to indicate the
market consensus of value. Bull Power measures the ability of buyers to
drive prices above the consensus of value. Bear Power reflects the ability
of sellers to drive prices below the average consensus of value.
Bull Power is calculated by subtracting the 13-day EMA from the day's High.
Bear power subtracts the 13-day EMA from the day's Low.
WARNING:
- For purpose educate only
- This script to change bars colors.
EMA + Bullish Engulfing Candle Pattern StrategyHello Guys! Nice to meet you all!
This is my first open source script!
### Long Condition
1. Bullish Engulfing Candle
2. No doge Candle
3. Present volume should be bigger than the previous volume (20%)
4. Trend filter (with 2 EMAs)
### Close Condition
1. When trend Changes
2. When Bearish Engulfing Candle appears
###
No stop loss and take profit.

Current price & Daily openFor those who likes clean chart:
I made a simple script that shows Current price based on the last candle color.
Also can show Daily open line based on the daily candle color.
Daily open line is same as strong support and resistance levels.
Mostly price shows strong responces on daily open line.
1: Daily open line color is blue if current price is above the daily open line.
And daily open line is red if current price is below the daily open line.
This means blue daily open line represents bullish daily candle and red daily open line represents bearish daily candle.
Simply you can expect Buy setup on the daily open line if it is blue and vice versa. That means you are following the daily trend, nothing else.
Always double confirm with your own trading style. It's not guaranteed.
You can use this script when you want to see daily price action or to find daily high lows.
This script helps to identify the following day high and lows too on the lower timeframe.
2: When you add drawing tools on your chart price labels are overlapping or if you choose not overlap then price moves up or down so you are not able to see current price easily.
This script helps to show current price on the last candle. You can easily see the current price.
Current price color is blue when last candle is bullish and it's red when last candle is bearish .
It always calculates last candle. So it could be weekly or 1 minute candle, whatever timeframe you working on.
Thank you.

Volume Bull & BearHello Trader,
thanks to the new request.security_lower_tf()-function we are able to calculate intrabar volume. So here is my approach.
Please be aware, that the selected resolution should always be smaller than the selected chart timeframe.
You can find the exact values for bullish and bearish volume in the data window.
Hope it helps some of you :)

Ari Bull BandThe ARI Bull Band is an indicator based on EMA, HMA and RSI.
When the band is GREEN, the market is on an uptrend.
When the band is RED, the market is on a downtrend.
When the band is Green:
If the candle closes above the band and RSI is overbought, a red triangle will be painted on the top of the candle, suggesting a selling opportunity
When the band is Red:
If the candle closes below the band and RSI is oversold, a green triangle will be painted on the bottom of the candle, suggesting a buying opportunity
Why are the band painted with different shades?
Different shades of red and green identify the relationship between the price and its moving averages.
When the price is below the band and the price action is a downtrend, the band will be painted purple.
When the price is above the band and the price action is an uptrend, the band will be painted in dark Green.

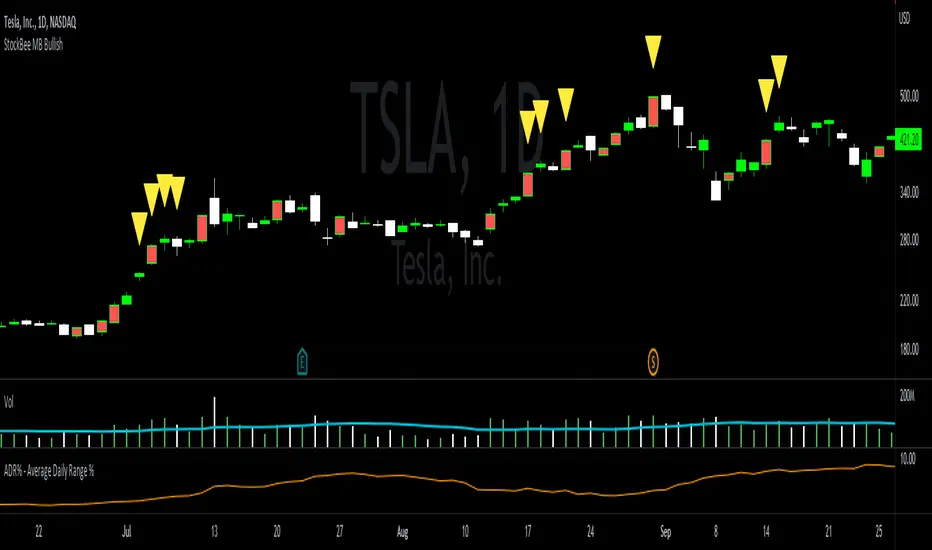
StockBee MB BullishStockBee Bullish Momentum Burst & 20% Plus Study Tool
The Stockbee bullish momentum burst study tool is helpful for practitioners of the momentum burst method who want to easily find historical momentum bursts and/or 20% plus gainers using Trading View. This script finds three specific breakouts that meet the below criteria:
4% Breakouts (Colors Candle Body)
1. Volume of the candle is greater than the previous candle volume.
2. The percent change of candle's price is greater than 4% from the previous candle close.
3. Current candle close is less than 30% from candle's high.
**Users can toggle 4% Breakouts on/off and also change candle body color in settings**
Dollar Breakouts (Colors Candle Body)
1. The change of candle's price is greater than $0.90 from the previous candle close.
2. Current candle close is less than 30% from candle's high.
** Dollar Breakout does not take volume into consideration **
**Users can toggle Dollar Breakouts on/off and also change candle body color in settings**
20% Plus Gainers (Displays Yellow Triangle Icon)
1. The change over five candles is greater than 20%.
**Users can toggle 20% plus label on/off, cannot change the label color**
This script also filters out any candle that gaps up and breaks down with a close above 4% the previous candle (Eliminates gap-ups that fade). This tool is meant to find and filter possible candidates. Not every marked candle is a great momentum burst trade. Users can look at 4% Breakouts, Dollar Breakouts, 20% Plus Gainers individually or any combination of the three.
This is helpful for Trading View users trading this specific setup.
MACD Multiple AlertsThis script help traders to catch bullish and bearish momentum. It creates an alert for 40 altcoins based on the MACD cross over and cross under.
The MACD input are adjustable in the settings and you can choose your favorite assets.
Simply add this indicator to the chart wait that if finish to load and then create an alert on the time frame of your choice.
Enjoy your trading
F_rank_01

Indicator Direction Table With Bullish & Bearish LabelsINDICATOR DIRECTION TABLE WITH BULLISH AND BEARISH LABELS
This is a table that shows the bullish, bearish or neutral trend for nine different popular indicators. Each indicator label will change color in real time to make you aware of each change in direction. This way you don’t have to read and analyze a bunch of different indicators constantly and you can focus on price action instead.
Look for the entire table to turn green or red before taking positions.
You can also set alerts for when the entire table of indicators is bullish or bearish.
The indicator settings allow customization of indicator lengths & values, table position and turning the indicator table on or off.
The length and other values for each indicator can be customized to suit your preferences, but by default all of them are set to the normal default settings that Tradingview supplies the indicators with. Typically 14 as the length.
The indicators used in this table are as follows:
MACD - Moving Average Convergence Divergence
Stochastic RSI - Stochastic Relative Strength Index
Vortex - Vortex Indicator
Momentum - Momentum Indicator
RSI - Relative Strength Index
PSAR - Parabolic Stop & Reverse
DMI - Directional Movement Index
MFI - Money Flow Index
Fisher - Fisher Transform Price Action
***MARKETS***
This indicator can be used as a signal on all markets, including stocks, crypto, futures and forex.
***TIMEFRAMES***
This indicator table can be used on all timeframes.
***TIPS***
Try using numerous indicators of ours on your chart so you can instantly see the bullish or bearish trend of multiple indicators in real time without having to analyze the data. Some of our favorites are our Auto Fibonacci, Directional Movement Index + Fisher Price Action, Volume Profile With Buy & Sell Pressure, Auto Support And Resistance and Money Flow Index in combination with this indicator direction table. They all have unique features to help you make better and faster trading decisions.

Money Flow Index With Bullish & Bearish SignalsMONEY FLOW INDEX WITH BULLISH AND BEARISH SIGNALS
Money Flow Index shows whether money is coming into the market or going out of the market. This can be used to gauge market sentiment and whether people are buying or selling at the current price.
***HOW TO USE***
If the MFI line is green, it is above the 50 line and in a bullish trend.
If the MFI line is red, it is below the 50 line and in a bearish trend.
If the background color is green, Money Flow is in a bullish trend, holding above the 50 line.
If the background color is red, Money Flow is in a bearish trend, holding below the 50 line.
If the MFI is above the 75 level it indicates a possible top or overbought conditions.
If the MFI is below the 25 level it indicates a possible bottom or oversold conditions.
***BULLISH/BEARISH LABELS***
There is also a label on the right side that tells you whether the overall trend is bullish or bearish, if there is a possible bottom or top and if the current money flow index is going up or down. This table updates in real time and changes colors so you can get an easy, quick interpretation of the current money flow without having to look at the data so you can make faster decisions on whether to enter or exit a trade. The flashing from red to green or the opposite also grabs your attention so you know immediately if there is a change in trend. The table changes colors in sync with the MFI line and it's trends and bottom/top areas. Green means money is coming in. Red means money is going out. Blue means a neutral amount of money flow.
***MARKETS***
This indicator can be used as a signal on all markets, including stocks, crypto, futures and forex.
***TIMEFRAMES***
This Money Flow Index indicator can be used on all timeframes.
***TIPS***
Try using numerous indicators of ours on your chart so you can instantly see the bullish or bearish trend of multiple indicators in real time without having to analyze the data. Some of our favorites are our Auto Fibonacci, DMI, Momentum, Auto Support And Resistance and Volume Profile in combination with this Money Flow Index. They all have real time Bullish and Bearish labels as well so you can immediately understand each indicator's trend.

Lankou VS BTC all
/!\ To make it work well use -> pin at new right scale
This script displays the comparison with BTCUSDT
it permits to see if an asset is gaining value against BTC, and fastly scan USDT asset to determine if they are bullish
It works for ANY asset, as it's dividing it's price by the BTCUSDT one

Bias Pivot PointA simple indicator that uses Pivot Points as a filter and to generate a Directional Bias .
How to use this indicator?
1. Directional Bias
Bullish => Closing Price > Pivot Point
Bearish => Closing Price < Pivot Point
2. Support / Resistance
Each Pivot Points can be used as Support or Resistance
3. Take Profit Targets
Each Pivot Points can be used as targets for taking profit

20 SMA based Bull/Bear sentiment indicatorThis script is only doing one thing, plots the 20 SMA and based on whether the asset's price is above or below of the SMA it changes the color of the SMA and the background's color.
Helping it to visualize whether from the 20 SMA's point of view we are in a Bull or a Bear trend.
I created this because I myself use this SMA with Bitcoin on the weekly time frame to identify the macro trend on the weekly.
IMO this is a good crypto market sentiment indicator.

Hourly Bias on BTC in Bullish USA Session “Green Eagle”Name: Hourly Bias on BTC in Bullish USA Session
Category: Hourly Bias
Operating mode: Spot, only long
Trades duration: Intraday, 11 bars
Timeframe: 1H
Suggested usage: When the market is compressed, USA session has a bullish bias.
Entry: enter Long at 15:00 on specific days of the week. There is a volatility filter based on ATR which identifies compression.
Exit: exit at a pre-defined time at 01:00
Usage:
⁃ It can be useful to use alerts or webhooks to automate this strategy.
⁃ This is a core system that can be improved in different ways (e.g. Stop-loss, take-profit, position sizing) or studying more the behaviour in the specific days of the week or short when is red.
Configuration:
- N/A
Backtesting
⁃ Exchange: BINANCE
⁃ Pair: BTCUSDT
⁃ Timeframe: 1H
⁃ Fee 0.075%
⁃ Slippage 2
- Start : 2019-01-06
We decided to release this free BTC strategy.
How you or we can improve? Source code is open so share your ideas!

Naked Bar Upward ReversalAMEX:SPY
The Naked Bar Upward Reversal is a three bar candlestick pattern with an inside candle as a entry point. This pattern is bullish since it has a candle closing red from the previous candle; the most bearish pattern possible. The following inside candle is a reversal of its previous candle with an open above the previous candle's close. Look to buy the next open above the inside candle's close.
This is a bullish reversal pattern and should be used in this context. Successful entries are found in corrections along an upward trend, or buying into a dip. Performance drops when the pattern appears at tops. To improve profitability, use a cluster of evidence to enhance the performance of this pattern. The intended time frame is within the daily and weekly.

How Old Is this Bull Run Getting? Check MA Test Bars SinceThere are many price-based techniques for anticipating the end of a move. However, the simple passage of time can also help because bull markets don’t last forever. While old age doesn’t necessarily cause investors to sell, a reversal becomes more likely the longer a trend lasts.
So, how long have prices been going up? There are various ways to measure that. Our earlier script, MA streak , offered one solution by counting the number of bars that a given moving average has been rising or falling.
Today’s script takes a different approach by counting the number of candles since price touched or crossed a given moving average. It tracks the 50-day simple moving average (SMA) by default. It can be adjusted to other types like exponential and weighted with the AvgType input.
In the chart above, Bars Since MA Test was adjusted to use the 200-day SMA. Viewing the S&P 500 with this study helps put the current market into context.
We can see that prices last touched the 200-day SMA 386 sessions ago (June 29, 2020). That’s relatively long based on history, but not unprecedented. For example, the indicator was at 407 in February 2018 as the market pulled back. It also hit 475 in October 2014 (following the breakout above 2007 highs).
Additionally, the S&P 500 is nearing the record of the 1990s bull market (393 candles on July 12, 1996).
Before that, you have to look all the way back to the 1950s, when it twice peaked at 627.
The conclusion? The current run without a test of the 200-day SMA is above average, but not yet record-setting. It may be interesting to watch as earnings season approaches and the Federal Reserve looks to tighten monetary policy.
TradeStation is a pioneer in the trading industry, providing access to stocks, options, futures and cryptocurrencies. See our Overview for more.
Important Information
TradingView is not affiliated with TradeStation Securities Inc. or its affiliates. TradeStation Securities, Inc., TradeStation Crypto, Inc., and TradeStation Technologies, Inc. are each wholly owned subsidiaries of TradeStation Group, Inc., all operating, and providing products and services, under the TradeStation brand and trademark. When applying for, or purchasing, accounts, subscriptions, products and services, it is important that you know which company you will be dealing with. Please click here for further important information explaining what this means.
This content is for informational and educational purposes only. This is not a recommendation regarding any investment or investment strategy. Any opinions expressed herein are those of the author and do not represent the views or opinions of TradeStation or any of its affiliates.
Investing involves risks. Past performance, whether actual or indicated by historical tests of strategies, is no guarantee of future performance or success. There is a possibility that you may sustain a loss equal to or greater than your entire investment regardless of which asset class you trade (equities, options, futures, or digital assets); therefore, you should not invest or risk money that you cannot afford to lose. Before trading any asset class, first read the relevant risk disclosure statements on the Important Documents page, found here: www.tradestation.com .

LoTek - Bull Market Support Band w ProjectionsThis indicator will allow you to enter a future price change, either positive or negative, and see how that would affect the Bull Market Support Band.
The BMSB consists of the 21 EMA and the 20 SMA on the weekly timeframe. Legend has it, as long as you are above this band, BULL MARKET'S ON BABY! If not... then, watch out below....
Note: Price change is in percentage. 100 = 100%, 5 = 5% 0.25 = 0.25%

RSI Average Swing BotThis is a modified RSI version using as a source a big length(50 candles) and an average of all types of sources for candle calculations such as ohlc4, close, high, open, hlc3 and hl2.
In this case we are going to use a 0-1 scale for an easier calculation, where 0.5 is going to be our middle point.
Above 0.5 we consider a bullish possibility.
Below 0.5 we consider a bearish possibility.
I made a small example bot using that initial logic, together with 2 exit points for long or short positions.
If there are any questions, let me know !

NSDT Bearish-Bullish CandlesThis is another interesting take on candlesticks . These Bearish-Bullish Candles do not show the wicks. Instead, the upper wick is made into a Red body and the lower wick is made into a Green body. If you match the candle body color in the chart settings (or turn off the candles completely), you get a unique way of seeing how Bearish or how Bullish a candle is because the wick will now match the body size and color.
This indicator is very similar to our NSDT Special High-Low Candles.

MTF Bullish/Bearish IndicatorThe script plots a bullish/bearish indicator by evaluating a variety of moving averages for a security across multiple timeframes. It's derived from built in Technical Analysis indicator published by TradingView. The result of evaluation is plotted on the chart in green light/red light format in a configurable location.
evaluated moving averages include
- SMA 10, 20, 30, 50, 100, 200
- EMA 10, 20, 30, 50, 100, 200
- Hull MA 9
- VWMA 20
- Ichimoku Cloud
moving averages are evaluated at chart timeframes and 5 min, 15 min, 30 min, 120 min, 240 min, and daily by default but can be customized.

Macd Divergence + MTF EMA MACD Divergence + Multi Time Frame EMA
This Strategy uses 3 indicators: the Macd and two emas in different time frames
The configuration of the strategy is:
Macd standar configuration (12, 26, 9) in 1H resolution
10 periods ema, in 1H resolution
5 periods ema, in 15 minutes resolution
We use the two emas to filter for long and short positions.
If 15 minutes ema is above 1H ema, we look for long positions
If 15 minutes ema is below 1H ema, we look for short positions
We can use an aditional filter using a 100 days ema, so when the 15' and 1H emas are above the daily ema we take long positions
Using this filter improves the strategy
We wait for Macd indicator to form a divergence between histogram and price
If we have a bullish divergence, and 15 minutes ema is above 1H ema, we wait for macd line to cross above signal line and we open a long position
If we have a bearish divergence, and 15 minutes ema is below 1H ema, we wait for macd line to cross below signal line and we open a short position
We close both position after a cross in the oposite direction of macd line and signal line
Also we can configure a Take profit parameter and a trailing stop loss
