Harmonic Pattern Educational Volume 0 (Source Code)This indicator was intended as educational purpose only for Harmonic Patterns using XABCD Pattern Tool.
Gartley and Butterfly patterns were ideal patterns explained from The Harmonic Trader written by Scott M Carney.
Some values are further updated later in Harmonic Trading: Volume Three, also by Scott M Carney.
The Harmonic Trader book was also known as Harmonic Trading: Volume Zero.
Usually Bullish Patterns show as "M" shape while Bearish Patterns show as "W" shape.
";" indicates range, example : 1.27;1.618 meaning that value between 1.27 to 1.618.
Indikator ini bertujuan sebagai pendidikan sahaja untuk Harmonic Pattern menggunakan XABCD Pattern Tool.
Pattern Gartley dan Butterfly, juga sebagai pattern ideal telah diterangkan dari buku The Harmonic Trader ditulis oleh Scott M Carney.
Beberapa nilai kemudiannya telah dikemaskini dalam Harmonic Trading: Volume Three, juga oleh Scott M Carney.
Buku The Harmonic Trader book juga dikenali sebagai Harmonic Trading: Volume Zero.
Kebiasaanya Bullish Pattern tunjuk sebagai bentuk "M" manakala Bearish Pattern tunjuk sebagai bentuk "W".
";" menunjukkan range, contoh : 1.27;1.618 bermaksud nilai 1.27 hingga 1.618.
Indicator features :
1. List XAB=CD patterns including ratio and reference page.
2. For desktop display only, not for mobile.
Kemampuan indikator :
1. Senarai XAB=CD pattern termasuk ratio and rujukan muka surat.
2. Untuk paparan desktop sahaja, bukan untuk mobile.
FAQ
1. Credits / Kredit
Scott M Carney, The Harmonic Trader
2. Pattern and Chapter involved / Pattern dan Bab terlibat
Bullish Ideal Gartley - Page 160
Bearish Ideal Gartley - Page 171
Bullish Ideal Butterfly - Page 194
Bearish Ideal Butterfly - Page 204
3. Code Usage / Penggunaan Kod
Free to use for personal usage but credits are most welcomed especially for credits to Scott M Carney.
Bebas untuk kegunaan peribadi tetapi kredit adalah amat dialu-alukan terutamanya kredit kepada Scott M Carney.
Bullish (M) / Bearish (W) Ideal Gartley
Bullish (M) / Bearish (W) Ideal Butterfly
ابحث في النصوص البرمجية عن "BULL"

Percentage Oscillator SwingThe percentage price oscillator (PPO) is a technical momentum indicator.
It shows the relationship between the close of a candle and the highest/lowest point with a specific lenght in percentage terms.
Rules
The higher percentage on the values upwards, compared to those downwards, the higher the power of the bull trend.
The higher percentage on the values downwards, compared to those upwards, the higher the power of the bear trend.

BTC > bull market supportPlots the natural log of the price divided by the 20w SMA and 21w EMA, color coded by the Bitcoin price (green if above, red if below). Use this when comparing Altcoins to Bitcoin's performance. Works in daily & weekly timeframes only!

KINSKI ADXThis ADX indicator (Average Directional Index) tries to estimate the strength of a trend. The Average Directional Index is derived from the positive (+DI) and the negative directional indicator (-DI). The direction of movement is determined by comparing the highs and lows of the current and past periods.
As soon as the indicator determines a trend strength for upward or downward trend, a label is displayed. An upward trend is labelled "Bullish Trend". The downward trend bears the label "Bearish Trend".
The clouds in the background represent the movements of the Average Directional Index High/Low:
Color orange: neutral, uncertain in which direction it is going.
Color green: upward trend
Color red: downward trend
The line represents the average value of the ADX signal:
Color orange: neutral: still uncertain in which direction it is going
Color green / outgoing line: upward trend
Color green / descending line: weakening upward trend
Color red / exiting line: downward trend
Color red / descending line: weakening downward trend
The following configurable options are possible:
"ADX Smoothing
Directional Index Length
Level Range
Level Trend

Bear & Bull Zone Trend AlertsThis script was requested based on what I previously had in my other scripts.
I did do some tweaks based on some assumptions of what I think it will be used for.

engulfing bullishengulfin bullish
The support and resistance lines of the previous candle are drawn. You can choose the lines in any length you want

Decomposed Average True RangeThis simple script decomposes the value of the Average True Range into a bullish component and a bearish component .
The script supports two plotting methods; Mirrored and Two Lines . If Mirrored is chosen, the indicator plots the bullish component as a positive number, and the bearish component as a negative number. If Two Lines is chosen, the indicator plots two lines, both of positive values. It is the same data, just visualized differently.
Side note: This is very similar to how the strength (average gain) part in the Relative Strength Index calculation works. However, the RSI uses the realized range (close - previous close) rather than true range. If we were to use the bullish component of the ATR as the average bullish gain part in the RSI calculation, and the bearish component of the ATR as the average bearish gain part in the RSI calculation, we would get very similar (but not equal) results to the standard RSI. This shows how the ATR and the RSI are related to each other.

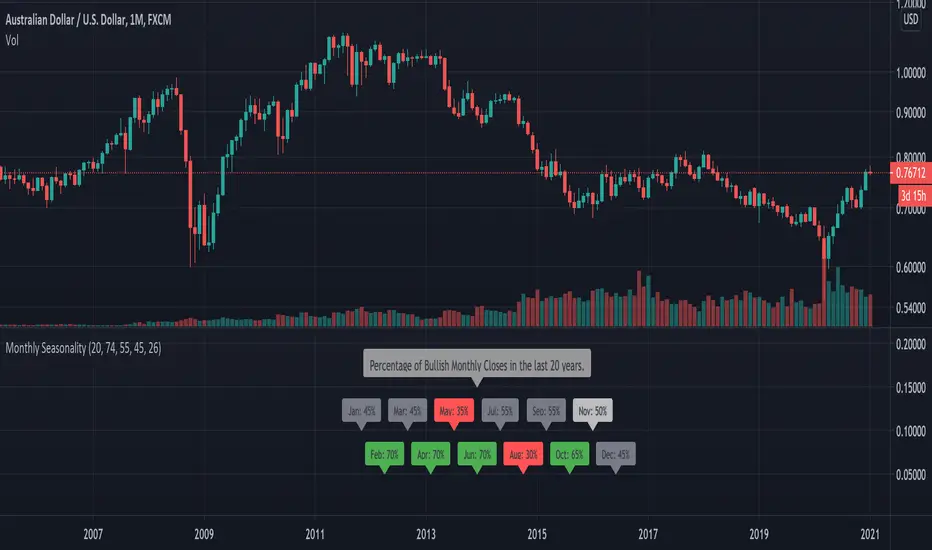
Monthly SeasonalitySimple indicator designed as filter so you can easily see how the currency or asset performed during each month historically.
Can used to identify a possible month to enter or exit a trade in. For best results use in combination with another indicator or candle pattern to signal an entry in a historically bullish month
*This indicator is designed to be used only on the monthly chart.
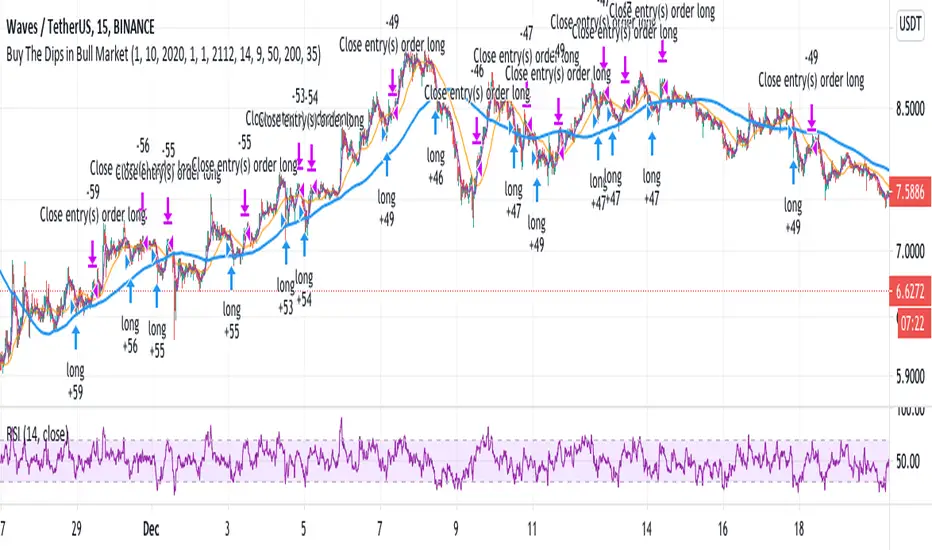
Buy The Dips in Bull Market (by Coinrule)During a Bull market, beating the market, it's challenging. Trading strategies that buy the dips represent one of the best approaches to surf the trend and optimize the returns.
The main obstacle is to gauge the dip's magnitude properly and set up the take profit level accordingly. The RSI is an excellent tool to catch price drops as it adjusts the entry to the asset's current volatility. Nevertheless, using the RSI as an indicator for exit is not an optimal solution in trending markets as it may end up with two scenarios:
The price reverts before reaching overbought conditions. That is the case when the trend is not that strong at that moment. Leaving the position open could result in missed profit opportunities.
The price rebounds strongly, leading the RSI quickly in overbought conditions too soon so that the strategy sells too early.
One interesting option is to combine a trigger based on the RSI to catch the dip and then use two moving averages to spot the right time to seel when the price is entirely back on-trend.
The Setup
The entry-signal comes when the RSI is lower than 35 and the MA9 is above the MA200, indicating that the asset is currently in an uptrend.
The sell-signal comes when at the same time, the price is above the MA9, and the MA9 is above the MA50.
This setup was optimized on the 15-min time frame after over 150 backtests.
A trading fee of 0.1% is taken into account. The fee is aligned to the base fee applied on Binance, which is the largest cryptocurrency exchange.
Booming Bull 15 Min StrategyBooming Bull 15 Min strategy
Conditions
First 15 min candle high-low must be less than .75%
Next candle is crossing either high or low

[SCL] True Market StructureSee market structure at a glance with Higher Highs and Lower Lows. Bullish/Bearish/Ranging market bias is automatically derived. Optionally get alerted for breaks in market structure. Uses true Local Highs/Lows instead of simply the highest/lowest "pivot" for x bars. Can be useful as a support for learning market structure or for alerts for a change in structure while you're not at the computer.

RSI + MFI - Crypto Bull and Bear market A fancy styled version of the RSI (Relative Stochastic Index) + MFI (Money Flow Index) oscillators in order to emphasize buy and sell opportunities.
The 80 and 20 Bands are meant to be used in Bull or Bear markets. Better performing in D timeframes.
The circles represent the cross between RSI and MFI .
Designed for Crypto Markets
Thanks @micheleprandina
Credits:

Pi-cycle top for Bitcoin bull-runUsage
Whenever the Pi-Cycle top conditions are met, the red circle appears at the bottom of the chart. Theoretically, this marks the top of the bull-run in Bitcoin within 3 days.
Credit and overview
Indicator Overview
The Pi Cycle Top Indicator has historically been effective in picking out the timing of market cycle highs to within 3 days.
It uses the 111 day moving average (111DMA) and a newly created multiple of the 350 day moving average, the 350DMA x 2.
Note: The multiple is of the price values of the 350DMA not the number of days.
For the past three market cycles, when the 111DMA moves up and crosses the 350DMA x 2 we see that it coincides with the price of Bitcoin peaking.
It is also interesting to note that 350 / 111 is 3.153, which is very close to Pi = 3.142. In fact, it is the closest we can get to Pi when dividing 350 by another whole number.
It once again demonstrates the cyclical nature of Bitcoin price action over long time frames. Though in this instance it does so with a high degree of accuracy over the past 7 years.
How It Can Be Used
Pi Cycle Top is useful to indicate when the market is very overheated. So overheated that the shorter term moving average, which is the 111 day moving average, has reached a x2 multiple of the 350 day moving average. Historically it has proved advantageous to sell Bitcoin at this time in Bitcoin’s price cycles.
Created By Philip Swift

Donchian WicksNote: This script does not perform well on its own and is meant to inspire other coders, just sharing it because why not :)
The idea is simple, highest only gets calculated for green candles, lowest only gets calculated for red candles. a yellow dot gets created when a candle gets below lowest line and closes bullish, vise versa for red dots.
Hope someone can use it.

BTC - Corrections in Bull-market-This indicator is tailor-made for BTC-
Based on his historical data in bull markets:
If the indicator turns red the probability of a correction is 82% in the short term.
Else the probability of prices continuing climbing is higher.

CCI Bearish BullishCommodities Channel Index and Bearish Harami, Bearish Engulfing, Bullish Harami, Bullish Engulfing.

Combo Backtest 123 Reversal & Elder Ray (Bull Power) This is combo strategies for get a cumulative signal.
First strategy
This System was created from the Book "How I Tripled My Money In The
Futures Market" by Ulf Jensen, Page 183. This is reverse type of strategies.
The strategy buys at market, if close price is higher than the previous close
during 2 days and the meaning of 9-days Stochastic Slow Oscillator is lower than 50.
The strategy sells at market, if close price is lower than the previous close price
during 2 days and the meaning of 9-days Stochastic Fast Oscillator is higher than 50.
Second strategy
Developed by Dr Alexander Elder, the Elder-ray indicator measures buying
and selling pressure in the market. The Elder-ray is often used as part
of the Triple Screen trading system but may also be used on its own.
Dr Elder uses a 13-day exponential moving average (EMA) to indicate the
market consensus of value. Bull Power measures the ability of buyers to
drive prices above the consensus of value. Bear Power reflects the ability
of sellers to drive prices below the average consensus of value.
Bull Power is calculated by subtracting the 13-day EMA from the day's High.
Bear power subtracts the 13-day EMA from the day's Low.
You can use in the xPrice any series: Open, High, Low, Close, HL2, HLC3, OHLC4 and ect...
WARNING:
- For purpose educate only
- This script to change bars colors.

Trend following 3 EMA & Bullish Engulfing indicator for ForexHello world,
I now took the time and puzzled through my own indicator.
The idea:
Main "strategy" uses 3 EMAs (8, 13 and 21) to attain trend-relevant information.
Then we look for bullish & bearing engulfing candles which indicate and pullback into trend direction and a gain in momentum.
Trading purpose:
One could now enter with next open. SL at low/high of engulfing candle. TP at e.g. 1.25 of that candles size.
Security:
There are two security functions build in.
We check for higher timeframe confirmation.
This is done by checking if current trend is in accordance with the EMA of the next higher timframe.
Standard-deviation is 3 on default. Can be changed in the inputs.
Alerts:
Until now there is just one alertcondition programmed.
It alerts for every engulfing candle (bullish and bearish).
More will follow in further versions.
Inputs:
I build in multiple inputs.
- switch on/off the security EMA's
- define security trend backcheck
- define the higher timeframe (15min/1h, 1h/240, 4h/D, D/W)
Happy to take feedback or contr.
All the best,
c4ss10p314

Separated ATR - evoThis script plots two ATR (Average True Range) values, one based on only bullish and the other based on only bearish bars. If the current bar is positive, the negative ATR will use its last known negative bar for the calculation. You can smooth bar directions by using the Heikin Ashi setting.
Use this the same way how you would use the regular ATR indicator, but with the added value of knowing which side of the market has more volatility.

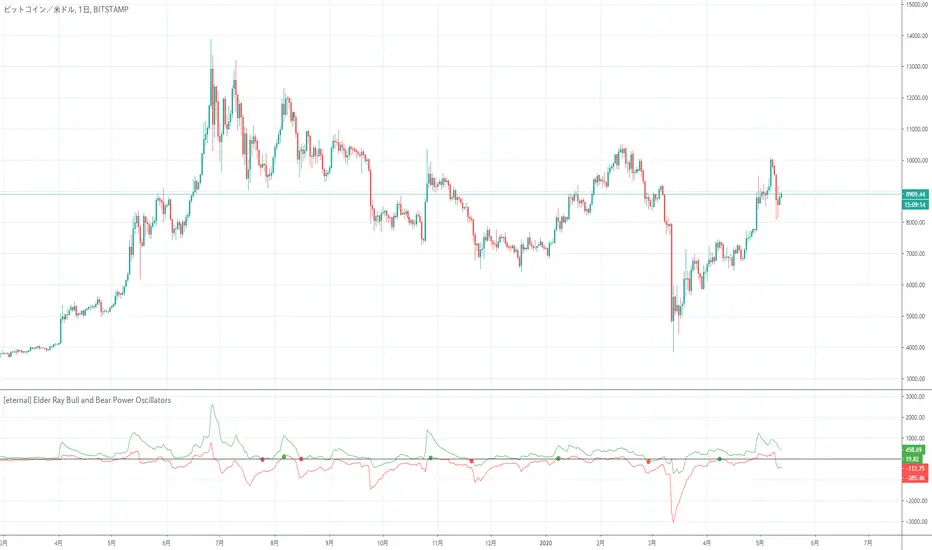
[eternal] Elder Ray Bull and Bear Power OscillatorsElder Ray is an indicator that displays Bull Power and Bear Power at the same time.
This indicator is a modified indicator of Elder Ray.
Setting eternal = False and sommozing Period = 1 will be the same as Elder Ray.
Since the eternal option is a definite signal option, it does not disappear even if the value of close changes if a signal comes out.
In other words, when a signal comes out, it is premised to trade immediately, and the signal comes out at the moment when the bar is updated.
The signal of this indicator seems to be weak in the range market due to its operating principle.
(It seems that the author wanted to try a definite signal)
* It has not been verified whether or not you can finally win, so please use it after individual income and expenditure verification.
Elder RayはBull Power, Bear Powerを同時に表示したインジケーターです。
このインジケーターはElder Rayを改造したインジケーターです。
eternal = False, sommozing Period = 1に設定すると Elder Rayと同じものになります。
eternal オプションは確定シグナルオプションなので、シグナルが出ればcloseの値が変化しても消えることはないです。
つまり、シグナルが出れば即座に取引する前提になっていて、シグナルが出るタイミングはバーが更新した瞬間です。
このインジケーターのシグナルは動作原理上レンジ相場に弱いと思われます。
(作者は確定シグナルを試してみたかったらしい)
※最終的に勝てるかは未検証ですので、個人で収支検証後、使用をお願いします。
Buy the dip in Bull Market by BensonBuy the dip in Bull Market by Benson
This indicators is used for showing buying timing in bull market, buy BTC when the index is below 0.
牛市作多指標 By Benson
在指標下穿零軸時買入 BTC


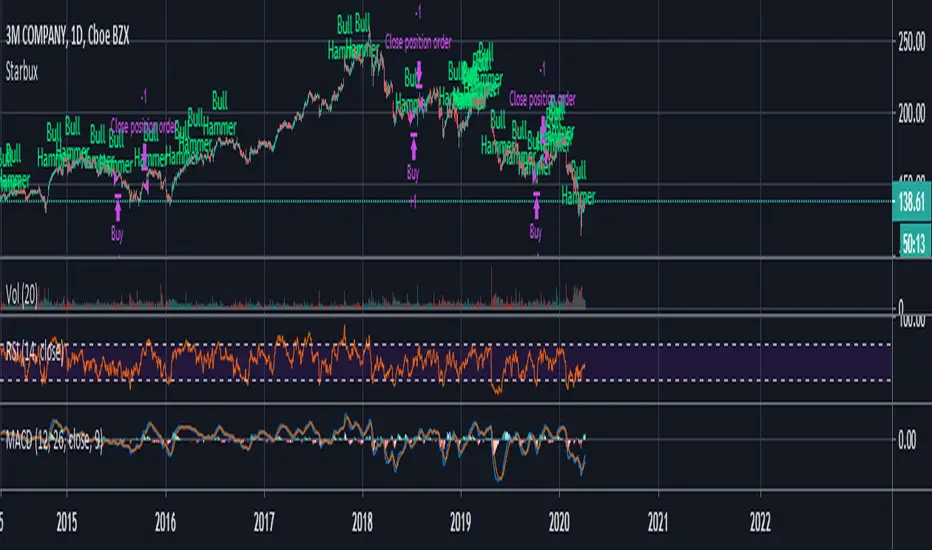
StarbuxI made this in starbucks .
Bullish hammer trading signal algorithm
using MACD for trend determination and holding period.