Bull MountainsAre you a BEAR?
Then get out of here!
This indicator is only for long movements, its reading is simple and if you use it correctly it will give you very good results, the components are:
The highest quality configuration is as follows:
It is not necessary that all the components are aligned, the appearance of the upper mountain on the lower mountain is already a good sign, but if you add some seasoning more the soup will be better =)
Note: once the position is taken, it is the trader's responsibility to manage it. INSTRUMENTS WITH REAL VOLUME ARE REQUIRED FOR THIS INDICATOR.
tip: what would happen if you look for the signal in an upper frame and then look for an input in a lower frame? mmmmm....
tip: play with the 'Length' setting and see what happens
Bull a thumbs up please!
I wish you many greens !!
ابحث في النصوص البرمجية عن "BULL"

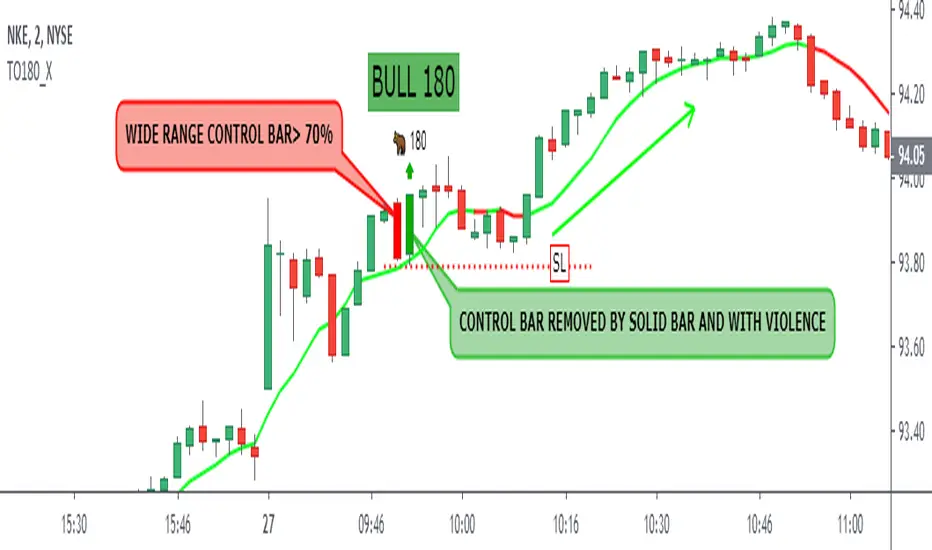
Bull Bear 180 by Oliver VelezThis script detects an event created by Oliver Velez is called Bull / Bear 180, in the following images the event is detailed:
- The size of the control bar can be set compared to a number of previous bars
- The minimum % of the control bar body can be set
- You can filter by trend
- Possibility of seeing fast and slow media with direction detection and color change
- Various graphic settings
- Event alerts
To enjoy!
A thumbs up if you like me!
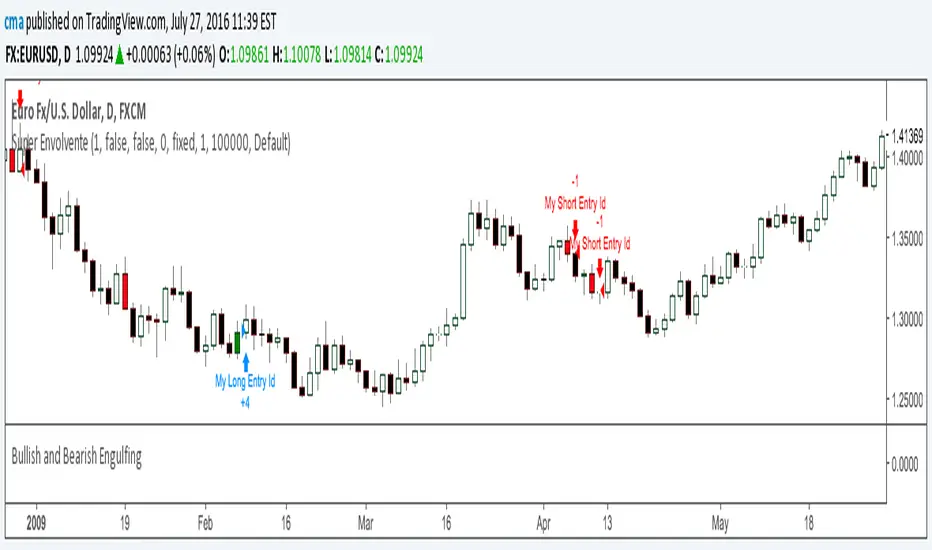
Bullish Engulfing Backtest This is a bullish reversal pattern formed by two candlesticks. Following a downtrend,
the first candlestick is a down candlestick which is followed by an up candlestick
which has a long real body that engulfs or contains the real body of the prior bar.
The Engulfing pattern is the reverse of the Harami pattern.
WARNING:
- For purpose educate only
- This script to change bars colors.

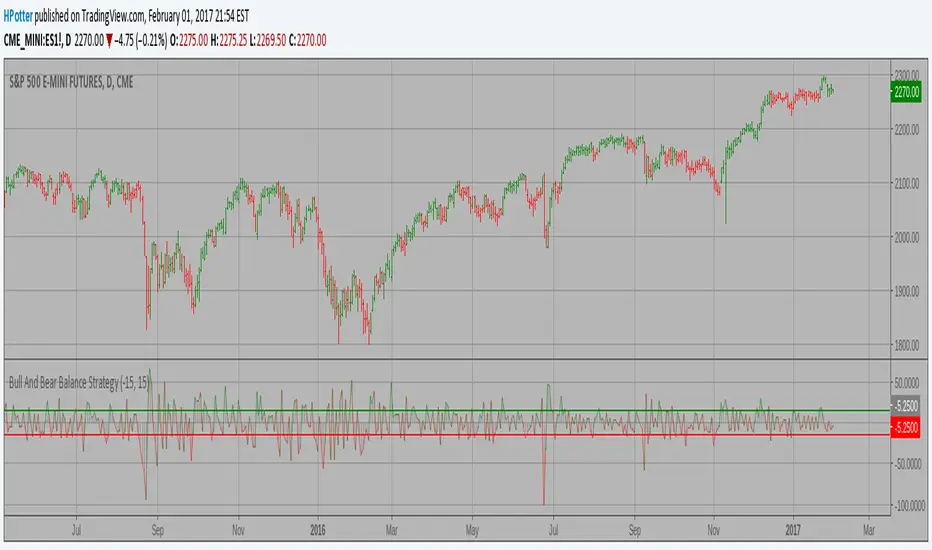
Bull And Bear Balance Strategy Backtest This new indicator analyzes the balance between bullish and
bearish sentiment.
One can cay that it is an improved analogue of Elder Ray indicator.
To get more information please see "Bull And Bear Balance Indicator"
by Vadim Gimelfarb.
This modified strategy backtest from HPotter

Bull And Bear Balance Strategy This new indicator analyzes the balance between bullish and
bearish sentiment.
One can cay that it is an improved analogue of Elder Ray indicator.
To get more information please see "Bull And Bear Balance Indicator"
by Vadim Gimelfarb.
Bullish and Bearish Engulfing StrategyI've been trying to put a stop loss in the High or Low of the last second bar after I open a position but in this example the only way to close it, is with the opposite action. Does anyone know how to put a stop loss and order with just stop loss and close when there is a bullish or bearish engulfing bar?

Bullish and Bearish EngulfingIndicator that changes the bar's color to green if there is a Bullish Engulfing or Red if there a Bearish Engulfing Patterns.

Bullish and Bearish EngulfingIndicator that changes the bar's color to green if there is a Bullish Engulfing or Red if there a Bearish Engulfing Patterns.
Madrid Bull/Bear TerritoryThis study displays a background in four colors, lime, green, red, maroon, lime = Bull Territory, red = Bear Territory, green = possible reversal to Bear Territory, maroon = possible reversal to Bull Territory.
Trading with the basic rule, go long on a Bull Market and short a Bear Market.
This study can be used inside the main window, or by unmerging/merging it can be used as a standalone or in combination with other indicators.
The parameters defined by default reduce choppiness and false signals, but just like any other indicator, there is a trade off between fast response and choppiness. The smaller the parameters the faster response, but the more choppiness.
This indicator is built using three EMA's, two (the bigger ones) are used to define the trend direction, and the fastest one is used as a signal, when the signal breaks out the trend indicators to the downside we're in Bear Market, when the signal breaks out to the upside, we're in Bull Market, any thing in between is either a trend reversal or trend continuation.
Momentum indicators and price pattern analysis are recommended to determine the direction of the trend.

Bullish Engulfing automatic finding scriptHi
Let me introduce my Bullish Engulfing automatic finding script.
This is a bullish reversal pattern formed by two candlesticks. Following a downtrend,
the first candlestick is a down candlestick which is followed by an up candlestick
which has a long real body that engulfs or contains the real body of the prior bar.
The Engulfing pattern is the reverse of the Harami pattern.

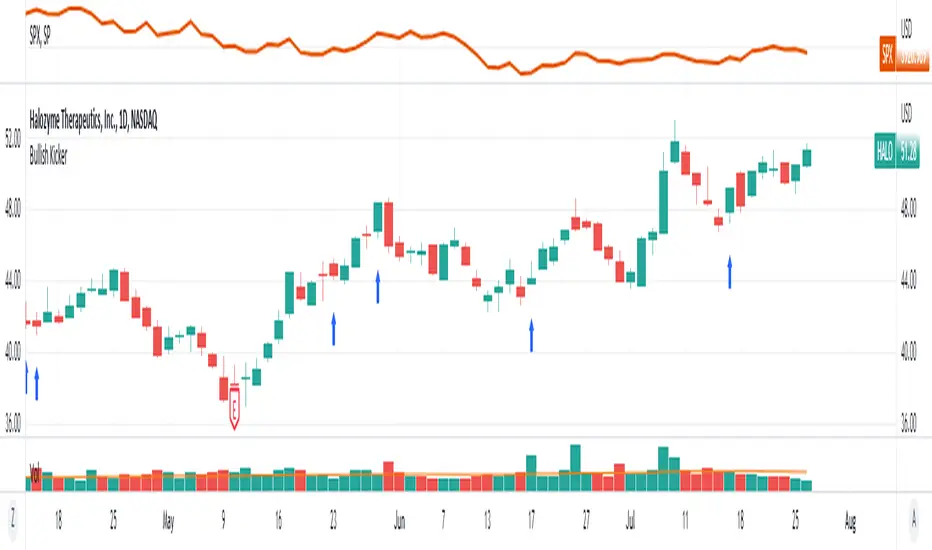
Bullish KickerIdentify bullish kicker candles on the chart. A bullish kicker candle occurs when the opening price is above the body of the previous candle. The previous candle must close lower than the open to qualify.
Indicator Settings
You can chose which shape and color to plot when a kicker candle occurs, as well as placement above, below or in a separate pane.
Bullish Kickers are indicated by blue arrows on the chart
Bullish and Bearish by NicolErazoFThis indicator changes the color of the candlesticks when there’s a change in the trend to the rising or falling trend.
BEARISH ENGULFING: Yellow candlestick. It is an engulfing falling trend reversal; you must make a sell decision.
BEARISH HARAMI: White candlestick. Indicates a possible falling trend change, you must be alert for a possible sale.
BULLISH ENGULFING: Black candlestick. It is a change in the engulfing rising trend, you must make a purchase decision.
BULLISH HARAMI: Blue candlestick. Indicates a possible rising trend change, you should be alert for a possible purchase.
On the chart, you can see the 4 candles, on September 11 the black candle appears indicating a change in the uptrend. But today, the white candle is seen, which appears on September 8, indicating a rebound with a possible change in trend to bearish.
Previous days, on August 26, you see the blue candle with a possible change in the upward trend, which then, on August 28, a yellow candle appears with a change in the downward trend.
The Engulfing indicator (yellow and black) says that the candle has an engulfing change that is radical.
On the other hand, the Harami (blue and white) indicates a possible change in trend that must be previously analyzed.
Harami candles are smaller than Engulfing candles, since Harami in a Japanese term that means pregnancy, where the previous candle is the woman and the next candle is the baby.
___________________________________________________________________________
ESPAÑOL
Este indicador cambia las velas de color cuando ocurre un cambio de tendencia ALCISTA o BAJISTA
BEARISH ENGULFING: Vela de color amarillo. Es una cambio de tendencia bajista envolvente, debes tomar una decisión de venta.
BEARISH HARAMI: Vela de color blanco. Indica un posible cambio de tendencia bajista, debes estar alerta para una posible venta.
BULLISH ENGULFING: Vela de color negro. Es un cambio de tendencia alcista envolvente, debes tomar una decisión de compra.
BULLISH HARAMI: Vela de color azul. Indica un posible cambio de tendencia alcista, debes estar alerta para una posible compra.
En el gráfico, se pueden ver las 4 velas, el 11 de Septiembre aparece la vela negra que indica un cambio de tendencia alcista. Pero hoy, se ve la vela blanca, que aparece el 8 de septiembre, indicando un rebote con un posible cambio de tendencia a bajista.
Días anteriores, el 26 de Agosto, se ve la vela azul con un posible cambio de tendencia alcista, que luego, el 28 de agosto aparece una vela amarilla con cambio de tendencia bajista.
El indicador Engulfing (amarillo y negro) dice que la vela tiene un cambio envolvente que es radical.
En cambio, el Harami (azul y blanco) indica un posible cambio de tendencia que debe ser previamente analizado.
Las velas Harami son más pequeñas que las Engulfing , ya que Harami en un término japonés que significa embarazo, en donde la vela anterior es la mujer y la vela siguiente es el bebé.

Bullish Piercing ScannerA piercing pattern is known in technical analysis to be a potential signal for a bullish reversal. The formation in its strictest form is rather rare, but tends to perform better the longer the downtrend in front of it. When technical studies such as RSI, Stochastic or MACD are showing a bullish divergence at the same time a piercing pattern appears, it strengthens the likelihood that this two-day pattern is meaningful.
This is a two-candle pattern. The previous candle must be bearish, the recent candle must open below the close of the previous candle, the recent candle must close above the middle of the previous candle. You can adjust the closing and opening gap between the two candles within this scanner's settings (price).

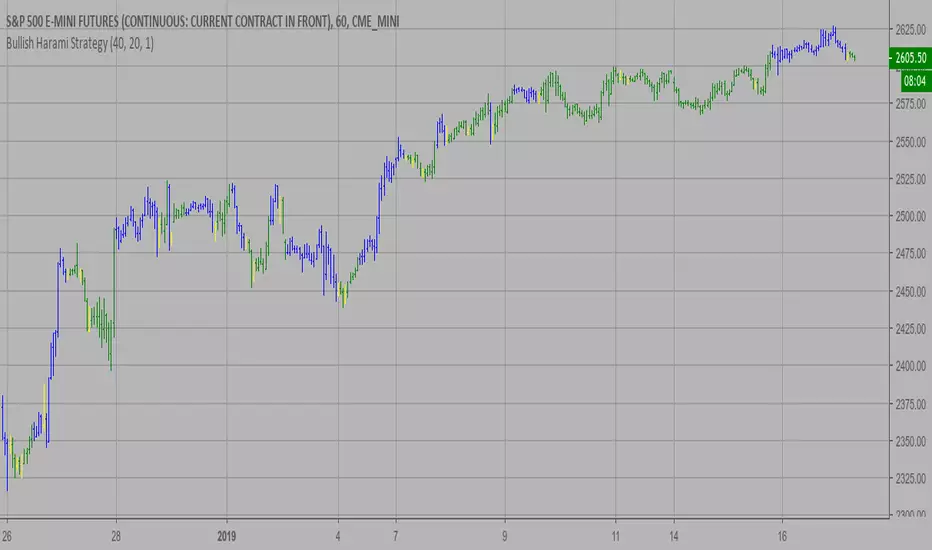
Bullish Harami Backtest This is a bullish reversal pattern formed by two candlesticks in which a small
real body is contained within the prior session's unusually large real body.
Usually the second real body is the opposite color of the first real body.
The Harami pattern is the reverse of the Engulfing pattern.
WARNING:
- For purpose educate only
- This script to change bars colors.

Bullish Harami Strategy This is a bullish reversal pattern formed by two candlesticks in which a small
real body is contained within the prior session's unusually large real body.
Usually the second real body is the opposite color of the first real body.
The Harami pattern is the reverse of the Engulfing pattern.
WARNING:
- This script to change bars colors.
Bullish Engulfing Strategy This is a bullish reversal pattern formed by two candlesticks. Following a downtrend,
the first candlestick is a down candlestick which is followed by an up candlestick
which has a long real body that engulfs or contains the real body of the prior bar.
The Engulfing pattern is the reverse of the Harami pattern.
WARNING:
- This script to change bars colors.

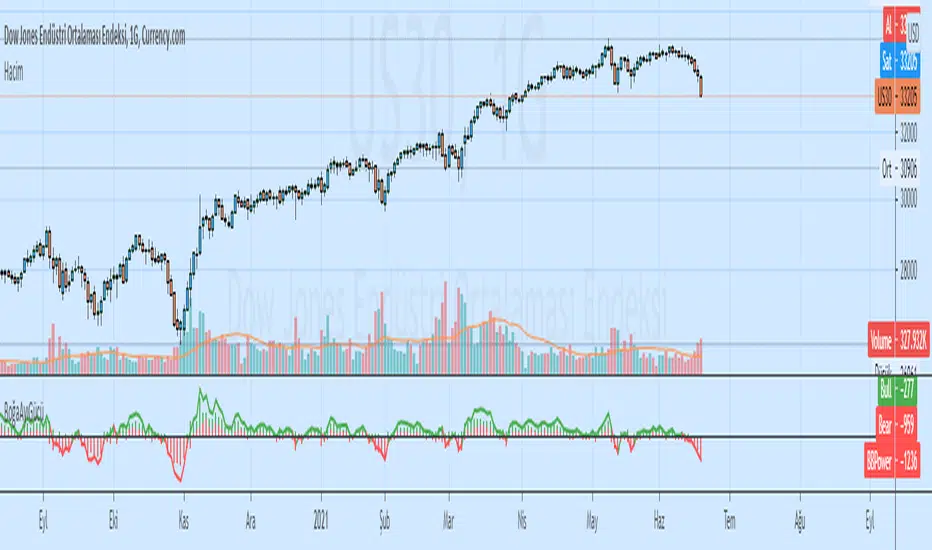
Elder Ray Bull and Bear Power OscillatorsElder Ray Bull and Bear Power Oscillators
Tradingview Screener Bull Bear Power(BBPOWER)
OVERVIEW
The Bull and Bear Power oscillators developed by Dr Alexander Elder attempt to measure the power of buyers (bulls) and sellers (bears) to push prices above and below the consensus of value. The primary principles on which Elder based the oscillator are:
The highest price displays the maximum buyer’s power within the day.
The lowest price displays the maximum seller’s power within the day.
The moving average can be construed as a price agreement between buyers and sellers for a given time period.
The Bulls/Bears power balance is important since changes in this balance can signal the early stages of a potential trend reversal.
CALCULATION
Elder uses a 13-day exponential moving average (EMA) to indicate the consensus market value.
Bull Power is calculated by subtracting the 13-day EMA from the day’s high.
Bear Power is derived by subtracting the 13-day EMA from the day’s low.
TRADING WITH THE ELDER RAY BULL AND BEAR POWER OSCILLATORS
BULL POWER
Where a currency uptrend is sustained to the point that maximum prices move above the EMA the Bull Power histogram will be greater than zero. As price maximums accelerate to greater levels (above the EMA) during the rising trend histogram bars will increase in height above the zero line showing the increased buying strength during the period.
BEAR POWER
Where a currency downtrend is sustained to the point that minimum prices move below the EMA the Bear Power histogram will be less than zero. As price minimums accelerate to lower levels (below the EMA) during the falling trend histogram bars will increase in height below the zero line showing increased selling strength during the period.
TRADING SIGNALS
It is important for traders to use the Elder Ray oscillators in conjunction with the EMA overlay over the price chart (typically as per period being analysed) to give additional context to the signals. Sell signals are given if Bull Power is above zero and there is a bearish divergence in the Bull Power histogram or if the Bull Power histogram is above zero and falling.
Buy signals are given if Bear Power is below zero and there is a bullish divergence in the Bear Power histogram or if the Bear Power histogram is below zero and rising. It is extremely important for traders to only trade in the above scenarios if the direction of the trend indicated by the slope of the EMA on the price chart is in the direction of their trade when the signal is given (or shortly after).
Elder ray ( Bull power and bear power combined )Elder-ray is an indicator named for its similarity to x-rays.
It shows the structure of bullish and bearish
power below the surface of the markets. Elder-ray combines a trend-
following moving average with two oscillators to show when to enter
and exit long or short positions.
A moving average reflects the average consensus of value. The high of
each bar reflects the maximum power of bulls during that bar. The low of
each bar marks the maximum power of bears during that bar.
Elder-ray works by comparing the power of bulls and bears during each
bar with the average consensus of value. Bull Power reflects the maximum
power of bulls relative to the average consensus, and Bear Power the max-
imum power of bears relative to that consensus.
When the high of a bar is above the EMA, Bull Power is positive. When
the entire bar sinks below the EMA, which happens during severe de-
clines, Bull Power becomes negative. When the low of a bar is below the
EMA, Bear Power is negative. When the entire bar rises above the EMA,
which happens during wild rallies, Bear Power becomes positive.
The slope of a moving average identifies the current trend of the mar-
ket. When it rises, it shows that the crowd is becoming more bullish; it is
a good time to be long. When it falls, it shows that the crowd is becoming
more bearish; it is a good time to be short. Prices keep getting away from
a moving average but snap back to it, as if pulled by a rubber band. Bull
Power and Bear Power show the length of that rubber band. Knowing the
“Buy low, sell high” sounds good, but traders and investors seem to have
been more comfortable buying Lucent above 70 than below 7. Perhaps they
are not as rational as the efficient market theorists would like us to believe?
Elder-ray gives rational traders a glimpse into what is going on below the sur-
face of the market.
When the trend, identified by the 22-day EMA, is down and bulls are
under water, the rallies back to the surface mark shorting opportunities
normal height of Bull or Bear Power reveals how far prices are likely to get
away from their moving average before returning. Elder-ray offers one of
the best insights into where to take profits—at a distance away from the
moving average that equals the average Bull Power or Bear Power.
Elder-ray gives buy signals in uptrends when Bear Power turns nega-
tive and then ticks up. A negative Bear Power means that the bar is strad-
dling the EMA, with its low below the average consensus of value. Waiting
for Bear Power to turn negative forces you to buy value rather than chase
runaway moves. The actual buy signal is given by an uptick of Bear Power,
which shows that bears are starting to lose their grip and the uptrend is
about to resume. Take profits at the upper channel line or when a trend-
following indicator stops rising. Profits may be greater if you ride the
uptrend to its conclusion, but taking profits at the upper channel line is
more reliable.
Elder-ray gives shorting signals in downtrends when Bull Power turns
positive and then ticks down. We can identify the downtrend by a declin-
ing daily or weekly EMA. A positive Bull Power shows that the bar is strad-
dling the EMA, with its high above the average consensus of value.
Waiting for Bull Power to turn positive before shorting forces you to sell
at or above value instead of chasing waterfall declines. The actual short-
ing signal is given by a downtick of Bull Power, which shows that bulls
are starting to slip and the downtrend is about to resume. Once short, take
profits at the lower channel line or when the trend-following indicator
stops falling, depending on your style.
STOCK EXCHANGE + SILVER BULLET FRAMESThis script is an updated version of the " NY/LDN/TOK Stock Exchange Opening Hours " script.
Objective
Displays global stock exchange sessions (New York, London, Tokyo) with session frames, highs/lows, and opening lines. Includes ICT Silver Bullet windows (NY, London, Tokyo) with configurable shading. Past sessions are frozen at close, ongoing sessions update dynamically until closure, and upcoming sessions are pre-drawn. Fully customizable with options for weekends, labels, padding, opacity, and individual session toggles.
It is designed to help traders quickly interpret market context, liquidity zones, and session-based price behavior.
Main Features
Past sessions (historical data)
• Session Frames:
• Each box is frozen at the session’s close.
• The left edge aligns with the opening time, while the right edge is fixed at the closing time.
• The top and bottom reflect the highest and lowest prices during the session.
• Session Labels:
• Names (NY, LDN, TOK) displayed above the frame, aligned left, in the same color as the frame.
• Opening Lines:
• Vertical dotted lines mark the start of each session.
Ongoing and upcoming sessions (live market)
• Dynamic Session Frames:
• The right edge is locked at the future close time.
• The top and bottom update in real time as new highs and lows form.
• Labels and Lines:
• The session label is visible above the active frame.
• Opening lines are drawn as soon as the session begins.
Silver Bullet Time Windows (ICT concept)
• Highlights key liquidity windows within sessions:
• New York: 10:00–11:00 and 14:00–15:00
• London: 08:00–09:00
• Tokyo: 09:00–10:00
• Silver Bullet zones are shaded with configurable opacity (default 5%).
Customization and Options
• Enable or disable individual sessions (NY, London, Tokyo).
• Toggle weekend display (frames and Silver Bullets).
• Adjust label size, padding, and text visibility.
• Control frame opacity (default 0%).
• Optimized memory management with automatic pruning of old graphical objects.

Bears Bulls Impulse [Loxx]Bears Bulls Impulse, originally known as the the Elder-Ray Index, is a technical indicator developed by Dr. Alexander Elder that measures the amount of buying and selling pressure in a market. This indicator consists of two indicators known as "bull power" and "bear power," which are derived from a 13-period moving average.
Included:
- Various average modes to fine-tune the signal
This is an exact clone of the "Bears Bulls Impulse" MT4 indicator

Bitcoin Bulls and Bears by @dbtrBitcoin 🔥 Bulls & Bears 🔥
v1.0
This free-of-charge BTC market analysis indicator helps you better understand what's going with Bitcoin from a high-level perspective. At a glance, it will give you an immediate understanding of Bitcoin’s historic price channel dating back to 2011, past and current market cycles, as well as current key support levels.
Usage
Use this indicator with any BTCUSD pairs , ideally with a long price history (such as BNC:BLX )
We recommend to use this indicator in log mode, combined with Weekly or Monthly timeframe.
Features
🕵🏻♂️ Historic price channel curve since 2011
🚨 Bull & bear market cycles (dynamic)
🔥 All-time highs (dynamic)
🌟 Weekly support (dynamic, based on 20 SMA )
💪 Long-term support (channel bottom)
🔝 Potential future price targets (dynamic)
❎ Overbought RSI coloring
📏 Log/non-log support
🌚 Dark mode support
Remarks
With exception of the price channel curve, anything in this indicator is calculated dynamically , including bull/bear market cycles (based on a tweaked 20SMA), ATHs, and so on. As a result, historic market cycles may not be 100% accurately reflected and may also differ slightly in between various time-frames (closest result: Monthly). The indicator may even consider periods of heavy ups/downs as their own market cycles, even though they weren’t. Due to its dynamic nature, this indicator can however adapt to the future and helps you quickly identify potential changes in market structure, even if the indicator is no longer updated.
On top of that bullmarket cycles (colored in green) feature an ingrained RSI: the darker the green color, the more the RSI is overbought and close to a correction (darkest color in the chart = 90 Weekly RSI). In comparison with past bull cycles, it helps you easily spot potential reversal zones.
Thanks
Thanks to @quantadelic and @mabonyi which both have worked on the BTC "growth zones" indicator including the price channel, of which I have used parts of the code as well as the actual price channel data.
Follow me
Follow me here on TradingView to be notified as soon as new free and premium indicators and trading strategies are published. Inquire me for any other requests.
Enjoy & happy trading!

Bitcoin Bullish Percent IndexHello Traders,
This is Bitcoin Bullish Percent Index script. First lets talk about what the Bullish Percent Index and how it is calculated:
"The Bullish Percent Index (BPI) is a breadth indicator based on the number of securities on Point & Figure Buy Signals, Developed by Abe Cohen in the mid-1950s. Because a security is either on a P&F Buy or Sell Signal, there is no ambiguity when it comes to P&F charts. This makes BPI a straightforward indicator with clearly defined signals."
The calculation is straightforward and simple: (Number of securities on P&F Buy signals) / (Total number of securities)
Here you can see what the P&F buy signal is:
In this script I choose 40 cryptos that is correlated ( as I see ) with BTC (including BtcUsdt). in the first part the script creates P&F chart for each security and check if there is Buy or Sell signal and sum the buy signals if there is. in the second part it creates P&F chart by using the P&F buy/sell signals coming from the securities P&F chart. because of complicated calculation the script may need a few seconds to load.
in the first part reversal value is 3 by default but you can set different values as reversal. sometimes I got better results with reversal = 5.
in BPI part reversal = 3 is used. so each box represents 2% (each X or O is a box). And this means it takes at least a 6% move in BPI for a reversal. the Bullish Percent Index favors the bulls when above 50% and the bears when below 50%. The bulls have the edge when over 50% of stocks are on a P&F Buy Signal. BPI is also considered overbought when above 70% and oversold when below 30%. BPI can move between 0 and 100.
Because of 40 securities are used in the script and all different prices, it uses Percentage scaling only. it can calculate the Percentage automatically by using the time frame of the chart or you can set it as you wish.
The Signals coming from BPI:
Bull Alert: BPI is below 30% and then forms a new column of X's (rises)
Bear Alert: BPI is above 70% and then forms a new column of O's that decline below 70%.
Bull Confirmed: BPI is on a P&F buy signal and in a column of X's (rising).
Bear Confirmed: BPI is on a P&F sell signal and in a column of O's (falling).
Bull Correction: BPI is on a P&F buy signal, but currently falling (column of O's).
Bear Correction: BPI is on a P&F sell signal, but currently rising (column of X's).
If you are not familiar with Bullish Percent Index you better search it on the net to get more info, you can find a lot of articles and web sites about BPI.
as I remember I developed the script 6-7 months ago and today I had chance to publish it as it was
Enjoy!

[blackcat] L2 Bull Bear Convergence Divergence (BBCD)Level: 2
Background
A bull market is gaining ground and is economically sound, while a bear market is declining and most stocks are depreciating. The actual origins of these terms are unclear, but one reason could be that bulls attack by pulling their horns up while bears attack by brushing their paws down.
Function
L2 Bull Bear Convergence Divergence (BBCD) disclose the convergence divergence of the bull bear as a market opinion indicator. It tells you the opinion of those who are directly involved with the markets. As a trader, understanding how the convergence divergence of the bull bear works can be of great help. I inherited the traditional MACD expression method, and added golden cross (yellow cross) and dead cross (fuchsia cross) prompts, as well as bottom divergence (lime cross) and top divergence (red cross) prompts.
Key Signal
bbd --> bull bear fast line
bbdsupport --> bull bear slow line and support level
bbdgx --> bull bear gold cross in yellow
bbddx --> bull bear dead cross in fuchsia
bbotdiverg --> bull bear bottom divergence alert in lime cross
btopdiverg --> bull bear top divergence alert in red cross
Pros and Cons
Pros:
1. it can help to see the strength change of a trend in time
2. visual bottom and top divergence alerts are provided
Cons:
1. it disclose the strength change better than price change
Remarks
Bull Bear Convergence Divergence (BBCD) is new.
Readme
In real life, I am a prolific inventor. I have successfully applied for more than 60 international and regional patents in the past 12 years. But in the past two years or so, I have tried to transfer my creativity to the development of trading strategies. Tradingview is the ideal platform for me. I am selecting and contributing some of the hundreds of scripts to publish in Tradingview community. Welcome everyone to interact with me to discuss these interesting pine scripts.
The scripts posted are categorized into 5 levels according to my efforts or manhours put into these works.
Level 1 : interesting script snippets or distinctive improvement from classic indicators or strategy. Level 1 scripts can usually appear in more complex indicators as a function module or element.
Level 2 : composite indicator/strategy. By selecting or combining several independent or dependent functions or sub indicators in proper way, the composite script exhibits a resonance phenomenon which can filter out noise or fake trading signal to enhance trading confidence level.
Level 3 : comprehensive indicator/strategy. They are simple trading systems based on my strategies. They are commonly containing several or all of entry signal, close signal, stop loss, take profit, re-entry, risk management, and position sizing techniques. Even some interesting fundamental and mass psychological aspects are incorporated.
Level 4 : script snippets or functions that do not disclose source code. Interesting element that can reveal market laws and work as raw material for indicators and strategies. If you find Level 1~2 scripts are helpful, Level 4 is a private version that took me far more efforts to develop.
Level 5 : indicator/strategy that do not disclose source code. private version of Level 3 script with my accumulated script processing skills or a large number of custom functions. I had a private function library built in past two years. Level 5 scripts use many of them to achieve private trading strategy.
