RSI and Smoothed RSI Bull Div Strategy [BigBitsIO]This strategy focuses on finding a low RSI value, then targeting a low Smoothed RSI value while the price is below the low RSI in the lookback period to trigger a buy signal.
Features Take Profit, Stop Loss, and Plot Target inputs. As well as many inputs to manage how the RSI and Smoothed RSI are configured within the strategy.
Explanation of all the inputs
Take Profit %: % change in price from position entry where strategy takes profit
Stop Loss %: % change in price from position entry where strategy stops losses
RSI Lookback Period: # of candles used to calculate RSI
Buy Below Lowest Low In RSI Divergence Lookback Target %: % change in price from lowest RSI candle in divergence lookback if set
Source of Buy Below Target Price: Source of price (close, open, high, low, etc..) used to calculated buy below %
Smoothed RSI Lookback Period: # of candles used to calculate RSI
RSI Currently Below: Value the current RSI must be below to trigger a buy
RSI Divergence Lookback Period: # of candles used to lookback for lowest RSI in the divergence lookback period
RSI Lowest In Divergence Lookback Currently Below: Require the lowest RSI in the divergence lookback to be below this value
RSI Sell Above: If take profit or stop loss is not hit, the position will sell when RSI rises above this value
Minimum SRSI Downtrend Length: Require that the downtrend length of the SRSI be this value or higher to trigger a buy
Smoothed RSI Currently Below: Value the current SRSI must be below to trigger a buy
ابحث في النصوص البرمجية عن "BULL"

Divergence of DecisionPoint Breadth Swenlin Trading [LazyBear]// This source code is subject to the terms of the Mozilla Public License 2.0 at mozilla.org
// © 03.freeman
//This is indicator from LazyBear is very accurate for stocks and indexes.
//I added some code snippets for spot and draw divergences automatically
//
// @author LazyBear
//
//
Best use with daily time frame.
Enter when a divergence is found (Bull or Bear label) and wait at least a couple of candles before exit.
Next improvement: alerts ready made for webhooks and screener for multiple tickers.
Please use comment section for any feedback.

TMMS OscillatorThe TMMS oscillator (aka “Trading Made More Simpler”) is an indicator made of conditions based on both 2 separated Stochastic and 1 RSI.
Bullish zone is green and bearish one is red. When the histogram is grey, no signals is available at that time.
The indicator has an option to show the current trend of an Hull moving average (ascending or descending curve). When the trend is up, green dots are plotted on the zero line. When the trend is down, the dots are coloured in red.
Greetings, success with your trade!!!


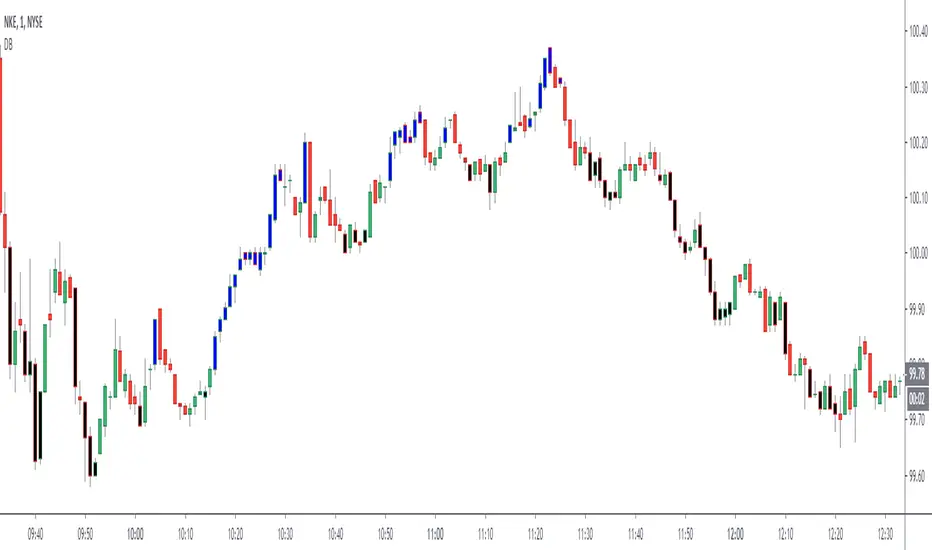
Dreadblitz BarsThese bars can give you good opportunities if you know how to analyze the context.
blue=bullish
black=bearish
thumbs up
Keltner Channel with signals [ChuckBanger]This is Keltner Channel where I added Bull and Bear signals. It has a lot of settings to play around with. Have fun...
For more information on Keltner Channel: www.investopedia.com

Market Thrust IndicatorThe Market Thrust indicator is a powerful measure of the stock market's internal strength or weakness. There are four components to this indicator:
1-Advancing Issues on the New York Stock Exchange (NYSE) – $ADV
2-Advancing Volume on the NYSE – $UVOL
3-Declining Issues on the NYSE – $DECL
4-Declining Volume on the NYSE – $DVOL
The formula for Market Thrust is given below:
($ADV x $UVOL)-($DECL x $DVOL)
When used for day-trading, the trend of the Market Thrust indicator is what is most important.
Rising Market Thrust Indicator: Considered a bullish sign; can act as a confirmation signal when combined with a rising stock, index ETF, or stock index future's price.
Falling Market Thrust Indicator: Considered a bearish sign; can act as a confirmation signal of a decreasing market price.
The Market Thrust indicator could be used for detecting divergences in trends. Divergences occur when:
- Price is trending higher, but the Market Thrust indicator is not moving higher or is even going down.
- Price is trending lower, however, the Market Thrust technical analysis tool is not trending lower, it is either not trending or is trending higher.
Add a fully configurable trend line over MTI.
Read more at: commodity.com

MAC-Z & MACD Leader signal [ChuckBanger]This is a combination of my MACD Leader script and MAC-Z with option to add Laguerre filter. The advantage of the MAC-Z over MACD is that it is a more accurate and “assumption-free” indicator that can more accurately describe how a market actually perform. But you can use this as a regular MACD indicator.
Crossovers signals
The MAC-Z line and signal line can be utilized in the same way as a stochastic oscillator, with the crossover between the two lines providing buy and sell signals. As with most crossover strategies, a buy signal comes when the shorter-term, more reactive line – in this case the MAC-Z line (blue line) crosses above the slower signal line (orange line). For example, when the MAC-Z line crosses below the signal line it provides a bearish sell signal.
Zero line crossing
The zero cross strategy is based on either of the lines crossing the zero line. If the MAC-Z crosses the zero line from below, it is a signal for a possible new uptrend, while the MAC-Z crossing from above is a signal that a new downtrend may be starting. This is special powerful if the lines has a fast up or down movement but the price action doesn't reflect that movement.
Divergences
Bearish and bullish divergences is my favorite signals. When price action and oscillators follow the same path it is called Convergences, when they don’t, it’s called a Divergence. Don't confuse the two because they have not the same meaning. But be aware that for example during consolidation or low liquidity, some small divergences between price and indicators might form, but that doesn't mean we should consider them as real divergences.
There is many different types of divergences. It is easier to show a picture then explaining it so I recommend you to check out the link below. Especially the top image. It sums this up very well
medium.com
MACD Leader
The MACD leader is only showing the crossing of MACD as a vertical line
Green vertical line = MACD Leader Bullish Cross
Red vertical line = MACD Leader Bearish Cross
MACD Leader:
MAC-Z:
More Information
cssanalytics.wordpress.com
en.wikipedia.org
drive.google.com

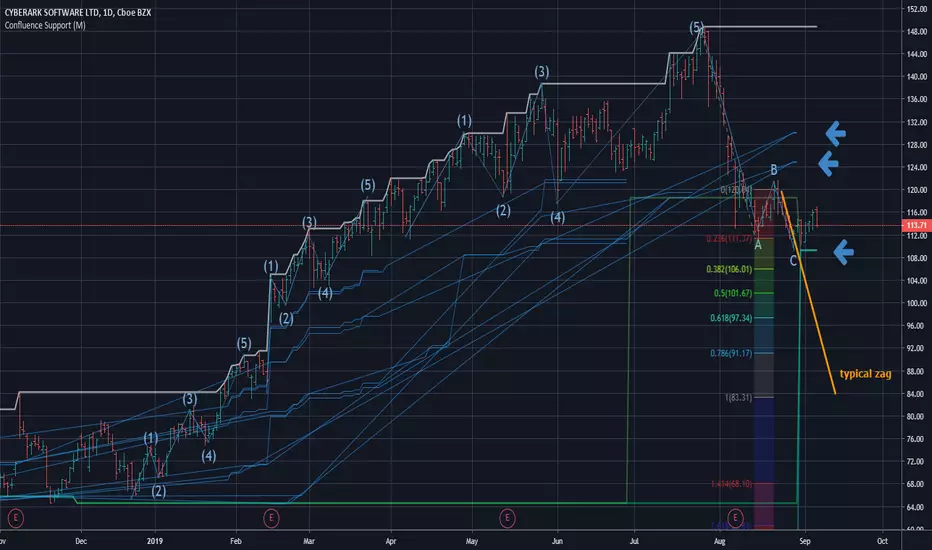
Confluence Zone Calculation for Support in Bullish TendsConfluence Zone Calculation for Support in Bullish Tends
(or Restance in bearish ones)
Ever wondered why sometimes the zag of an Elliot Wave zigzag is stopped after just a few points?
(Like in the given Chart where I draw a line for a typical zag action.)
It has often to do with confluence Zones. Most people think that the lower edge of a narrow range, repeated a few times, creates big support - confluence zones are stronger.
You can make them visible by getting fibonaccis from just one specific high to several different significant lows (for example the range lines mentioned above). The areas where significant lows and their fibos appear very close together are confluence zones. They can brake a falling price like a security net.
This script caluculates Confluence zones for you by using a second useful "secret": the secret that signifant lows test or create temporal rsi lows (vice-verse with highs).
The thicker (non-aqua clored)lines show actual lows, are corresponding with those rsi lows, the thinner are fibo lines deriving from them. (The white line stands for the high taken for the calculation.)
Note: Only those lines are valid which reach to the actual last bar.
Best practise is to let the script calculate,then redraw your lines of interest by hand and get rid of the rest of the spider web-like turmoil of lines by deleting the script from the chart.
Note further: I had to omit some calculations, because otherwise calculation time gets too long for TV and it stops with calculation Time out. (For your transparency I calculated all fibo codes but skipped some in "sline"-function; the number-suffix makes a jump when i omit a value ).
Note further further: Resistance confluence lines for bullish trends need a different script, because if you do it totally right vou in this case work from a single LOW of your interes t.
I hope it enriches your knowledge and is a help for your studies and tradings.
Feedback and Questions welcome
yoxxx
Engulfing Scanner v1This indicator helps you to quickly identify bullish and bearish engulfing patterns.
Works on currencies only (pips required).

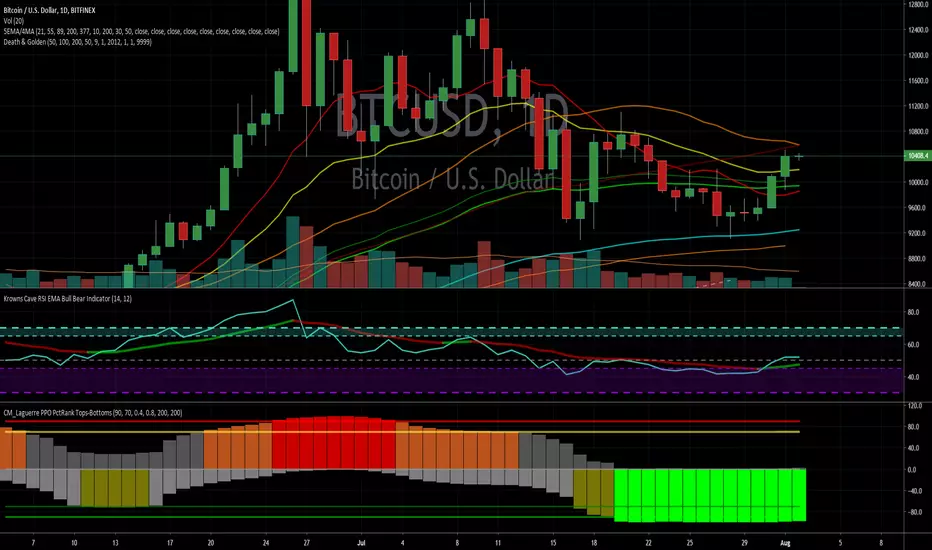
Krowns Cave RSI EMA Bull Bear IndicatorCombines EMA RSI indicator based on everyone's favourite Bull Jesus, King Krown!
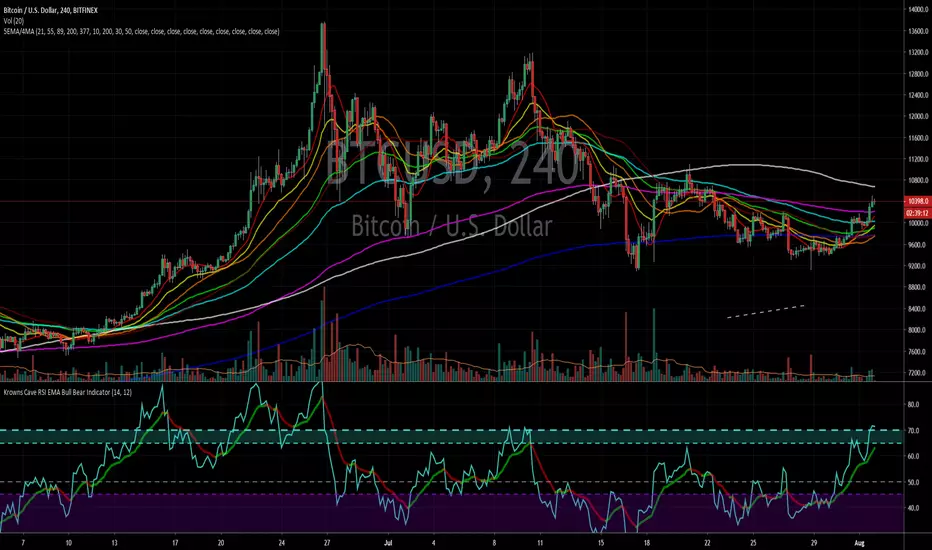
Krowns Cave RSI EMA Bull Bear IndicatorCombined RSI and EMA indicators based on everyone's favourite BTC Bull Jesus, King Krown!
Differential Price Counter for Bullish/Bearish BarsThis script can show the cumulative differential price of both bullish/bearish bars with the 0.1pip precision for the currencies having five decimal precision. However, can be useful for all markets.

Sentiment Zone OscillatorHere's a (forgotten but still useful) Sentiment Zone Oscillator. The Sentiment Zone Oscillator takes a sum of positive price candles over a user-specified window length. Normally, a triple exponential moving average of the sum is used, but we opted to just go with a double EMA for the sake of more responsiveness. When the histogram is green it is bullish and red/pink means bears.

BTC Halvening 3 Bull Peak CrossThe 350dma x2 and 111dma Cross Predicting Bitcoin Halvening #3 Bull market end.
Don't change any settings Except the colors. Bitcoin Halvening #4 will require a slight adjustment as noted in the script notes.
This has been brought to you by the time traveller.

SMA 50 collectorHello traders
The SMA 50 is known to define a trend. If price is closing above, trend is bullish, if below, trend is bearish.
That's why I like to have all of them on my chart :)
Enjoy
David

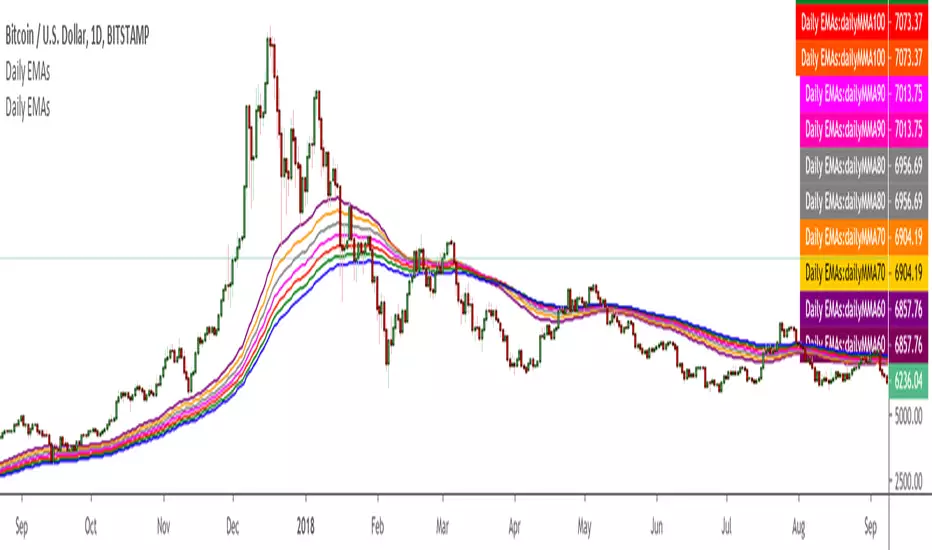
Multiple EMA Daily (60->120) - BTC bull market supportThis script shows areas of strong support during a BTC bull market.
24/9 EMA with Bias & SignalsThis is a simple indicator that plots the 24 & 9 EMAs.
It also highlights the potential bias of the market (bull or bear) based on if the 9 EMA is above or below the 24 EMA.
In addition there are signal crosses that you can use for alerts.
This indicator is best used to confirm a particular underlying bias on the 5m, 15M, 1HR, 4HR, and Daily timeframes.
It's important to note on lower timeframes that the bias can be counter trend bias of the overall larger momentum of the instrument you are trading.
For clarity this means that many retraces get going when the 9 crosses the 24. But ultimately the larger timeframe bias will continue after this counter trend retraces.
Combining this indicator with value channels and ATR is what I recommend.


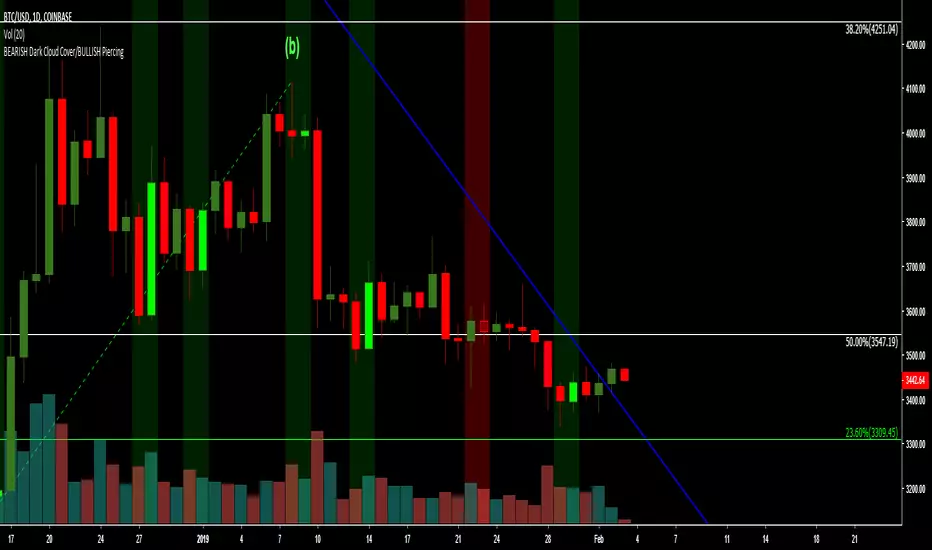
BEARISH Dark Cloud Cover/BULLISH PiercingThe script highlights the 2 candlesticks pattern: BEARISH Dark Cloud Cover/BULLISH Piercing on the main chart screen, and has a preset alert condition. Please use an oscillator that shows oversold and overbought conditions with this script (i.e. StochRSI oscillator).
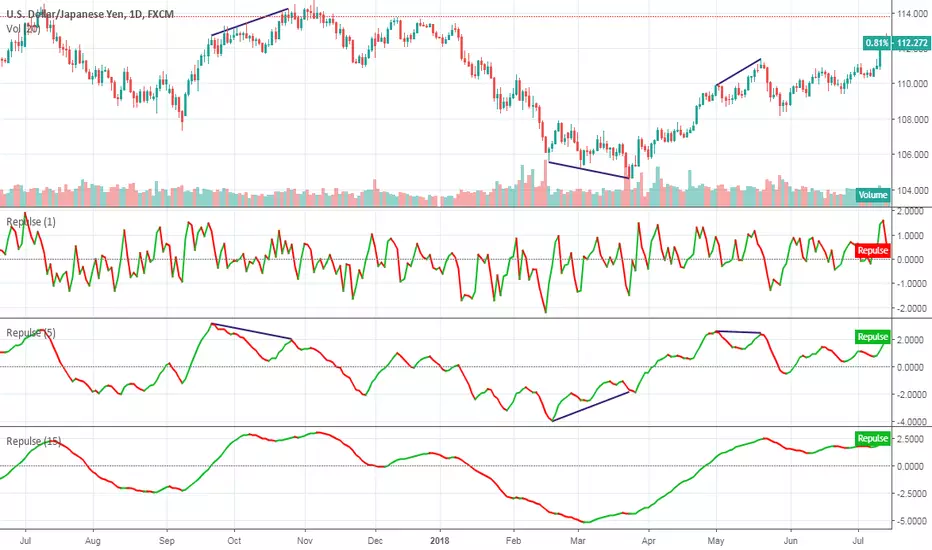
RepulseThis indicator was originally developed by Eric Lefort, a professional trader and author from France.
It gauges and displays the bullish or bearish pressure.
Like and follow for more open source indicators!
Happy Trading!
Buying with momentumThis is a beginner script, any feedback is welcome.
It indicates a bull trend with or without volume (yellow and green arrow) and give a buy signal (green flag) once the trend is "confirmed" and the stock became good for the buy market.
I look forward to make this for a bear market as well, but it's not good for now.
Symbols and its meanings:
Yellow Arrows --> When the EMA of 9 candles and the MA of 21 candles are higher then the previous candle.
Green Arrows --> When the EMA of 9 candles and the MA of 21 candles are higher then the previous candle and the volume is higher than the MA of 21 candles.
Green Flag --> The previous candles has a green arrow and the running candle reaches the previous candle high + 1 point/cent.

Bill Williams. Candles bear / bullish spread + Alligator.Bill Williams. Candles bear / bullish spread + Alligator.
