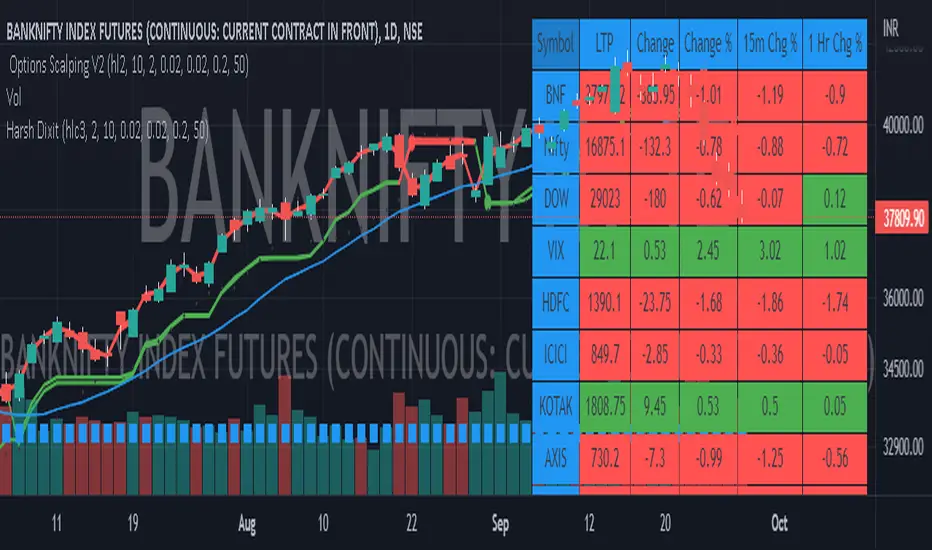
Options Scalping by harsh gbychi this is my script.
Bank Nifty Live OI Change Chart can give very useful clues for intraday support and resistance levels for Bank Nifty. If there is more addition in Open Interest at 12200 Calls, that would mean most market players are comfortable writing call options at this level because they believe it to be a strong resistance. That would be bearish indication for BankNifty.
Similarly is there is highest writing in 12000 Puts that would indicate strong intraday support at that level.
Third Scenario: There is good amount of Open Interest increase in 12000 PE and 12200 CE –> this means we should expect a range bound session for the day, as both bears and bulls are comfortable holding the 12200 and 12000 levels respectively.
Following factors could improve reliability of BankNifty OI Change analysis:
1) Put Call Ratio: Higher PCR means bullishness. If there is more writing at 12000PE and PCR is high and increasing during the day that would add to bullish scenario
If the PCR is declining for the day and more writing happening at 12200CE then this adds to bearishness.
2) Close to expiry: The closer to expiry we are, the more reliable the ‘Open Interest’ analysis. Early in the series, the OI analysis is less reliable.
3) More Players: As the number of players increase, the OI analysis become more reliable.
4) Bid-ask Spread: The lower the bid-ask spread the more reliable the OI analysis.
5) Technical Indicators: The best trades are found by combining OI analysis with other technical indicators. MACD, RSI, Channel lines and EW count give best results with Open Interest Analysis.
ابحث في النصوص البرمجية عن "BULL"
DOW 30 - Market BreadthDOW 30 indicator is intended for short-term intraday analysis and should not be used solely alone. Best to use this indicator in a combination with technical and fundamental analysis.
This indicator is calculated from all stocks in the DJI as of 8/9/2022;
- Evaluating VWAP,
- 9 EMA,
- 20 EMA.
Vwap Calculations;
Stock above Vwap = 1 (Vwap Bull),
Stock below Vwap = 1 (Vwap Bear),
As there are 30 stocks in the DJI, there is a max value of 30 Vwap Bulls/ Vwap Bears.
Ema Calculation;
Stock above 9 EMA = 0.5 (EMA Bulls),
Stock below 9 EMA = 0.5 (EMA Bears),
Stock above 20 EMA = 0.5 (EMA Bulls),
Stock below 20 EMA = 0.5 (EMA Bears),
For the EMA Bulls to reach 30 all stocks must be trading above both the 9 EMA and 20 EMA to reach a Max Value of 30.
The reasoning for this calculation is to suggest the current strength and speed of the current turn in the market.
Horizontal Lines:
There are three horizontal lines, MAX, MIN & Neutral;
MAX & MIN
Resides at the 30 & 0 levels suggesting the market is currently at an extreme. Representing all stocks are moving in the same direction together.
When the MAX or MIN are represented in the VWAP Line this represents directional conviction in the underlining DJI.
Neutral
Neutral resides at the 15 level and represents that the market is either about to make a decision or is choppy.
EXAMPLE
Below are some examples of how the DOW 30 indicator is able to represent the current market conditions.
Understand Current Market Conditions, either being Bullish, Neutral, or Bearish.
See live Market Mechanics, and understand the current market direction on a short-term timeframe.
DOW 30 indicator is intended for short-term intraday analysis and should not be used solely alone. Best to use this indicator in a combination with technical and fundamental analysis.
If there are any additional requests to the indicator feel free to leave a comment or privet message.
Best of luck trading.

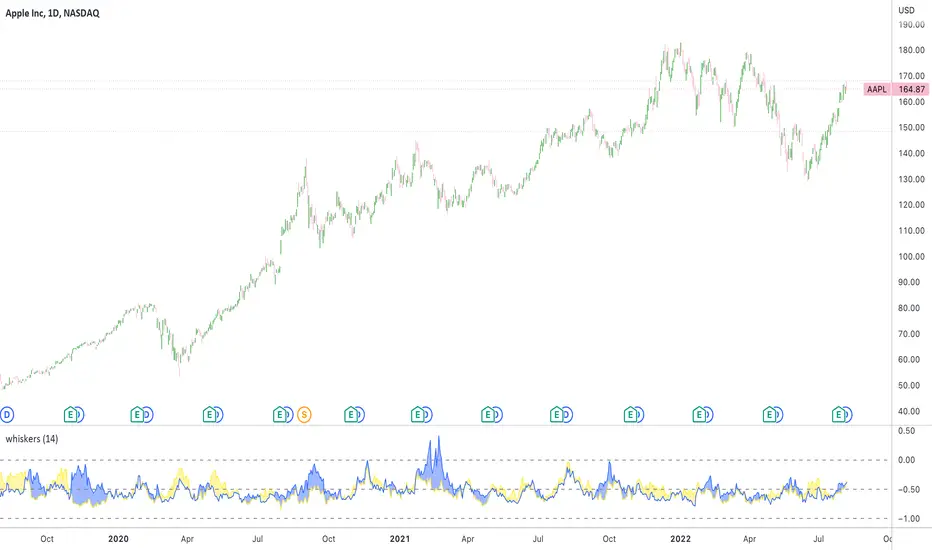
Whisker Reversal Oscillator [SpiritualHealer117]The Whisker Reversal Oscillator can be used to spot strength or weakness in trends. It is designed for stocks, commodities and forex trading, and is intended to be calculated from the high, close, low, and open over a given length.
Features:
The Whisker Reversal Oscillator shows the average length of the top and bottom whiskers on candlesticks over a defined length. It plots the percentage difference between the whiskers and the length of the body, with the yellow line representing the average length of the top whisker, and the bottom line indicating the average length of the bottom whisker.
Interpreting the signals:
The Whisker Reversal Oscillator is interpreted in the same way as a candlestick reversal pattern, where it being bullish or bearish depends on the trend. In a bull trend, if the yellow line passes above the blue line, it means the top whiskers are longer on average than the bottom whiskers, which may show that bulls were too weak to hold a rally, and signal a reversal. On the other hand, in a bear trend, if the yellow line is above the blue line, it indicates that the bulls were able to push the price up, which would be bullish. If the blue line crosses over the yellow line in an uptrend, it's often a bearish sign, but if it happens in a downtrend, its a bullish sign.
Generally speaking, a cross in the lines is indicative of a potential reversal, and when the lines cross over 1, it means that the whiskers were bigger than the candlestick bodies over your selected length, indicating that a big swing will come.
Oxy CandlestickOxymoronic (oxy) candlesticks often appear at significant levels in a chart and can indicate increased probabilities of directional moves.
Typically, green candles are hollow and red candles are filled. An oxymoronic candle is colored bullishly but filled bearishly (solid green) or vice versa (hollow red).
Oxy flags occur when:
1) Price gaps up and closes lower than the open but above the last close. A solid green (or black) candle is bearish.
2) Price gaps down and closes higher than the open but below the last close. A hollow red candle is bullish.
An oxy candle indicates one of three things:
1) Price is going up (bullish oxy)
2) Price is going down (bearish oxy)
3) Price will return to this level (either)
#1 and #2 are the default meaning. If those don't play out then look for #3.
As is the case with most indicators, it is best not to use this indicator in isolation, but to combine it with other forms of analysis to increase your probabilities and to identify significant levels.

Relative Strength Index (OSC)Hello everyone, I'm sorry that the previous open-source version was hidden due to the house rules, I've re-edited the description and re-posted it
(1) Indicator introduction
This is RSI indicator with original divergence algorithm
This indicator is plotted on the RSI and can display the divergence locations and corresponding divergence intensity
The tolerance of N Klines at the top or bottom positions for price and indicator is supported, which is set by the "Tolerant Kline Number"
Support the display of divergence intensity, that is, the REG/HID value displayed on the label, which is less than 0. The smaller the intensity value, the more obvious divergence
Support the filtering of divergence intensity, which is set by "Cov Threshold". The divergence that REG/HID divergence intensity greater than this value will be ignored
In the label, REG indicates regular top/bottom divergence while HID indicates hidden top/bottom divergence
In the label, SRC(x-y) indicates a divergence occurred from the x-th kline to the y-th kline
In the label, OSC(x-y) indicates a divergence occurred from the indicator corresponding to the x-th kline to the y-th kline
(2) Parameter introduction
- RSI Settings
Source: The source to calculate RSI, close by default
RSI Length: The length of RSI, 14 by default
- RSI Divergence
Pivot Lookback Right: Number of K-line bars recalling the pivot top/bottom point to the right
Pivot Lookback Left: Number of K-line bars recalling the pivot top/bottom point to the left
Max of Lookback Range: Maximum number of retracing K-line bars to find the pivot top/bottom point
Min of Lookback Range: Minimum number of retracing K-line bars to find the pivot top/bottom point
Tolerant Kline Number: Maximum tolerance in indexing top/bottom points of Klines and indicators
Cov Threshold: Divergence intensity, which is less than 0. The smaller the intensity value, the more obvious divergence
Plot Bullish: Whether to draw regular bullish divergence label
Plot Hidden Bullish: Whether to draw hidden bullish divergence label
Plot Bearish: Whether to draw regular bearish divergence label
Plot Hidden Bearish: Whether to draw hidden bearish divergence label
Happy trading and enjoy your life!
————————————————————————————————————————
各位朋友大家好,很抱歉之前的开源版本因为规则原因被隐藏,我已经重新编辑了说明并重新发布
(1) 指标说明
该指标绘制于 RSI 上,并在对应位置显示背离点以及背离程度
支持顶底位置 N 根K线的容差,由 Tolerant Kline Number 参数设置
支持背离强度的显示,即标签上显示的 REG/HID 值,该值小于 0,且越小说明背离程度越大
支持背离强度的过滤,由 Cov Threshold 参数设置, REG/HID 值大于这个值的背离会被忽略
标签中,REG 表示常规顶/低背离,而 HID 表示隐藏顶/底背离
标签中,SRC(x-y) 表示从当前第 x 根 bar 开始到第 y 跟 bar 出现背离
标签中,OSC(x-y) 表示从当前第 x 根 bar 所对应的指标开始到第 y 跟 bar 所对应的指标出现背离
(2) 参数说明
- RSI Settings
Source: 计算 RSI 指标的 source,默认为 close
RSI Length: 计算 RSI 指标的长度,默认为 14
- RSI Divergence
Pivot Lookback Right: 枢纽顶/底点往右回顾的 K线 bar 数量
Pivot Lookback Left: 枢纽顶/底点往左回顾的 K线 bar 数量
Max of Lookback Range: 回寻找枢纽顶/底点的最大回溯 K线 bar 数量
Min of Lookback Range: 回寻找枢纽顶/底点的最小回溯 K线 bar 数量
Tolerant Kline Number: K线和指标的顶/底点索引的最大误差
Cov Threshold: 背离程度,该值小于 0,且越小说明背离程度越大
Plot Bullish: 是否绘制常规底背离提示
Plot Hidden Bullish: 是否绘制隐藏底背离提示
Plot Bearish: 是否绘制常规顶背离提示
Plot Hidden Bearish: 是否绘制隐藏顶背离提示
祝大家交易愉快

Relative Strength Index (SRC)Hello everyone, I'm sorry that the previous open-source version was hidden due to the house rules, I've re-edited the description and re-posted it
(1) Indicator introduction
This is RSI indicator with original divergence algorithm
This indicator is plotted on the klines and can display the divergence locations and corresponding divergence intensity
The tolerance of N Klines at the top or bottom positions for price and indicator is supported, which is set by the "Tolerant Kline Number"
Support the display of divergence intensity, that is, the REG/HID value displayed on the label, which is less than 0. The smaller the intensity value, the more obvious divergence
Support the filtering of divergence intensity, which is set by "Cov Threshold". The divergence that REG/HID divergence intensity greater than this value will be ignored
In the label, REG indicates regular top/bottom divergence while HID indicates hidden top/bottom divergence
In the label, SRC(x-y) indicates a divergence occurred from the x-th kline to the y-th kline
In the label, OSC(x-y) indicates a divergence occurred from the indicator corresponding to the x-th kline to the y-th kline
(2) Parameter introduction
- RSI Settings
Source: The source to calculate RSI, close by default
RSI Length: The length of RSI, 14 by default
- RSI Divergence
Pivot Lookback Right: Number of K-line bars recalling the pivot top/bottom point to the right
Pivot Lookback Left: Number of K-line bars recalling the pivot top/bottom point to the left
Max of Lookback Range: Maximum number of retracing K-line bars to find the pivot top/bottom point
Min of Lookback Range: Minimum number of retracing K-line bars to find the pivot top/bottom point
Tolerant Kline Number: Maximum tolerance in indexing top/bottom points of Klines and indicators
Cov Threshold: Divergence intensity, which is less than 0. The smaller the intensity value, the more obvious divergence
Plot Bullish: Whether to draw regular bullish divergence label
Plot Hidden Bullish: Whether to draw hidden bullish divergence label
Plot Bearish: Whether to draw regular bearish divergence label
Plot Hidden Bearish: Whether to draw hidden bearish divergence label
Happy trading and enjoy your life!
————————————————————————————————————————
各位朋友大家好,很抱歉之前的开源版本因为规则原因被隐藏,我已经重新编辑了说明并重新发布
(1) 指标说明
该指标绘制于 K线 上,并在对应位置显示背离点以及背离程度
支持顶底位置 N 根K线的容差,由 Tolerant Kline Number 参数设置
支持背离强度的显示,即标签上显示的 REG/HID 值,该值小于 0,且越小说明背离程度越大
支持背离强度的过滤,由 Cov Threshold 参数设置, REG/HID 值大于这个值的背离会被忽略
标签中,REG 表示常规顶/低背离,而 HID 表示隐藏顶/底背离
标签中,SRC(x-y) 表示从当前第 x 根 bar 开始到第 y 跟 bar 出现背离
标签中,OSC(x-y) 表示从当前第 x 根 bar 所对应的指标开始到第 y 跟 bar 所对应的指标出现背离
(2) 参数说明
- RSI Settings
Source: 计算 RSI 指标的 source,默认为 close
RSI Length: 计算 RSI 指标的长度,默认为 14
- RSI Divergence
Pivot Lookback Right: 枢纽顶/底点往右回顾的 K线 bar 数量
Pivot Lookback Left: 枢纽顶/底点往左回顾的 K线 bar 数量
Max of Lookback Range: 回寻找枢纽顶/底点的最大回溯 K线 bar 数量
Min of Lookback Range: 回寻找枢纽顶/底点的最小回溯 K线 bar 数量
Tolerant Kline Number: K线和指标的顶/底点索引的最大误差
Cov Threshold: 背离程度,该值小于 0,且越小说明背离程度越大
Plot Bullish: 是否绘制常规底背离提示
Plot Hidden Bullish: 是否绘制隐藏底背离提示
Plot Bearish: 是否绘制常规顶背离提示
Plot Hidden Bearish: 是否绘制隐藏顶背离提示
祝大家交易愉快

On Balance Volume wi Normalization (OSC)Hello everyone, I'm sorry that the previous open-source version was hidden due to the house rules, I've re-edited the description and re-posted it
(1) Indicator introduction
This indicator is a normalized OBV that never dulls and has a better divergence accuracy than RSI
This indicator is plotted on the Normalized OBV and can display the divergence locations and corresponding divergence intensity
The tolerance of N Klines at the top or bottom positions for price and indicator is supported, which is set by the "Tolerant Kline Number"
Support the display of divergence intensity, that is, the REG/HID value displayed on the label, which is less than 0. The smaller the intensity value, the more obvious divergence
Support the filtering of divergence intensity, which is set by "Cov Threshold". The divergence that REG/HID divergence intensity greater than this value will be ignored
In the label, REG indicates regular top/bottom divergence while HID indicates hidden top/bottom divergence
In the label, SRC(x-y) indicates a divergence occurred from the x-th kline to the y-th kline
In the label, OSC(x-y) indicates a divergence occurred from the indicator corresponding to the x-th kline to the y-th kline
(2) Parameter introduction
- Normalized On Balance Volume
MA Type: Type of moving average for calculating the normalized OBV, default is SMA
MA Period: Period of moving average of normalized OBV, which is SMA14 by default
NOBV Sigma: Upper and lower range of normalized OBV
- Normalized On Balance Volume Divergence
Pivot Lookback Right: Number of K-line bars recalling the pivot top/bottom point to the right
Pivot Lookback Left: Number of K-line bars recalling the pivot top/bottom point to the left
Max of Lookback Range: Maximum number of retracing K-line bars to find the pivot top/bottom point
Min of Lookback Range: Minimum number of retracing K-line bars to find the pivot top/bottom point
Tolerant Kline Number: Maximum tolerance in indexing top/bottom points of Klines and indicators
Cov Threshold: Divergence intensity, which is less than 0. The smaller the intensity value, the more obvious divergence
Plot Bullish: Whether to draw regular bullish divergence label
Plot Hidden Bullish: Whether to draw hidden bullish divergence label
Plot Bearish: Whether to draw regular bearish divergence label
Plot Hidden Bearish: Whether to draw hidden bearish divergence label
Happy trading and enjoy your life!
————————————————————————————————————————
各位朋友大家好,很抱歉之前的开源版本因为规则原因被隐藏,我已经重新编辑了说明并重新发布
(1) 指标说明
该指标是 OBV 的归一化版本,永不钝化,背离准确率高于 RSI
该指标绘制于 归一化OBV 上,并在对应位置显示背离点以及背离程度
支持顶底位置 N 根K线的容差,由 Tolerant Kline Number 参数设置
支持背离强度的显示,即标签上显示的 REG/HID 值,该值小于 0,且越小说明背离程度越大
支持背离强度的过滤,由 Cov Threshold 参数设置, REG/HID 值大于这个值的背离会被忽略
标签中,REG 表示常规顶/低背离,而 HID 表示隐藏顶/底背离
标签中,SRC(x-y) 表示从当前第 x 根 bar 开始到第 y 跟 bar 出现背离
标签中,OSC(x-y) 表示从当前第 x 根 bar 所对应的指标开始到第 y 跟 bar 所对应的指标出现背离
(2) 参数说明
- Normalized On Balance Volume
MA Type: 计算归一化 OBV 的移动平均的类型,默认为 SMA
MA Period: 计算归一化 OBV 的移动平均的周期,默认为 SMA14
NOBV Sigma: 归一化 OBV 的过滤区间
- Normalized On Balance Volume Divergence
Pivot Lookback Right: 枢纽顶/底点往右回顾的 K线 bar 数量
Pivot Lookback Left: 枢纽顶/底点往左回顾的 K线 bar 数量
Max of Lookback Range: 回寻找枢纽顶/底点的最大回溯 K线 bar 数量
Min of Lookback Range: 回寻找枢纽顶/底点的最小回溯 K线 bar 数量
Tolerant Kline Number: K线和指标的顶/底点索引的最大误差
Cov Threshold: 背离程度,该值小于 0,且越小说明背离程度越大
Plot Bullish: 是否绘制常规底背离提示
Plot Hidden Bullish: 是否绘制隐藏底背离提示
Plot Bearish: 是否绘制常规顶背离提示
Plot Hidden Bearish: 是否绘制隐藏顶背离提示
祝大家交易愉快

On Balance Volume wi Normalization (SRC)Hello everyone, I'm sorry that the previous open-source version was hidden due to the house rules, I've re-edited the description and re-posted it
(1) Indicator introduction
This indicator is a normalized OBV that never dulls and has a better divergence accuracy than RSI
This indicator is plotted on the klines and can display the divergence locations and corresponding divergence intensity
The tolerance of N Klines at the top or bottom positions for price and indicator is supported, which is set by the "Tolerant Kline Number"
Support the display of divergence intensity, that is, the REG/HID value displayed on the label, which is less than 0. The smaller the intensity value, the more obvious divergence
Support the filtering of divergence intensity, which is set by "Cov Threshold". The divergence that REG/HID divergence intensity greater than this value will be ignored
In the label, REG indicates regular top/bottom divergence while HID indicates hidden top/bottom divergence
In the label, SRC(x-y) indicates a divergence occurred from the x-th kline to the y-th kline
In the label, OSC(x-y) indicates a divergence occurred from the indicator corresponding to the x-th kline to the y-th kline
(2) Parameter introduction
- Normalized On Balance Volume
MA Type: Type of moving average for calculating the normalized OBV, default is SMA
MA Period: Period of moving average of normalized OBV, which is SMA14 by default
NOBV Sigma: Upper and lower range of normalized OBV, but the function is reserved
- Normalized On Balance Volume Divergence
Pivot Lookback Right: Number of K-line bars recalling the pivot top/bottom point to the right
Pivot Lookback Left: Number of K-line bars recalling the pivot top/bottom point to the left
Max of Lookback Range: Maximum number of retracing K-line bars to find the pivot top/bottom point
Min of Lookback Range: Minimum number of retracing K-line bars to find the pivot top/bottom point
Tolerant Kline Number: Maximum tolerance in indexing top/bottom points of Klines and indicators
Cov Threshold: Divergence intensity, which is less than 0. The smaller the intensity value, the more obvious divergence
Plot Bullish: Whether to draw regular bullish divergence label
Plot Hidden Bullish: Whether to draw hidden bullish divergence label
Plot Bearish: Whether to draw regular bearish divergence label
Plot Hidden Bearish: Whether to draw hidden bearish divergence label
Happy trading and enjoy your life!
————————————————————————————————————————
各位朋友大家好,很抱歉之前的开源版本因为规则原因被隐藏,我已经重新编辑了说明并重新发布
(1) 指标说明
该指标是 OBV 的归一化版本,永不钝化,背离准确率高于 RSI
该指标绘制于 K线 上,并在对应位置显示背离点以及背离程度
支持顶底位置 N 根K线的容差,由 Tolerant Kline Number 参数设置
支持背离强度的显示,即标签上显示的 REG/HID 值,该值小于 0,且越小说明背离程度越大
支持背离强度的过滤,由 Cov Threshold 参数设置, REG/HID 值大于这个值的背离会被忽略
标签中,REG 表示常规顶/低背离,而 HID 表示隐藏顶/底背离
标签中,SRC(x-y) 表示从当前第 x 根 bar 开始到第 y 跟 bar 出现背离
标签中,OSC(x-y) 表示从当前第 x 根 bar 所对应的指标开始到第 y 跟 bar 所对应的指标出现背离
(2) 参数说明
- Normalized On Balance Volume
MA Type: 计算归一化 OBV 的移动平均的类型,默认为 SMA
MA Period: 计算归一化 OBV 的移动平均的周期,默认为 SMA14
NOBV Sigma: 归一化 OBV 的过滤区间,其功能暂时保留
- Normalized On Balance Volume Divergence
Pivot Lookback Right: 枢纽顶/底点往右回顾的 K线 bar 数量
Pivot Lookback Left: 枢纽顶/底点往左回顾的 K线 bar 数量
Max of Lookback Range: 回寻找枢纽顶/底点的最大回溯 K线 bar 数量
Min of Lookback Range: 回寻找枢纽顶/底点的最小回溯 K线 bar 数量
Tolerant Kline Number: K线和指标的顶/底点索引的最大误差
Cov Threshold: 背离程度,该值小于 0,且越小说明背离程度越大
Plot Bullish: 是否绘制常规底背离提示
Plot Hidden Bullish: 是否绘制隐藏底背离提示
Plot Bearish: 是否绘制常规顶背离提示
Plot Hidden Bearish: 是否绘制隐藏顶背离提示
祝大家交易愉快

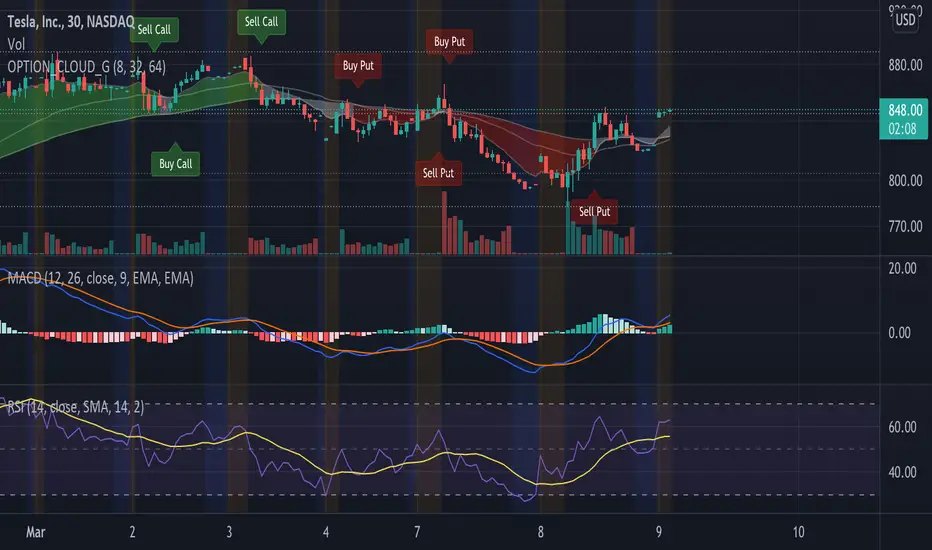
EMA Options Clouds With SignalsEMA Clouds for Options!
This indicator can help you confidently open and close options positions. Note that you should set stop a little below midline EMA . Risk reward for good signals is fairly consistent in profit. Most of the simulations I ran got between 1:2 and 1:4 profits. The losers usually can be avoided by making sure you are not in a choppy trading channel. Wait for EMAs to start separating and don't blindly follow every buy/sell.
3 wave EMA + Clouds:
Defaults:
EMA 8/32/64
Signals (off by default - turn on in settings):
Buy Call/Sell Call (open/exit call positions)
Buy Put/Sell Put (open/exit put positions)
Enter signals bullish:
Close over Middle EMA AND Short EMA > Middle EMA > Long EMA
Exit signals bullish:
Close under Middle EMA OR trend turns bearish (Short EMA < Middle EMA < Long EMA )
Enter signals bearish:
Close under Middle EMA AND Short EMA < Middle EMA < Long EMA
Exit signals bearish:
Close over Middle EMA OR Short EMA > Middle EMA > Long EMA
Cloud Colors (Default)
Green: Bullish
Red: Bearish
White: Chop/Transition
BE_CustomFx_LibraryLibrary "BE_CustomFx_Library"
A handful collection of regular functions, Custom Tools & Utility Functions could be used in regular Scripts. hope these functions can be understood by a non programmer like me too.
G_TextValOfNumber(ValueToConvert, RequiredDecimalPlaces, BeginingChar, EndChar) Function to return the String Value of Number with decimal precision with the prefix and suffix characters provided
Parameters:
ValueToConvert : = Number to Convert
RequiredDecimalPlaces : = No of Decimal values Required. supports to a max of 5 decimals else defaults to 2
BeginingChar : = Prefix character which is needed.
EndChar : = Suffix character which is needed.
Returns: Returns Out put with formated value of Given Number for the specified deicimal values with Prefix and suffix string
G_TradableValue(ValueToConvert, NeedCustomization, RequiredDecimalPlaces) Function to return the Tradable Value of Number
Parameters:
ValueToConvert : = Number to Convert
NeedCustomization : = set to 1 if you want to customize the decimal percision values. default is No customization needed, which provides output equalent to round_to_mintick
RequiredDecimalPlaces : = if NeedCustomization is set to 1 mention the decimal percision value required. max supported decimal is 5 else defaults to 2
Returns: Returns Out put with formated value of Given Number
G_TxtSizeForLables(SizeValue) Function to Get size Value for text values used in Lables
Parameters:
SizeValue : = auto, tiny, small, normal, large, huge. specify either of these values or default value Normal will be displayed as output
Returns: Returns Respective Text size
G_Reg_LineType(LineType) Function to Get Line Style Value for text values used in Lines
Parameters:
LineType : = 'solid (─)', 'dotted (┈)', 'dashed (╌)', 'arrow left (←)', 'arrow right (→)', 'arrows both (↔)' or default line style 'dotted (┈)' will be the output
Returns: Returns Respective Line style
G_ShapeTypeForLables(ShapeType) Function to Get Shape Style Value for text values used in plot shapes
Parameters:
ShapeType : = 'XCross', 'Cross', 'Triangle Up', 'Triangle Down', 'Flag', 'Circle','Arrow Up', 'Arrow Down','Lable Up', 'Lable Down' or default shpae style Triangle Up will be the output
Returns: Returns Respective Shape style
G_Indicator_Val(string, float, int, int) Gets Output of the technical analyis indicator which has length Parameter. RSI, ATR, EMA, SMA, HMA, WMA, VWMA, 'CMO', 'MOM', 'ROC','VWAP'
Parameters:
string : IndicatorName to be specified
float : SrcVal for the TA indicator default is close
int : Length for the TA indicator
int : DecimalValue optional to specify if required formatted output with decimal percision
Returns: Value with the given parameters
G_CandleInfo(string, bool, float, bool) function to get Candle Informarion such as both wicksize, top wick size , bottom wick size, full candle size and body size in default points
Parameters:
string : WhatCandleInfo, string input with either of these options "Wick" , "TWick" , "BWick" , "Candle", "Body" , "BearfbVal", "BullfbVal" , "CandleOpen" ,"CandleClose", "CandleHigh" , "CandleLow", "BodyPct"
bool : RepaintingVersion, set to true if required data on the realtime bar else default is set to false
float : FibValueOfCandle, set the fibo value to extract fibvalue of the candle else default is set to 38.2%
bool : AccountforGaps, set to true if required data on considering the gap between previous and current bar else default is set to false
Returns: Returns Respective values for the candles
G_BullBearBarCount(int, int) Counts how many green & red bars have printed recently (ie. pullback count)
Parameters:
int : HowManyCandlesToCheck The lookback period to look back over
int : BullBear The color of the bar to count (1 = Bull, -1 = Bear), Open = close candles are ignored
Returns: The bar count of how many candles have retraced over the given lookback with specific candles
BarToStartYourCalculation(Int) function to get candle co-ordinate in order to use it further for calculating your analysis work . "Heart full Thanks to 3 Pine motivators (LonesomeTheBlue, Myank & Sriki) who helped me cracking this logic"
Parameters:
Int : SelectedCandleNumber (default=450) How many candles you would need to anlysie in your script from the right.
Returns: A boolean - output is returned to say the starting point and continue to diplay true for the future candles
isHammer(float, bool, bool) Checks if the current bar is a hammer candle based on the given parameters
Parameters:
float : fib (default=0.382) The fib to base candle body on
bool : colorMatch (default=false) Does the candle need to be green? (true/false)
bool : NeedRepainting (default=false) Specify True if you need them to calculate on the realtime bars
Returns: A boolean - true if the current bar matches the requirements of a hammer candle
isStar(float, bool, bool) Checks if the current bar is a shooting star candle based on the given parameters
Parameters:
float : fib (default=0.382) The fib to base candle body on
bool : colorMatch (default=false) Does the candle need to be red? (true/false)
bool : NeedRepainting (default=false) Specify True if you need them to calculate on the realtime bars
Returns: A boolean - true if the current bar matches the requirements of a shooting star candle
isDoji(float, float, bool) Checks if the current bar is a doji candle based on the given parameters
Parameters:
float : _wickSize (default=1.5 times) The maximum allowed times can be top wick size compared to the bottom (and vice versa)
float : _bodySize (default= 5 percent to be mentioned as 0.05) The maximum body size as a percentage compared to the entire candle size
bool : NeedRepainting (default=false) Specify true if you need them to calculate on the realtime bars
Returns: A boolean - true if the current bar matches the requirements of a doji candle
isBullishEC(float, float, bool, bool) Checks if the current bar is a bullish engulfing candle
Parameters:
float : _allowance (default=0) How many POINTS to allow the open to be off by (useful for markets with micro gaps)
float : _rejectionWickSize (default=disabled) The maximum rejection wick size compared to the body as a percentage
bool : _engulfWick (default=false) Does the engulfing candle require the wick to be engulfed as well?
bool : NeedRepainting (default=false) Specify True if you need them to calculate on the realtime bars
Returns: A boolean - true if the current bar matches the requirements of a bullish engulfing candle
isBearishEC(float, float, bool, bool) Checks if the current bar is a bearish engulfing candle
Parameters:
float : _allowance (default=0) How many POINTS to allow the open to be off by (useful for markets with micro gaps)
float : _rejectionWickSize (default=disabled) The maximum rejection wick size compared to the body as a percentage
bool : _engulfWick (default=false) Does the engulfing candle require the wick to be engulfed as well?
bool : NeedRepainting (default=false) Specify True if you need them to calculate on the realtime bars
Returns: A boolean - true if the current bar matches the requirements of a bearish engulfing candle
Plot_TrendLineAtDegree(float, float, int, string, bool) helps you to plot the Trendlines based on the specified angle at the defined price to bar ratio
Parameters:
float : Degree (default=14) angle at which Trendline to be plot
float : price2bar_ratio (default=1e-10) The maximum rejection wick size compared to the body as a percentage
int : Bars2Plot (default=6) Does the engulfing candle require the wick to be engulfed as well?
string : LineStyle = 'solid (─)', 'dotted (┈)', 'dashed (╌)', 'arrow left (←)', 'arrow right (→)', 'arrows both (↔)' or default line style 'dotted (┈)' will be the output
bool : PlotOnOpen_Close (default=false) Specify True if you need them to calculate on the Open\Close Values
Returns: plot the Trendlines based on the specified angle at the defined price to bar ratio
Ichimoku [xdecow]The Ichimoku Kinko Hyo (Ichimoku Cloud) is a popular indicator / system.
In this version you will have a panel that shows the main signs of this system.
Each signal can have its status as bullish (weak, neutral or strong), consolidation and bearish (weak, neutral or strong).
Signals
Kijun-Sen Cross
Occurs when the price closes above/below the Kijun-sen.
Weak Bullish: Occurs below the Kumo.
Weak Bearish: Occurs above the Kumo.
Bullish/Bearish Neutral: Occurs inside the Kumo.
Strong Bullish: Occurs above the Kumo.
Strong Bearish: Occurs below the Kumo.
TK Cross
Occurs when the Tenkan-sen crosses the Kijun-sen.
Weak Bullish: Occurs when the crossing is below the Kumo.
Weak Bearish: Occurs when the crossing is above the Kumo.
Bullish/Bearish Neutral: Occurs when the crossing is inside the Kumo.
Strong Bullish: Occurs when the crossing is above the Kumo.
Strong Bearish: Occurs when the crossing is below the Kumo.
Chikou Span Cross
Occurs when the Chikou Span crosses the price.
Weak Bullish: Occurs when current price is below the Kumo.
Weak Bearish: Occurs when current price is above the Kumo.
Bullish/Bearish Neutral: Occurs when current price is inside the Kumo.
Strong Bullish: Occurs when current price is above the Kumo.
Strong Bearish: Occurs when current price is below the Kumo.
Kumo Breakout
Occurs when the price closes above/below the Kumo.
Kumo Twist
Occurs when the Senkou Span A crosses the Senkou Span B ahead.
Weak Bullish: Occurs when current price is below the Kumo.
Weak Bearish: Occurs when current price is above the Kumo.
Bullish/Bearish Neutral: Occurs when current price is inside the Kumo.
Strong Bullish: Occurs when current price is above the Kumo.
Strong Bearish: Occurs when current price is below the Kumo.
In addition, Senkou Span B turns golden when it is flat and the cloud is lighter when it is thin (default is half the average of the last 610).

Realtime Delta Volume Action [LucF]█ OVERVIEW
This indicator displays on-chart, realtime, delta volume and delta ticks information for each bar. It aims to provide traders who trade price action on small timeframes with volume and tick information gathered as updates come in the chart's feed. It builds its own candles, which are optimized to display volume delta information. It only works in realtime.
█ WARNING
This script is intended for traders who can already profitably trade discretionary on small timeframes. The high cost in fees and the excitement of trading at small timeframes have ruined many newcomers to trading. While trading at small timeframes can work magic for adrenaline junkies in search of thrills rather than profits, I DO NOT recommend it to most traders. Only seasoned discretionary traders able to factor in the relatively high cost of such a trading practice can ever hope to take money out of markets in that type of environment, and I would venture they account for an infinitesimal percentage of traders. If you are a newcomer to trading, AVOID THIS TOOL AT ALL COSTS — unless you are interested in experimenting with the interpretation of volume delta combined with price action. No tool currently available on TradingView provides this type of close monitoring of volume delta information, but if you are not already trading small timeframes profitably, please do not let yourself become convinced that it is the missing piece you needed. Avoid becoming a sucker who only contributes by providing liquidity to markets.
The information calculated by the indicator cannot be saved on charts, nor can it be recalculated from historical bars.
If you refresh the chart or restart the script, the accumulated information will be lost.
█ FEATURES
Key values
The script displays the following key values:
• Above the bar: ticks delta (DT), the total ticks for the bar, the percentage of total ticks that DT represents (DT%)
• Below the bar: volume delta (DV), the total volume for the bar, the percentage of total volume that DV represents (DV%).
Candles
Candles are composed of four components:
1. A top shaped like this: ┴, and a bottom shaped like this: ┬ (picture a normal Japanese candle without a body outline; the values used are the same).
2. The candle bodies are filled with the bull/bear color representing the polarity of DV. The intensity of the body's color is determined by the DV% value.
When DV% is 100, the intensity of the fill is brightest. This plays well in interpreting the body colors, as the smaller, less significant DV% values will produce less vivid colors.
3. The bright-colored borders of the candle bodies occur on "strong bars", i.e., bars meeting the criteria selected in the script's inputs, which you can configure.
4. The POC line is a small horizontal line that appears to the left of the candle. It is the volume-weighted average of all price updates during the bar.
Calculations
This script monitors each realtime update of the chart's feed. It first determines if price has moved up or down since the last update. The polarity of the price change, in turn, determines the polarity of the volume and tick for that specific update. If price does not move between consecutive updates, then the last known polarity is used. Using this method, we can calculate a running volume delta and ticks delta for the bar, which becomes the bar's final delta values when the bar closes (you can inspect values of elapsed realtime bars in the Data Window or the indicator's values). Note that these values will all reset if the script re-executes because of a change in inputs or a chart refresh.
While this method of calculating is not perfect, it is by far the most precise way of calculating volume delta available on TradingView at the moment. Calculating more precise results would require scripts to have access to tick data from any chart timeframe. Charts at seconds timeframes do use exchange/broker ticks when the feeds you are using allow for it, and this indicator will run on them, but tick data is not yet available from higher timeframes. Also, note that the method used in this script is far superior to the intrabar inspection technique used on historical bars in my other "Delta Volume" indicators. This is because volume and ticks delta here are calculated from many more realtime updates than the available intrabars in history. Unfortunately, the calculation method used here cannot be used on historical bars, where intrabar inspection remains, in my opinion, the optimal method.
Inputs
The script's inputs provide many ways to personalize all the components: what is displayed, the colors used to display the information, and the marker conditions. Tooltips provide details for many of the inputs; I leave their exploration to you.
Markers
Markers provide a way for you to identify the points of interest of your choice on the chart. You control the set of conditions that trigger each of the five available markers.
You select conditions by entering, in the field for each marker, the number of each condition you want to include, separated by a comma. The conditions are:
1 — The bar's polarity is up/dn.
2 — `close` rises/falls ("rises" means it is higher than its value on the previous bar).
3 — DV's polarity is +/–.
4 — DV% rises (↕).
5 — POC rises/falls.
6 — The quantity of realtime updates rises (↕).
7 — DV > limit (You specify the limit in the inputs. Since DV can be +/–, DV– must be less than `–limit` for a short marker).
8 — DV% > limit (↕).
9 — DV+ rises for a long marker, DV– falls for a short.
10 — Consecutive DV+/DV– on two bars.
11 — Total volume rises (↕).
12 — DT's polarity is +/–.
13 — DT% rises (↕).
14 — DT+ rises for a long marker, DT– falls for a short.
Conditions showing the (↕) symbol do not have symmetrical states; they act more like filters. If you only include condition 4 in a marker's setup, for example, both long and short markers will trigger on bars where DV% rises. To trigger only long or short markers, you must add a condition providing directional differentiation, such as conditions 1 or 2. Accordingly, you would enter "1,4" or "2,4".
For a marker to trigger, ALL the conditions you specified for it must be met. Long markers appear on the chart as "Mx▲" signs under the values displayed below candles. Short markers display "Mx▼" over the number of updates displayed above candles. The marker's number will replace the "x" in "Mx▲". The script loads with five markers that will not trigger because no conditions are associated with them. To activate markers, you will need to select and enter the set of conditions you require for each one.
Alerts
You can configure alerts on this script. They will trigger whenever one of the configured markers triggers. Alerts do not repaint, so they trigger at the bar's close—which is also when the markers will appear.
█ HOW TO USE IT
As a rule, I do not prescribe expected use of my indicators, as traders have proved to be much more creative than me in using them. Additionally, I tend to think that if you expect detailed recommendations from me to be able to use my indicators, it's a sign you are in a precarious situation and should go back to the drawing board and master the necessary basics that will allow you to explore and decide for yourself if my indicators can be useful to you, and how you will use them. I will make an exception for this thing, as it presents fairly novel information. I will use simple logic to surmise potential uses, as contrary to most of my other indicators, I have NOT used this one to actually trade. Markets have a way of throwing wrenches in our seemingly bullet-proof rationalizing, so drive cautiously and please forgive me if the pointers I share here don't pan out.
The first thing to do is to disable your normal bars. You can do this by clicking on the eye icon that appears when you hover over the symbol's name in the upper-left corner of your chart.
The absolute value and polarity of DV mean little without perspective; that's why I include both total volume for the bar and the percentage that DV represents of that total volume. I interpret a low DV% value as indecision. If you share that opinion, you could, let's say, configure one of the markers on "DV% > 80%", for example (to do so you would enter "8" in the condition field of any marker, and "80" in the limit field for condition 8, below the marker conditions).
I also like to analyze price action on the bar with DV%. Small DV% values should often produce small candle bodies. If a small DV% value occurs on a bar with much movement and high volume, I'm thinking "tough battle with potential explosive power when one side wins". Conversely, large bodies with high DV% mean that large volume is breaching through multiple levels, or that nobody is suddenly willing to take the other side of a normal volume of trades.
I find the POC lines really interesting. First, they tell us the price point where the most significant action (taking into account both price occurrences AND volume) during the bar occurred. Second, they can be useful when compared against past values. Third, their color helps us in figuring out which ones are the most significant. Unsurprisingly, bunches of orange POCs tend to appear in consolidation zones, in pauses, and before reversals. It may be useful to often focus more on POC progression than on `close` values. This is not to say that OHLC values are not useful; looking, as is customary, for higher highs or lower lows, or for repeated tests of precise levels can of course still be useful. I do like how POCs add another dimension to chart readings.
What should you do with the ticks delta above bars? Old-time ticker tape readers paid attention to the sounds coming from it (the "ticker" moniker actually comes from the sound they made). They knew activity was picking up when the frequency of the "ticks" increased. My thinking is that the total number of ticks will help you in the same way, since increasing updates usually mean growing interest—and thus perhaps price movement, as increasing volatility or volume would lead us to surmise. Ticks delta can help you figure out when proportionally large, random orders come in from traders with other perspectives than the short-term price action you are typically working with when you use this tool. Just as volume delta, ticks delta are one more informational component that can help you confirm convergence when building your opinions on price action.
What are strong bars? They are an attempt to identify significance. They are like a default marker, except that instead of displaying "Mx▲/▼" below/above the bar, the candle's body is outlined in bright bull/bear color when one is detected. Strong bars require a respectable amount of conditions to be met (you can see and re-configure them in the inputs). Think of them as pushes rather than indications of an upcoming, strong and multi-bar move. Pushes do, for sure, often occur at the beginning of strong trends. You will often see a few strong bars occur at 2-3 bar intervals at the beginning or middle of trends. But they also tend to occur at tops/bottoms, which makes their interpretation problematic. Another pattern that you will see quite frequently is a final strong bar in the direction of the trend, followed a few bars later by another strong bar in the reverse direction. My summary analyses seemed to indicate these were perhaps good points where one could make a bet on an early, risky reversal entry.
The last piece of information displayed by the indicator is the color of the candle bodies. Three possible colors are used. Bull/bear is determined by the polarity of DV, but only when the bar's polarity matches that of DV. When it doesn't, the color is the divergence color (orange, by default). Whichever color is used for the body, its intensity is determined by the DV% value. Maximum intensity occurs when DV%=100, so the more significant DV% values generate more noticeable colors. Body colors can be useful when looking to confirm the convergence of other components. The visual effect this creates hopefully makes it easier to detect patterns on the chart.
One obvious methodology that comes to mind to trade with this tool would be to use another indicator like Technical Ratings at a higher timeframe to identify the larger context's trend, and then use this tool to identify entries for short-term trades in that direction.
█ NOTES AND RAMBLINGS
Instant Calculations
This indicator uses instant values calculated on the bar only. No moving averages or calculations involving historical periods are used. The only exception to this rule is in some of the marker conditions like "Two consecutive DV+ values", where information from the previous bar is used.
Trading Small vs Long Timeframes
I never trade discretionary at the 5sec–5min timeframes this indicator was designed to be used with; I trade discretionary at 1D, 1W and 1M timeframes, and let systems trade at smaller timeframes. The higher the timeframe you trade at, the fewer fees you will pay because you trade less and are not churning trading volume, as is inevitable at smaller timeframes. Trading at higher timeframes is also a good way to gain an instant edge on most of the trading crowd that has its nose to the ground and often tends to forget the big picture. It also makes for a much less demanding trading practice, where you have lots of time to research and build your long-term opinions on potential future outcomes. While the future is always uncertain, I believe trades riding on long-term trends have stronger underlying support from the reality outside markets.
To traders who will ask why I publish an indicator designed for small timeframes, let me say that my main purpose here is to showcase what can be done with Pine. I often see comments by coders who are obviously not aware of what Pine is capable of in 2021. Since its humble beginnings seven years ago, Pine has grown and become a serious programming language. TradingView's growing popularity and its ongoing commitment to keep Pine accessible to newcomers to programming is gradually making Pine more and more of a standard in indicator and strategy programming. The technical barriers to entry for traders interested in owning their trading practice by developing their personal tools to trade have never been so low. I am also publishing this script because I value volume delta information, and I present here what I think is an original way of analyzing it.
Performance
The script puts a heavy load on the Pine runtime and the charting engine. After running the script for a while, you will often notice your chart becoming less responsive, and your chart tab can take longer to activate when you go back to it after using other tabs. That is the reason I encourage you to set the number of historical values displayed on bars to the minimum that meets your needs. When your chart becomes less responsive because the script has been running on it for many hours, refreshing the browser tab will restart everything and bring the chart's speed back up. You will then lose the information displayed on elapsed bars.
Neutral Volume
This script represents a departure from the way I have previously calculated volume delta in my scripts. I used the notion of "neutral volume" when inspecting intrabar timeframes, for bars where price did not move. No longer. While this had little impact when using intrabar inspection because the minimum usable timeframe was 1min (where bars with zero movement are relatively infrequent), a more precise way was required to handle realtime updates, where multiple consecutive prices often have the same value. This will usually happen whenever orders are unable to move across the bid/ask levels, either because of slow action or because a large-volume bid/ask level is taking time to breach. In either case, the proper way to calculate the polarity of volume delta for those updates is to use the last known polarity, which is how I calculate now.
The Order Book
Without access to the order book's levels (the depth of market), we are limited to analyzing transactions that come in the TradingView feed for the chart. That does not mean the volume delta information calculated this way is irrelevant; on the contrary, much of the information calculated here is not available in trading consoles supplied by exchanges/brokers. Yet it's important to realize that without access to the order book, you are forfeiting the valuable information that can be gleaned from it. The order book's levels are always in movement, of course, and some of the information they contain is mere posturing, i.e., attempts to influence the behavior of other players in the market by traders/systems who will often remove their orders when price comes near their order levels. Nonetheless, the order book is an essential tool for serious traders operating at intraday timeframes. It can be used to time entries/exits, to explain the causes of particular price movements, to determine optimal stop levels, to get to know the traders/systems you are betting against (they tend to exhibit behavioral patterns only recognizable through the order book), etc. This tool in no way makes the order book less useful; I encourage all intraday traders to become familiar with it and avoid trading without one.

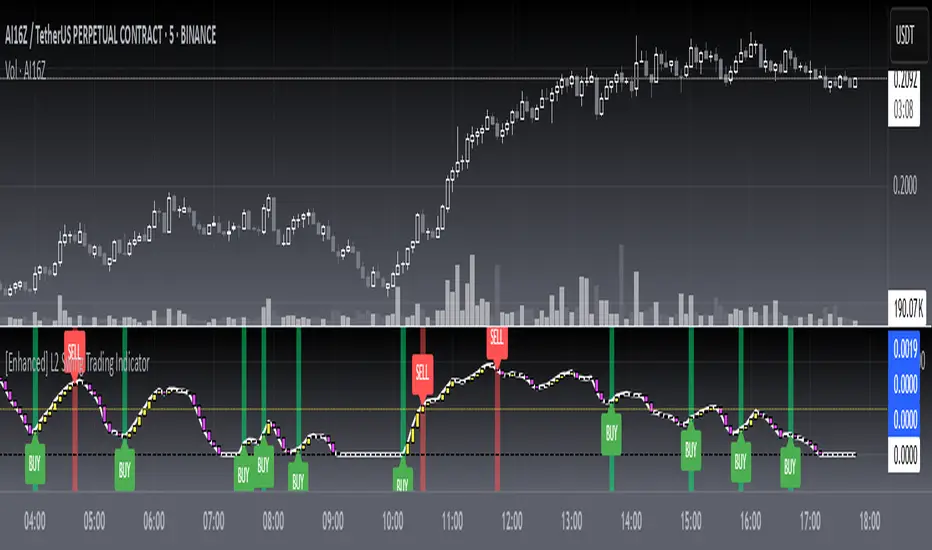
[blackcat] L2 Swing Trading IndicatorLevel: 2
Background
Swing trading is a type of trading aimed at making short to medium term profits from a trading pair over a period of a few days to several weeks. Swing traders mainly use technical analysis to look for trading opportunities. In addition to analyzing price trends and patterns, these traders can also use fundamental analysis.
Function
L2 Swing Trading Indicator
Key Signal
trend --> trend line with color candles standing for trend strength
pump --> whale pump indicator
top --> top zone for selling point
bbuy --> botton zone for buying point
varr1 ---> for selling points
bullbear --> use 50 as bull bear boundary
Pros and Cons
Pros:
1. Clear to see the trend reversals with strength changes
2. Whale pump indicator confirm the validity of trend reversals
Cons:
1. oversold zone is hidden due to using zero line as bottom
Remarks
NA
Readme
In real life, I am a prolific inventor. I have successfully applied for more than 60 international and regional patents in the past 12 years. But in the past two years or so, I have tried to transfer my creativity to the development of trading strategies. Tradingview is the ideal platform for me. I am selecting and contributing some of the hundreds of scripts to publish in Tradingview community. Welcome everyone to interact with me to discuss these interesting pine scripts.
The scripts posted are categorized into 5 levels according to my efforts or manhours put into these works.
Level 1 : interesting script snippets or distinctive improvement from classic indicators or strategy. Level 1 scripts can usually appear in more complex indicators as a function module or element.
Level 2 : composite indicator/strategy. By selecting or combining several independent or dependent functions or sub indicators in proper way, the composite script exhibits a resonance phenomenon which can filter out noise or fake trading signal to enhance trading confidence level.
Level 3 : comprehensive indicator/strategy. They are simple trading systems based on my strategies. They are commonly containing several or all of entry signal, close signal, stop loss, take profit, re-entry, risk management, and position sizing techniques. Even some interesting fundamental and mass psychological aspects are incorporated.
Level 4 : script snippets or functions that do not disclose source code. Interesting element that can reveal market laws and work as raw material for indicators and strategies. If you find Level 1~2 scripts are helpful, Level 4 is a private version that took me far more efforts to develop.
Level 5 : indicator/strategy that do not disclose source code. private version of Level 3 script with my accumulated script processing skills or a large number of custom functions. I had a private function library built in past two years. Level 5 scripts use many of them to achieve private trading strategy.
Divergence RSI [mado]Divergence screener for OBV RSI
Regular Bullish: "D" navy label
Hidden Bullish: "H" navy label
Regular Bearish: "D" red label
Hidden Bearish: "H" red label

Divergence Stoch RSI[mado]Divergence screener for Stoch RSI
Regular Bullish: "D" navy label
Hidden Bullish: "H" navy label
Regular Bearish: "D" red label
Hidden Bearish: "H" red label

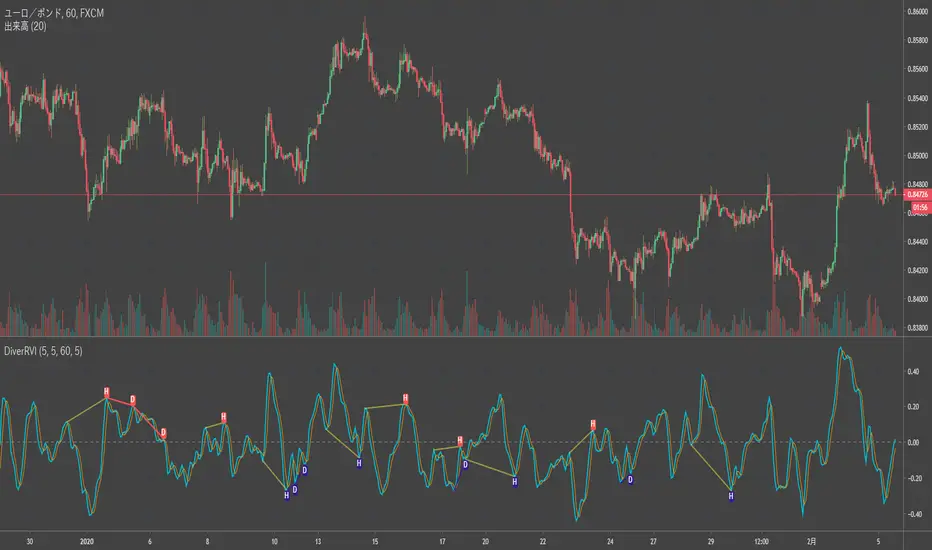
Divergence RVI[mado]Divergence screener for RVI
Regular Bullish: "D" navy label
Hidden Bullish: "H" navy label
Regular Bearish: "D" red label
Hidden Bearish: "H" red label
Divergence OBV RSI[mado]Divergence screener for OBV RSI
Regular Bullish: "D" navy label
Hidden Bullish: "H" navy label
Regular Bearish: "D" red label
Hidden Bearish: "H" red label

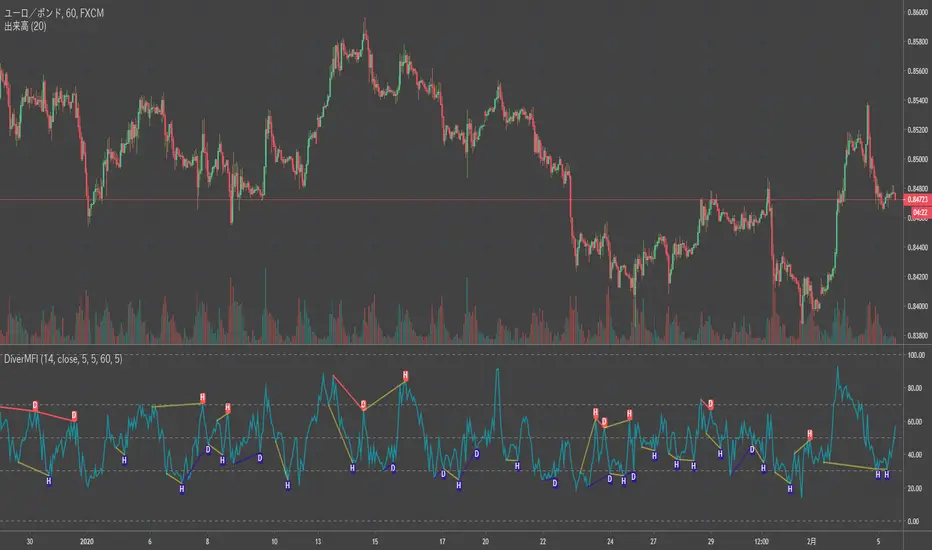
Divergence MFI[mado]Divergence screener for MFI
Regular Bullish: "D" navy label
Hidden Bullish: "H" navy label
Regular Bearish: "D" red label
Hidden Bearish: "H" red label
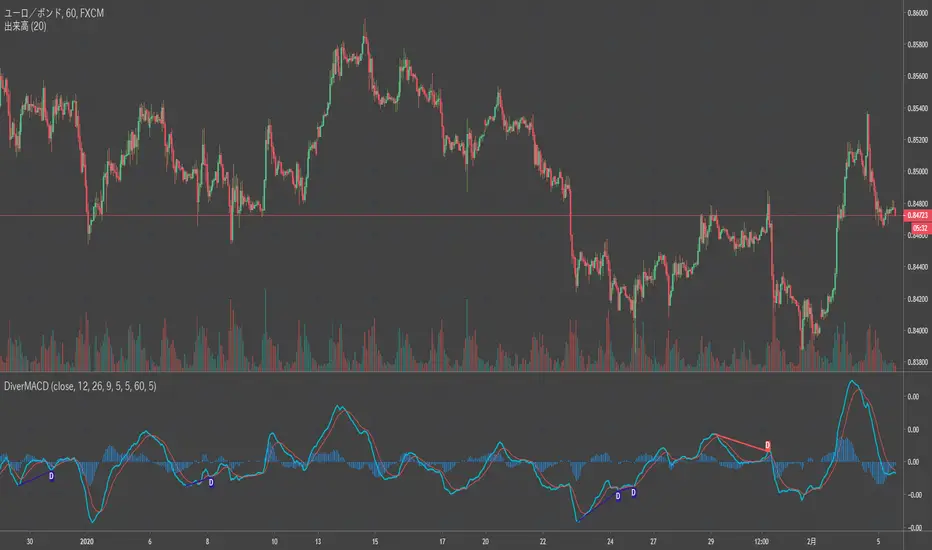
Divergence MACD [mado]Divergence screener for MACD
Regular Bullish: "D" navy label
Hidden Bullish: "H" navy label
Regular Bearish: "D" red label
Hidden Bearish: "H" red label
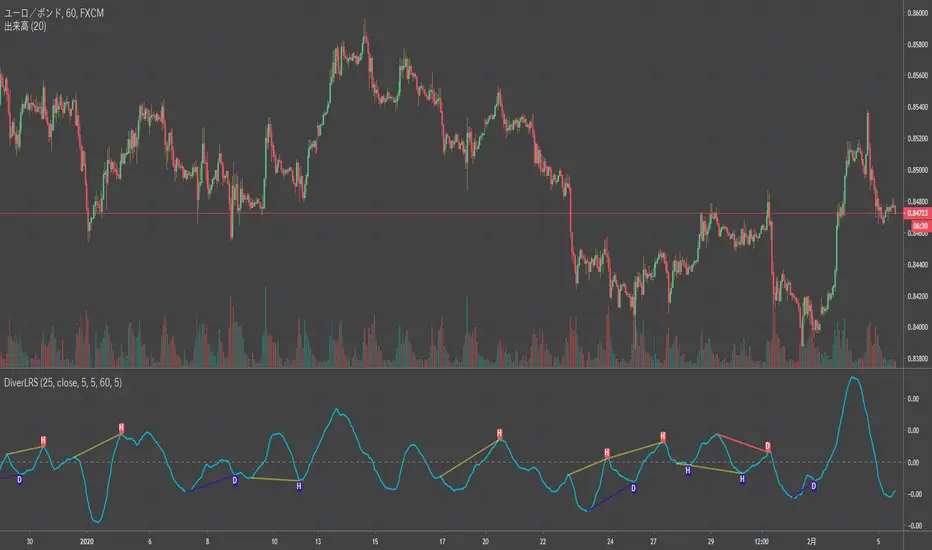
Divergence LinerRegressionSlope[mado]Divergence screener for LinerRegressionSlope
Regular Bullish: "D" navy label
Hidden Bullish: "H" navy label
Regular Bearish: "D" red label
Hidden Bearish: "H" red label
Divergence KlingerVolumeOscillator [mado]Divergence screener for KVO
Regular Bullish: "D" navy label
Hidden Bullish: "H" navy label
Regular Bearish: "D" red label
Hidden Bearish: "H" red label

Divergence CCI [mado]Divergence screener for CCI
Regular Bullish: "D" navy label
Hidden Bullish: "H" navy label
Regular Bearish: "D" red label
Hidden Bearish: "H" red label

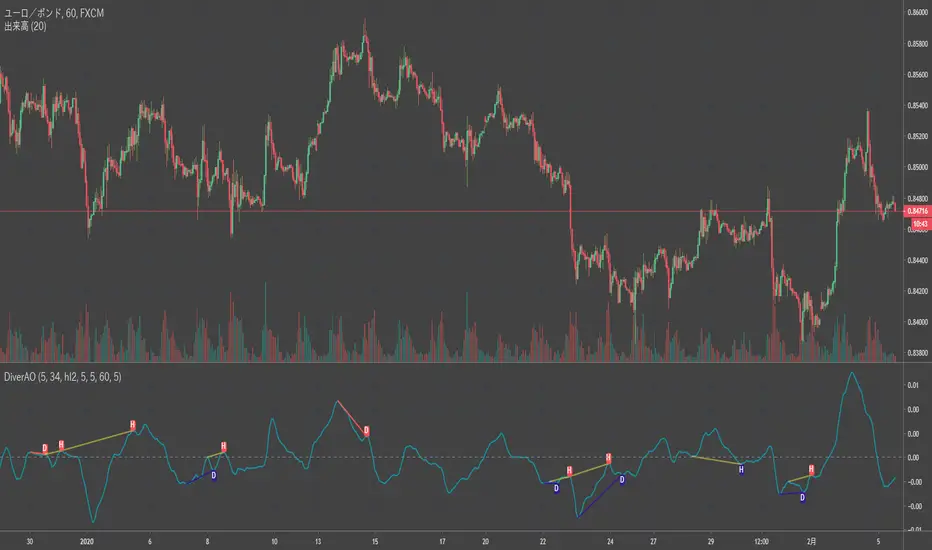
Divergence Awesome Oscillator [mado]Divergence screener for Awesome Oscillator
Regular Bullish: "D" navy label
Hidden Bullish: "H" navy label
Regular Bearish: "D" red label
Hidden Bearish: "H" red label