Bull Market Drawdowns V1.0 [ADRIDEM]Bull Market Drawdowns V1.0
Overview
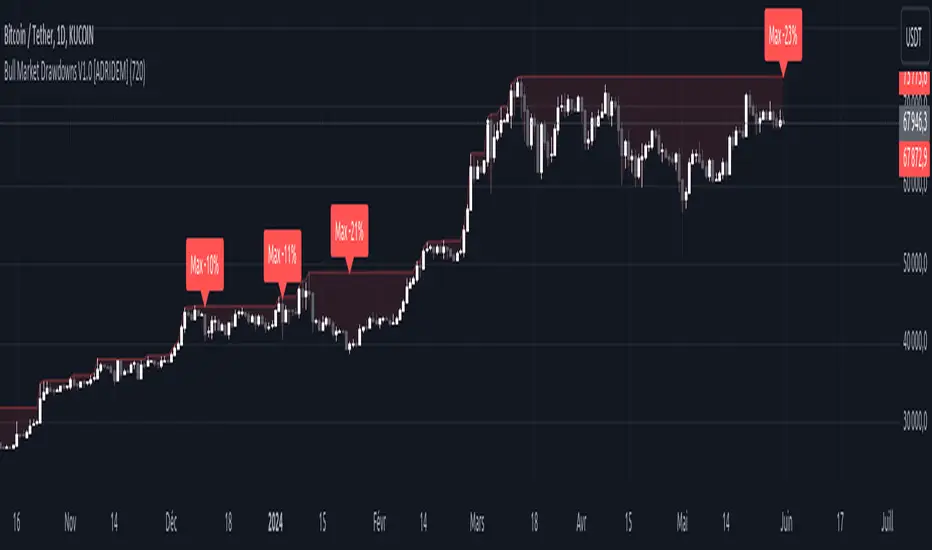
The Bull Market Drawdowns V1.0 script is designed to help visualize and analyze drawdowns during a bull market. This script calculates the highest high price from a specified start date, identifies drawdown periods, and plots the drawdown areas on the chart. It also highlights the maximum drawdowns and marks the start of the bull market, providing a clear visual representation of market performance and potential risk periods.
Unique Features of the New Script
Default Timeframe Configuration: Allows users to set a default timeframe for analysis, providing flexibility in adapting the script to different trading strategies and market conditions.
Customizable Bull Market Start Date: Users can define the start date of the bull market, ensuring the script calculates drawdowns from a specific point in time that aligns with their analysis.
Drawdown Calculation and Visualization: Calculates drawdowns from the highest high since the bull market start date and plots the drawdown areas on the chart with distinct color fills for easy identification.
Maximum Drawdown Tracking and Labeling: Tracks the maximum drawdown for each period and places labels on the chart to indicate significant drawdowns, helping traders identify and assess periods of higher risk.
Bull Market Start Marker: Marks the start of the bull market on the chart with a label, providing a clear reference point for the beginning of the analysis period.
Originality and Usefulness
This script provides a unique and valuable tool by combining drawdown analysis with visual markers and customizable settings. By calculating and plotting drawdowns from a user-defined start date, traders can better understand the performance and risks associated with a bull market. The script’s ability to track and label maximum drawdowns adds further depth to the analysis, making it easier to identify critical periods of market retracement.
Signal Description
The script includes several key visual elements that enhance its usefulness for traders:
Drawdown Area : Plots the upper and lower boundaries of the drawdown area, filling the space between with a semi-transparent color. This helps traders easily identify periods of market retracement.
Maximum Drawdown Labels : Labels are placed on the chart to indicate the maximum drawdown for each period, providing clear markers for significant drawdowns.
Bull Market Start Marker : A label is placed at the start of the bull market, marking the beginning of the analysis period and helping traders contextualize the drawdown data.
These visual elements help quickly assess the extent and impact of drawdowns within a bull market, aiding in risk management and decision-making.
Detailed Description
Input Variables
Default Timeframe (`default_timeframe`) : Defines the timeframe for the analysis. Default is 720 minutes
Bull Market Start Date (`start_date_input`) : The starting date for the bull market analysis. Default is January 1, 2023
Functionality
Highest High Calculation : The script calculates the highest high price on the specified timeframe from the user-defined start date.
```pine
var float highest_high = na
if (time >= start_date)
highest_high := na(highest_high ) ? high : math.max(highest_high , high)
```
Drawdown Calculation : Determines the drawdown starting point and calculates the drawdown percentage from the highest high.
```pine
var float drawdown_start = na
if (time >= start_date)
drawdown_start := na(drawdown_start ) or high >= highest_high ? high : drawdown_start
drawdown = (drawdown_start - low) / drawdown_start * 100
```
Maximum Drawdown Tracking : Tracks the maximum drawdown for each period and places labels above the highest high when a new high is reached.
```pine
var float max_drawdown = na
var int max_drawdown_bar_index = na
if (time >= start_date)
if na(max_drawdown ) or high >= highest_high
if not na(max_drawdown ) and not na(max_drawdown_bar_index) and max_drawdown > 10
label.new(x=max_drawdown_bar_index, y=drawdown_start , text="Max -" + str.tostring(max_drawdown , "#") + "%",
color=color.red, style=label.style_label_down, textcolor=color.white, size=size.normal)
max_drawdown := 0
max_drawdown_bar_index := na
else
if na(max_drawdown ) or drawdown > max_drawdown
max_drawdown := drawdown
max_drawdown_bar_index := bar_index
```
Drawdown Area Plotting : Plots the drawdown area with upper and lower boundaries and fills the area with a semi-transparent color.
```pine
drawdown_area_upper = time >= start_date ? drawdown_start : na
drawdown_area_lower = time >= start_date ? low : na
p1 = plot(drawdown_area_upper, title="Drawdown Area Upper", color=color.rgb(255, 82, 82, 60), linewidth=1)
p2 = plot(drawdown_area_lower, title="Drawdown Area Lower", color=color.rgb(255, 82, 82, 100), linewidth=1)
fill(p1, p2, color=color.new(color.red, 90), title="Drawdown Fill")
```
Current Maximum Drawdown Label : Places a label on the chart to indicate the current maximum drawdown if it exceeds 10%.
```pine
var label current_max_drawdown_label = na
if (not na(max_drawdown) and max_drawdown > 10)
current_max_drawdown_label := label.new(x=bar_index, y=drawdown_start, text="Max -" + str.tostring(max_drawdown, "#") + "%",
color=color.red, style=label.style_label_down, textcolor=color.white, size=size.normal)
if (not na(current_max_drawdown_label))
label.delete(current_max_drawdown_label )
```
Bull Market Start Marker : Places a label at the start of the bull market to mark the beginning of the analysis period.
```pine
var label bull_market_start_label = na
if (time >= start_date and na(bull_market_start_label))
bull_market_start_label := label.new(x=bar_index, y=high, text="Bull Market Start", color=color.blue, style=label.style_label_up, textcolor=color.white, size=size.normal)
```
How to Use
Configuring Inputs : Adjust the default timeframe and start date for the bull market as needed. This allows the script to be tailored to different market conditions and trading strategies.
Interpreting the Indicator : Use the drawdown areas and labels to identify periods of significant market retracement. Pay attention to the maximum drawdown labels to assess the risk during these periods.
Signal Confirmation : Use the bull market start marker to contextualize drawdown data within the overall market trend. The combination of drawdown visualization and maximum drawdown labels helps in making informed trading decisions.
This script provides a detailed view of drawdowns during a bull market, helping traders make more informed decisions by understanding the extent and impact of market retracements. By combining customizable settings with visual markers and drawdown analysis, traders can better align their strategies with the underlying market conditions, thus improving their risk management and decision-making processes.
ابحث في النصوص البرمجية عن "BULL"
Bulls And Bears [CHE]This Pine Script™ indicator, Bulls And Bears , aims to provide traders with potential entry points by analyzing market conditions. Here's how it works:
Calculation of Maximum and Minimum Values: The script calculates the highest and lowest values based on the high, open, close, and low prices of the asset.
Relative Strength Index (RSI) Condition: It evaluates whether the RSI value (with a period of 14) is above 50, indicating bullish momentum.
Bullish and Bearish Conditions: Based on the calculated maximum and minimum values, along with the RSI condition, it determines bullish and bearish conditions. If the current maximum value is higher than the previous maximum and the RSI condition is met, it suggests a bullish condition. Conversely, if the current maximum value is lower than the previous maximum and the RSI condition is not met, it suggests a bearish condition.
Super Smoother Function: This function is used to calculate a smoother moving average, reducing noise in the data.
Input Parameters: Traders can adjust the "Length Difference" and "Length threshold" parameters to customize the indicator according to their trading preferences.
Calculation of Super Smooth Moving Averages: The script calculates super smooth moving averages for both bullish and bearish conditions.
Plotting: It plots the super smooth moving averages on the chart, indicating potential entry points for bullish (green) and bearish (red) conditions.
Filling Areas: It fills the areas between the moving averages and the threshold line based on the conditions. Green filling represents bullish conditions, while red filling represents bearish conditions.
By using this indicator, traders can potentially identify favorable entry points based on market conditions, helping them make informed trading decisions.

Bull Vs Bear Visible Range VP [Kioseff Trading]Hello!
This Script “Bull vs Bear Visible Range VP” Calculates Bull & Bear Volume Profiles for the Visible Range Alongside a Delta Ladder for the Visible Period!
Features
Volume Profile Anchored to Visible Range
Delta Ladder Anchored to Visible Range
Bull vs Bear Profiles!
Standard Poc and Value Area Lines, in Addition to Separated POCs and Value Area Lines for Bull Profiles and Bear Profiles
Configurable Value Area Target
Curved Profiles
Up to 9999 Profile Rows per Visible Range
Stylistic Options for Profiles
This Script Generates Bull vs. Bear Volume Profiles for the Visible Range!
Up to 9999 Volume Profile Levels (Price Levels) Can Be Calculated for Each Profile, Thanks to the New Polyline Feature, Allowing For Less Aggregation / More Precision of Volume at Price and Volume Delta.
Bull vs Bear Profiles
The Image Above Shows Primary Functionality!
Green Profiles = Buying Volume
Red Profiles = Selling Volume
Bullish & Bearish Pocs for the Visible Range Are Displayable!
Profiles Can Be Anchored on the Left Side for a More Traditional Look.
The indicator is robust enough to calculate on "small price periods", or for a price period spanning your entire chart fully zoomed out!
That’s About It :D
This Indicator Is Part of a Series Titled “Bull vs. Bear” - A Suite of Profile-Like Indicators I Will Be Releasing Over Coming Days. Thanks for Checking This Out!
If You Have Any Suggestions Please Feel Free to Share!

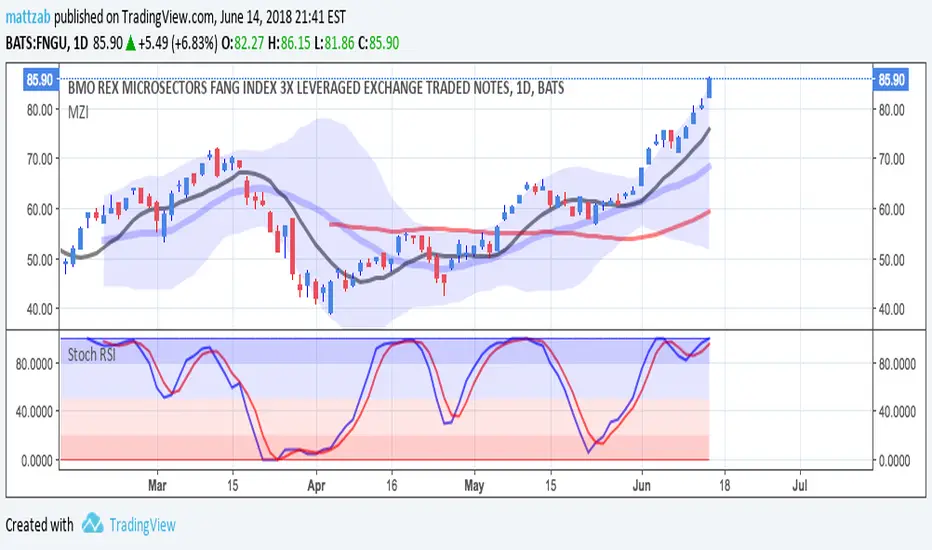
Bullish Divergence Short-term Long Trade FinderThis script is a Bullish divergence trade finder built to find small periods where Bitcoin will likely rise from. It looks for bullish divergence followed by a higher low as long as the hour RSI value is below the 40 mark, if then it will enter an long. It marks out Buy signals on the RSI if the value dips below 'RSI Bull Condition Minimum' (Default 40) on the current time frame in view. It also marks out Sell signals found when the RSI is above the 'RSI Bearish Condition Minimum' (Default 50). The sell signals are bearish divergence that has occurred recently on the RSI. When a long is in play it will sell if it finds bearish divergence or the time frame in view reaches RSI value higher than the 'RSI Sell Value'(Default 75). You can set your stop loss value with the 'Stop loss Percentage' (default 5).
Available inputs:
RSI Period: relative strength measurement length(Typically 14)
RSI Oversold Level: the bottom bar of the RSI (Typically 30)
RSI Overbought Level: the top bar of the RSI (Typically 70)
RSI Bearish Condition Minimum: The minimum value the script will use to look for a pivot high that starts the Bearish condition to Sell (Default 50)
RSI Bearish Condition Sell Min: the minimum value the script will accept a bearish condition (Default 60)
RSI Bull Condition Minimum: the minimum value it will consider a pivot low value in the RSI to find a divergence buy (Default 40)
Look Back this many candles: the amount of candles thee script will look back to find a low value in the RSI (Default 25)
RSI Sell Value: The RSI value of the exit condition for a long when value is reached (Default 75)
Stop loss Percentage: Percentage value for amount to lose (Default 5)
The formula to enter a long is stated below:
If price finds a lower low and there is a higher low found following a lower low and price has just made another dip and price closes lower than the last divergence and Relative strength index hour value is less than 40 enter a long.
The formula to exit a long is stated below:
If the value drops below the stop loss percentage OR (the RSI value is greater than the value of the parameter 'RSI Sell Value' or bearish divergence is found greater than the parameter 'RSI Bearish Condition Minimum' )
This script was built from much strategy testing on BTC but works with alts (occasionally) also. It is most successful to my knowledge using the 15 min and 7 min time frames with default values. Hope it helps! Follow for further possible updates to this script or other entry or exit strategies.
snapshot:
I only have a Pro trading view account so I cannot share a larger data set about this script because the buy signals happen pretty rarely. The most amount that I could find within a view for me was 40 trades within a viewable time. The suggested/default parameters that I have do not occur very often so it limits the data set. Adjustments can be made to the parameters so that trades can be entered more often. The scripts success is dependent on the values of the parameters set by the user. This script was written to be used for BTC/USD or BTC/USDT trading. I am unable to share a larger dataset without putting out results that are intended to fail or having a premium account so reaching the 100 trade minimum is not possible with my account.

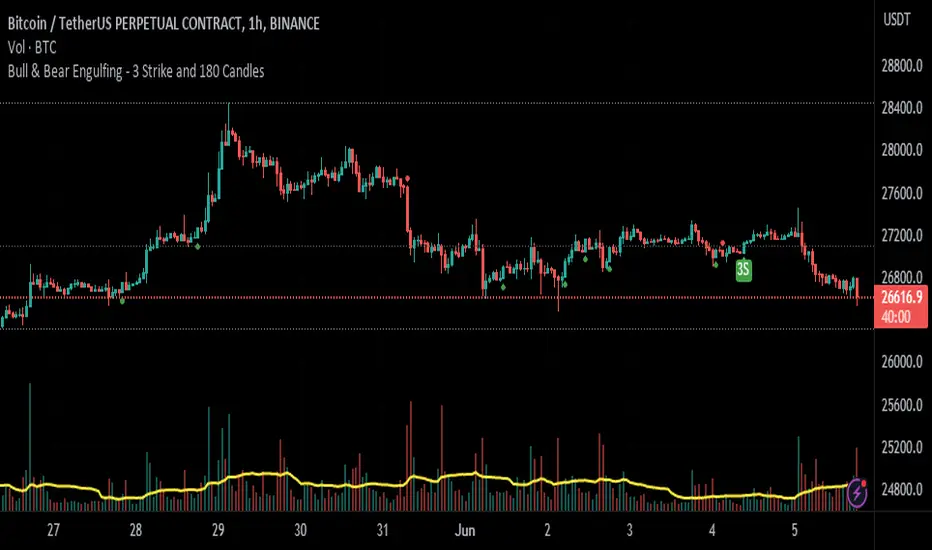
Bull & Bear Engulfing - 3 Strike and 180 CandlesHello, SenatorVonShaft here.
This indicator shows 3 differend candlestick formations:
1- Bullish & Bearish Engulfing Candle
2- Bullish & Bearish 3 Strike Candle
3- Bullish & Bearish 180 Degree Candle
It has 3 variables
1- Bar Fullness - Differs from %50 - %100 showing 1 candle's fullness
2- Avg. Backwds Candls - Gets the average weight of the backward candles
3- Avg. Bar Height Multiplier - This variable is multiplied by above value to determine engulfing candles.
Plots:
- Green & Red Arrows Only : Shows Bullish & Bearish engulfing candles
- Green & Red 180 : Shows a bullish or bearish engulfing candle taken over by a bigger opposite candle
- Green & Red 3S : Shows bullish & bearish 3 strike candle formation
Please feel free to comment your thoughts below.
See you.
Bull Bear Correlation Tracker PaneThe Bull Bear Correlation Tracker is a versatile indicator designed to help traders identify the direction and strength of market trends by comparing the price action of multiple assets. It is particularly useful for those who are familiar with the carry trade principle, as it can detect when positively or negatively correlated assets move in favor or against the asset being traded. This indicator can be used for various markets, including crypto and forex, by simply adjusting the default options.
Key features of the Bull Bear Correlation Tracker include:
Multiple methods for determining trend direction: Supertrend, Pivot Point SuperTrend by LonesomeTheBlue, MACD - Zero Cross, and MACD - Grow/Shrink. These methods help traders identify the primary trend direction and potential trade opportunities.
Optional slow trend display for additional insights into market trends, allowing traders to analyze both short-term and long-term trends simultaneously.
Supports up to three symbols, enabling traders to analyze multiple assets simultaneously and better understand their correlation.
Assumed correlation settings to test traders' hypotheses about asset relationships, allowing traders to make informed decisions about potential correlations between different assets.
Customizable correlation period and smoothing settings to fine-tune the indicator's performance, providing traders with the ability to optimize the indicator based on their preferred trading style and market conditions.
Market hours filter to focus on specific trading hours, ensuring that the indicator only displays data during the hours specified.
Customizable color settings for easy visualization of trends, helping traders quickly identify the direction and strength of market trends.
Correlation histogram display to visualize asset relationships, providing traders with a clear visual representation of how different assets are correlated.
This indicator can be used to either force the correlation to be assumed positive or negative if the trader knows the correlation, or to use the actual data calculated between the traded asset and other assets if the correlation is broken often. This flexibility makes the Bull Bear Correlation Tracker suitable for trading various assets, including cryptocurrencies and forex, as well as for traders with different levels of experience.
By utilizing the Bull Bear Correlation Tracker, traders can gain valuable insights into market trends and correlations between different assets, helping them make more informed decisions and improve their trading strategies.
Note: I used back-testing for fine tuning do not base your trades on signals from the testing framework.

Bulls v BearsThis script helps you identify the relative strength of bulls and bears in the market. It calculates the difference between the high and the moving average for bulls, and the difference between the moving average and the low for bears. Then it normalizes the values between -100 and 100 using the highest and lowest values of the last "bars back" periods. This allows you to compare the current strength of bulls and bears relative to their historical strength.
The output of the script is a colored column chart that represents the difference between the normalized bulls and bears values. If the chart is mostly green, it means the bulls are currently stronger than the bears, and vice versa for a mostly red chart. Additionally, the script provides bullish and bearish signals based on when the normalized bulls cross above or below the user-defined "Line Height" value.
You can use this script to help you identify potential trend changes in the market, as well as to confirm existing trends.

Bull Trend Filtered StochRSI (BTFS)Ride Bull Trends Via Stochastic with Special Rules for Heavy Bullish Bias
TLDR: Long Only Trend Indicator Where you are always entered Long if the stochastic is over the lower band line and the price is above the Donchian Chanel high. Exit when Stochastic RSI is below the lower band.
Indicators:
Filter = Trend/Bullish indicator is Donchian of ema(high) this is set as the highest ema(high, 6) in the last 30 candles. this can be adjusted to fit the market as desired.
**indicator prints green background when the filter condition is satisfied***
Entry Exit = enter when the Stoch RSI is above the given lower trend band. This value is set at 35 but can be adjusted according to risk tolerance and market conditions.
Logic:
this indicator allows a trader to be present during bullish/parabolic trends by only triggering if the close is > than the highest 6 candle average high over the last 30 candles. This filter requires the market to be in a generally bullish posture. If the market is in this condition the stochastic RSI indicator value offers a good gauge of price action and only goes significantly down if price trends below the average range of the rsi period. This filters out noise and keeps a trader from over trading on inconsequential corrections while responding fairly quickly to changes in general trend direction. the response is fast enough to produce an unprofitable amount of false signals if the bull market filter is not implemented. However when used in combination the signals return desirable results in bull trending markets.
Hope this Helps. Happy Trades.
-Snarky Puppy

Bull Bear Power VoidThere are a million oscillators out there based on volume. My biggest problem with them is that they simply tell you whether you have volume to the upside or volume to the down side. it's kind of tricks you with the lack of information into thinking you have a change in your trend or that you're going to be able to break out of a range across a moving average or through some trend line or support and resistance.
However many of these Oscillators are failing because they lacked to tell you one key thing. they tell you that you have volume but they never tell you if it's enough volume.
Even a popular indicator like the MACD can have its MACD Line crossing upwards over the signal, telling you that you have an uptrend but again it's still failing to give you the results of how much volume you have and is it enough volume in that crossover. It boils down to the one key fact that with out volume there is no momentum. This should be able to make trading crossovers a lot easier.
So in today's video I'm going to show you the newest addition to the trading View Community Scripts and it is called,
"The Bull Bear Void Volume Oscillator"
From my own testing, this oscillator can predict weather the next candle will get you the move you need or not.
In the markets you cannot have anything good without volume. after you have volume you have momentum. you cannot have momentum without volume and this is the key thing that causes people to fail when they look for breakouts, trend reversals, or if they're wondering whether this move is a fake out.
This indicator is based on the study volume spread analysis or VSA.
This indicator is designed to be paired perfectly with the Heiken Ashi Algo oscillator.
www.INSERTA-LINK-HERE.com
This indicator is strictly to be used as a confirmation indicator and not to be used by itself to tell you when to buy or sell.
what are its parts.
The void
is a bullish and bearish Cloud that appear extending from the center of words and the center down words. This is the average range of volume. anything that appears to close inside of this void is usually a ranging volume and it is not enough to break the trend or break out.
The MACD and MACD Signal Line
Just like using the macd these two lines indicate whether the trend is moving up for the trend is moving down
The Colored Columns
RED Column - Indicates volume movie downward
Light Red - indicates volume is pulling back from a downward move
Green - indicates volume is moving upwards
Light Green - indicates volume is moving down from an outboard move
Rules for a SELL CONFIRMATION TRADE
The macd line must be underneath the signal line and the macd line must be below the midline.
A bullish column must appear below the midline and it must extend outside of the red void.
if you are using the heikin-ashi Aldo oscillator you must also have a red heiken Ashi candle close below -10.
To do a by trade you simply reverse the rules.

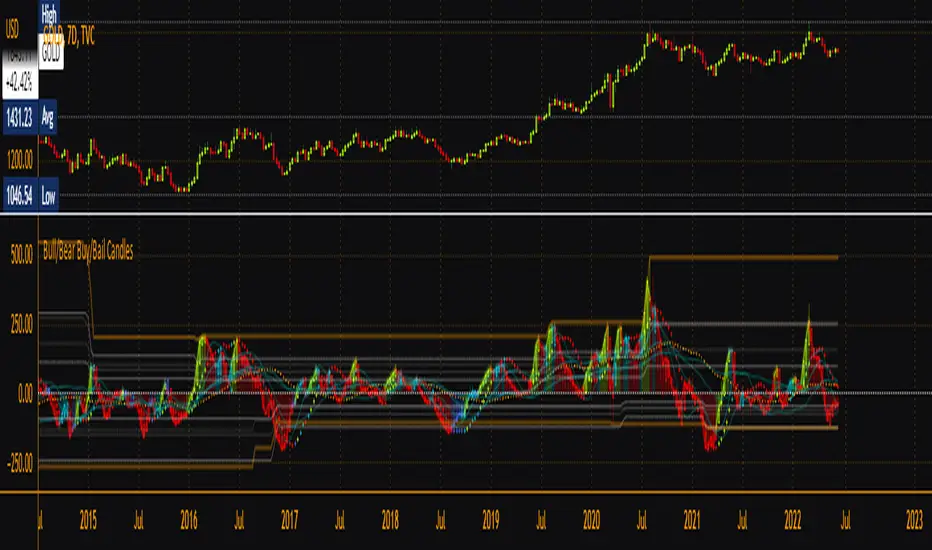
Bull/Bear Buy/Bail CandlesBased on BullBearPower indicator, this is a heavily modified version with colored candles to show when bulls or bears are buying or bailing. Includes Fibonacci Levels based on Highest/Lowest value in variable length, along with optional second timeframe and alternative calculation for candles and linear regression curves for increased versatility. Green = bullish /long, Aqua = still-bullish albeit weakening, blue = weak albeit strengthening and red = weak/short. Perfect as a confirmation indicator for those looking to time markets.
Bull& Bear Bars Count/CalculatorIn bull trend, bull bars are more than bear bars and vice versa.
More important, if the bull/bear bars are more continuous, the trend is typically stronger.
So, if the bars amount is visualized, it would be much more easier to identify the unfolding trend in front of you.
This indicator shows you the amount of bull/bear bars by columns.
The higher the column, the bars are more continuous, the trend is stronger.

Bull Call Spread Entry StrategyThis strategy script uses the "Spread Entry Strength" overlay indicator script I designed to show entry timing optimized for an Option Bull
Call Spread.
As for this strategy...
The defaults for the strategy itself are as follows:
Period for strategy: 1/1/18 to 12/1/2021. This can be changed to a different period using the settings.
Condition for entry:
Bull Spread Entry Strength >= "Overlay Signal Strength Level"
Limit entry is used, price must be <= close when signaled
Entry occurs by next day or the order is cancelled
Condition for exit (uses a timed exit):
Bars passed since order entry >= 30 (6 weeks..~42 calendar days)
Thursday (day before "option" expiration date... assuming weekly options exist)
All of the user settings from the overlay are pulled into this for customization purposes. Details of the actual Spread Entry Strength overlay are as follows (copied from my shared indicator):
2 background shadings will occur:
The background will shade blue if the ticker is prime for a Bullish Call spread.
The background will shade purple if the the ticker is prime for a Bearish Put spread.
In theory, if the SE Strength is at one of the extremes of the Bear or Bull side, then a spread is prime for entry.
To calculate this, 8 conditions receive a 1 or zero dependent on whether the condition is true (1) or false (0), and then all of those are summed. The primary gist of the strength comes from Nishant's book, or my interpretation thereof, with some additives that limits what I need to review (such as condition 8 below.)
The 8 Bull Conditions are:
1) Bollinger Bands are outside of the Keltner Channels
2) ADX is trending up
3) RSI is trending up
4) -DI is trending down
5) RSI is under 30
6) Price is below the lower Keltner Channel
7) Price is between the lower Bollinger Band and the Bollinger basis.
8) Price at one point within the last 5 bars was below the lower Bollinger Band
The 8 Bear Conditions are the inverse conditions (except the first):
1) Bollinger Bands are outside of the Keltner Channels
2) ADX is trending down
3) RSI is trending down
4) +DI is trending up
5) RSI is over 70
6) Price is above the upper Keltner Channel
7) Price is between the upper Bollinger Band and the Bollinger basis.
8) Price at one point within the last 5 bars was above the upper Bollinger Band
There is a "market noise" filter that will filter out shading when another market move is considered, i.e. if you don't want to see the potential trade when QQQ moves more than 1% then do the following in the settings:
Check "Market Filter"
Enter QQQ in the "Market Ticker To Use"
Enter 1 in the "Market Too Hot Level"
Press Ok
Obviously, the same holds true for the "Market Too Cool Filter."
Second release notes:
Overlay Signal Strength Level - You can set your own "level" for the overlay in the settings, instead of having to change the script code itself. I have the default set to 6. A lower number shows more overlays, a higher number shows fewer (i.e. more conditions have been met.).
Provide Narrative (Troubleshooting) - Narrative label created with several outputs that will show after the last bar. This narrative needs to be turned on in the settings, as the default is "off" ... unchecked.
Remove Strength Indicator When Squeezed - when checked no overlays will be produced regardless of "scoring." Default is off.
Show Squeezes (Will Override Indicator When Concurrent) - overlays an orange background when the ticker is in a squeeze. I am still working on the accuracy here, but it's usable. This will override the strength indicator as well. This needs to be turned on, if you want it.
Short SMA Period - period used to calculate the short SMA, used in the narrative only, at this point in time.
Medium SMA Period - period used to calculate the medium SMA, used in the narrative only, at this point in time.
Long SMA Period - period used to calculate the medium SMA, used in the narrative only, at this point in time.
Outside of the settings... a few calculation adjustments here and there have occurred and some color shading adjustments to allow for the adjustable level setting.

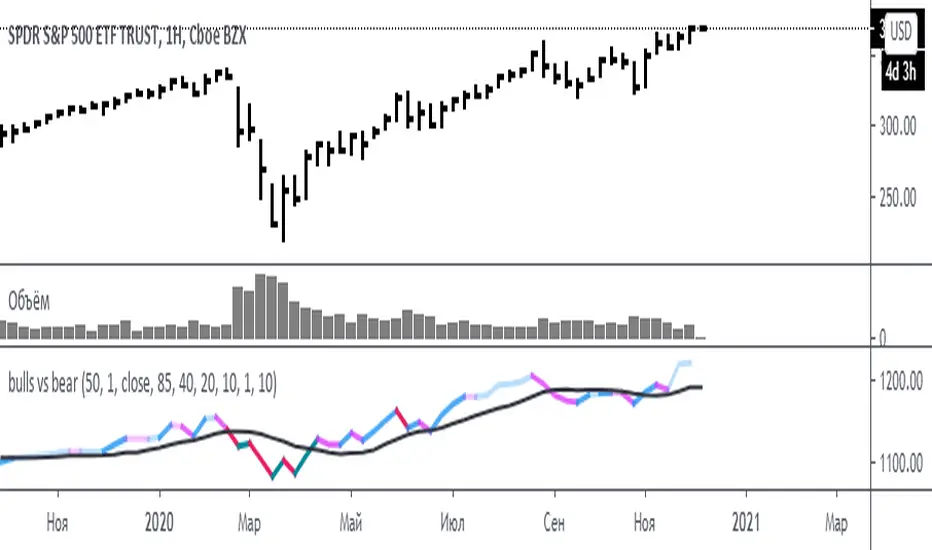
bulls vs bear for VSA(Google translation from Russian.)
This indicator is based on the efficiency of bulls and bears for VSA and has the same parameters.
Its only difference is that all the values of the efficiency of bulls and bears for VSA indicator are sequentially added here.
I want to note that the Period spread - Bars from close to close argument was made for experimental purposes, and shows interesting results for values 3-4-5, in theory this is not very logical. Because then the estimate of the spread for this interval (3-4-5) will be divided by the estimate of the volume of the current bar.
Also added here is a moving average with a default period of 10 - theoretically, if the indicator is above the moving average - the initiative is behind the bulls - if below - the initiative is behind the bears.
It is recommended to use this indicator with the indicator:
efficiency of bulls and bears for VSA
Volume on bar VSA - indicator V2
Russian language.
Этот индикатор сделан на основе efficiency of bulls and bears for VSA и имеет такие же параметры.
Единственное отличие его в том, что тут последовательно складываются все значения индикатора efficiency of bulls and bears for VSA .
Хочу отметить, что аргумент Period spread - Bars from close to close (Период спреда - Баров от закрытия до закрытия) сделан в экспериментальных целях, и показывает интересные результаты на значения 3-4-5, в теории это не очень логично. Потому-что тогда будет делиться оценка спреда за этот интервал (3-4-5), на оценку величины объема текущего бара.
Также тут добавлена скользящая средняя с периодом по умолчанию 10 – теоретически, если индикатор над скользящей средней – инициатива за быками – если ниже – инициатива за медведями.
Это индикатор рекомендуется использовать с индикатором:
efficiency of bulls and bears for VSA
Volume on bar VSA - indicator V2
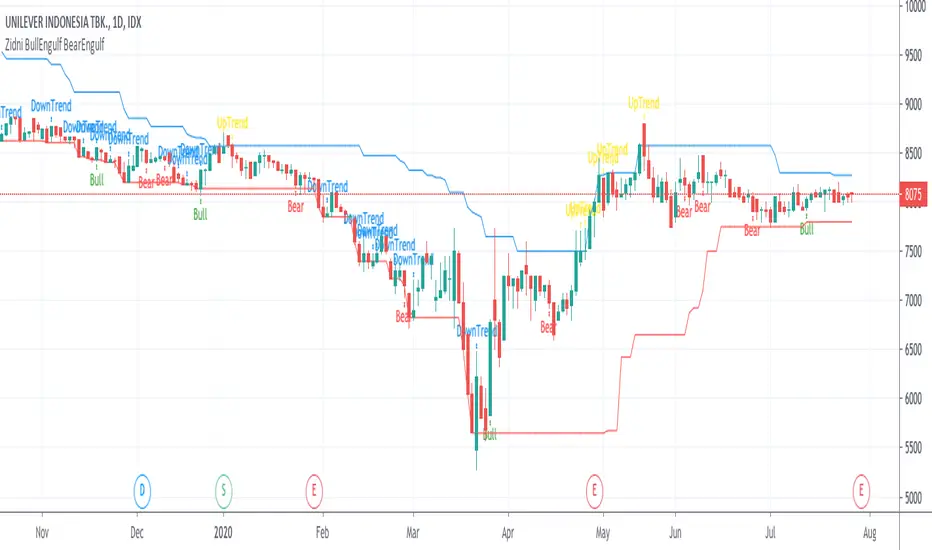
Zidni BullEngulf BearEngulfBullish Engulfing candle that considers the length of the candle and the position of the candle in a downtrend.
Bearish Engulfing candle that considers the length of the candle and the position of the candle in an uptrend.
Bulls vs BearsThe script measures relative strenth of bull bars vs bear bars that complete the next rules:
1) rising price with rising volume calculates as bullish only if the next candle is higher
2) falling price with falling volume calculates as bullish only if the next candle is higher
3) rising price with falling volume calculates as bearish only if the next candle is lower
4) falling price with rising volume calculates as bearish only if the next candle is lower
examples
ethusdt
shitperp
bsvusdt
btcusdt

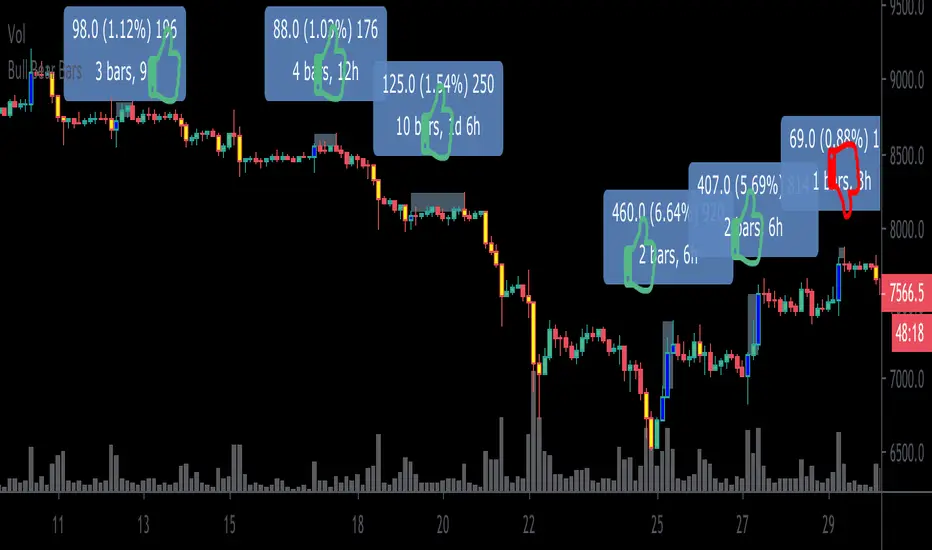
Bull Bear BarsHighlights when the movement of a candle is supported by a major increase in volume. Thus one could reasonably assume that a follow thru is likely to occur.
Blue= bullish
Yellow = bearish
I personally use this as an entry system. I enter only if the blue high or yellow low is surpassed by the very next candle , if not, then i do not enter. Thus trading with momentum and greatly avoiding choppy market conditions.
***Example*** In the chart above, during $XBT’s month long November 2019 Downtrend.. I am showing my bull long entries (without showing the obvious winning bear entries!) and found that only once did the price fail to advance less than 1% before any significant drawdown occurs (As shown on the chart by thumbs up & thumbs down symbols.)
***When using this indicator it is important to keep in mind that Blue bullish bars can and will appear at the top of upswings likewise, yellow bearish bars can and will appear at the bottom of downswings.. which could potentially signify trend reversals.
This knowledge can also can be used to ones advantage (” buy when everyone is selling, sell when everyone is buying.”)
This is a common occurrence because retail traders are often late to the party before they catch on to a trend resulting in buying heavily at the top and selling heavily at the bottom providing liquidity to earlier entrants to exit and as per usual the price then reverses on the mass of late bloomers.***
This indicator can be used in many different ways so goodluck in finding the method that best suits your style and be careful out there. Cheers
BONUS: Also has the ability to set alerts!
Bulls vs BearsA tool with the purpose for better insight of bulls/bears influence.
The center, more bright part are the open-close prices, filled green if bullish, red if bearish.
The transparent red and green part, above and below, are the "wick/shadow" area's.
If for example the bears push the price down, far under the open, but the bulls push it right back, so you'll have a large wick,
this will be visible as a large transparent green area below the brighter open-close center area.
Hope this helps!
Bull/Bear CandleThis script identifies whether the current and previous candle is bullish, bearish or neutral. Bullish candles are displayed with a green triangle, bearish with a red, and neutral with a yellow. The bull/bear cut off is set at 65% but this is adjustable to your taste.
Bull/Bear CandleThis script will display a small triangle under the latest two candles to indicate whether that candle is bullish or bearish based on the following definition.
A bullish candle closes in the top portion of the trading range of the candle while a bearish candle closes in the bottom portion of the trading range of the candle.
The cutoff is currently set at 65% (you can adjust it) so the close must be outside or equal to 65% of the trading range to be considered bullish or bearish. If less than 65% the triangle will indicate a neutral candle.
Colours are;
green triangle = bullish candle
red triangle = bearish candle
yellow triangle = neutral candle
I hope this helps those using TraderCobb's cradle strategy.
Bull Bear Stoch RSIStandard Stoch RSI with some color modification. 0 - 20 = Really Bearish (Dark Red Zone) 20 - 50 = Bearish (Light Red Zone) 50 - 80 = Bullish (Light Blue Zone) and 80 - 100 = Really Bullish (Strong Blue Zone). Thick lines at top and bottom to easily see 100 and 0.
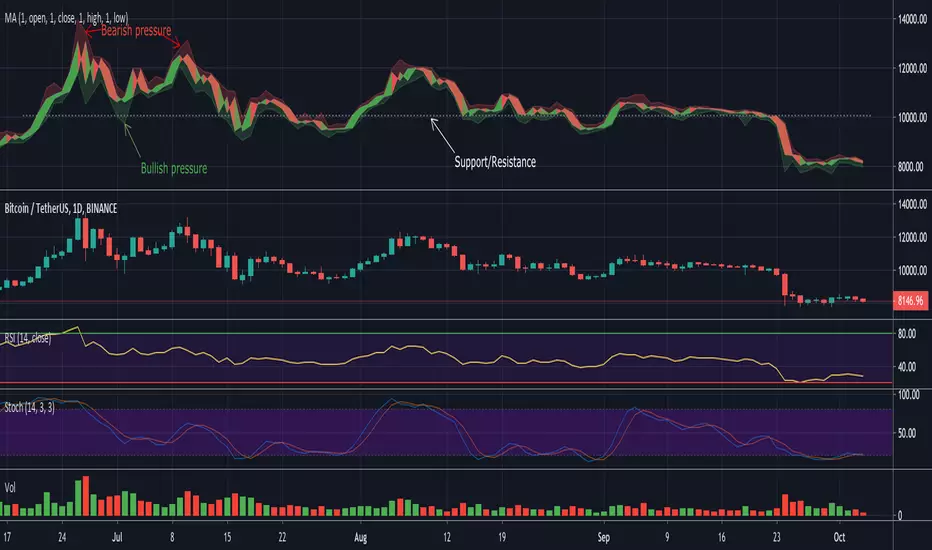
Elder Ray Composite DOA hybrid representation of Elder Ray's Bear/Bull as an oscillator, using TEMA and LRC calculations to average out the signals. The Oscillation is based off of the Derivative oscillator. This gives an interesting interpretation of Bear vs Bull power. Give it a try!

BULLISH!! Low High Range Options HelperThis indicator is designed for range-based options trading, where price tends to rotate between a defined low and high rather than trend continuously. Its purpose is not to tell you what to trade, but to provide context for timing, specifically answering the question: if price is at a discount here, how much time should an option realistically have?
The script identifies a recent price range and plots three key levels. The range high represents the upper boundary of recent price action and often acts as a take-profit or resistance area. The range mid is the 50 percent equilibrium of the range and is intended as a confirmation level rather than an entry signal. The range low represents the discount zone, where risk is best defined for bullish options trades. This is the only area where options guidance is displayed.
When price touches the range low, the indicator calculates how long similar range rotations have taken in the past, adjusts that timing to the current chart timeframe, and applies a safety factor to reduce the risk of under-timing an options position. It then displays a suggested days-to-expiration label, such as 3 DTE, 4 DTE, 5 DTE, 6 DTE, 7 DTE, 10 DTE, or 14 plus. Shorter DTE values reflect faster expected rotations, while longer DTE values reflect slower, choppier, or more uncertain conditions. The goal is to help avoid the common mistake of buying options that do not have enough time to work.
A typical way to use this tool is to identify a clearly defined range, wait for price to reach the range low, note the DTE guidance shown on the chart, then wait for confirmation such as a reclaim of the range midpoint before considering a trade. Risk can then be managed with the range structure in mind, often targeting the range high in rotational environments. The indicator is most effective in sideways or mean-reverting markets rather than strong trends.
This script does not place trades, predict direction, or guarantee outcomes. It does not account for news events, earnings, implied volatility changes, or broader macro conditions. It is intended as a contextual tool to support disciplined decision-making, not as a standalone trading system.
Always trade smart. Manage position size, define risk before entering a trade, and avoid over-leveraging short-dated options. The objective is not to predict the market, but to consistently align price structure with realistic time expectations.

Bullish, Bearish, & Normal RSI1. Identifying "True" Momentum (The Aqua/Fuchsia Logic)The most useful part of this script is the comparison between the three lines.Bullish Conviction (Aqua): When both the Bullish and Bearish lines are above the Normal RSI, it suggests that even on "down" candles (red candles), the price isn't losing significant ground. The overall structure is buoyant.Bearish Conviction (Fuchsia): When both are below the Normal RSI, it indicates that even when you get "up" candles (green candles), they lack the strength to lift the average momentum. The sellers are effectively "smothering" the bounces.
2. Spotting Hidden Weakness/Strength (Spread Analysis)The "Spread" (the gap between rsiBull and rsiBear) provides a unique utility:ScenarioInterpretationUtilityWide SpreadHigh volatility and indecision. Green candles are very strong, but red candles are also very weak.Avoid trend-following; wait for a "squeeze" or narrowing.Tight SpreadHigh agreement in price action. Most candles are moving in a similar direction or with similar intensity.Great for identifying stable, trending moves with low noise.Bull/Bear CrossIf the Bullish RSI crosses above the Bearish RSI significantly.Can act as an early entry signal before the Standard RSI hits the 50-midline.
3. Practical Strategy Use CasesFilter for Breakouts: If you see a price breakout but the RSI color remains Gray, the move might lack "conviction." You ideally want to see the color flip to Aqua (for long) or Fuchsia (for short) as the breakout occurs.Exhaustion Signal: If the Normal RSI is overbought ($>70$) but the rsiBull begins to dip toward the rsiNormal, it suggests that the "green candle strength" is waning even if the price is staying high—a potential warning of a reversal.Potential Drawbacks to WatchLag: Like all RSI-based indicators, this is lagging. Because you are using a 14-period lookback on three different calculations, it may take a few bars to confirm a sentiment shift.Whipsaw in Sideways Markets: In a tight range-bound market, the color may flip between Aqua and Fuchsia rapidly, creating "noise."Pro-Tip: This indicator would be most effective when used in conjunction with Volume. If you get an "Aqua" signal on rising volume, the probability of a sustained trend is significantly higher.
