Bullish Engulfing at Daily Support (Pivot Low) - R Target (v6)1. What this strategy really is (in human terms)
This strategy is not about predicting the market.
It’s about waiting for proof that buyers are stepping in at a price where they already should.
Think of it like this:
“I only buy when price falls into a known ‘floor’ and buyers visibly take control.”
That’s it.
Everything in the script enforces that idea.
2. The two ingredients (nothing else)
Ingredient #1: Daily Support (the location)
Support is an area where price previously fell and then reversed upward.
In the script:
Support is defined as the most recent confirmed daily swing low
A swing low means:
Price went down
Stopped
Then went up enough to prove that buyers defended that level
This matters because:
You’re not guessing where support might be
You’re using a level where buyers already proved themselves
“At support” doesn’t mean exact
Markets don’t bounce off perfect lines.
So the script allows a small zone (the “support tolerance”):
Example: 0.5% tolerance
If support is at 100
Anywhere between ~99.5–100.5 counts
This prevents missing good trades just because price was off by a few ticks.
Ingredient #2: Bullish Engulfing Candle (the trigger)
This is the confirmation.
A bullish engulfing candle means:
Sellers were in control
Buyers stepped in hard enough to fully overpower them
The bullish candle’s body “swallows” the previous candle
Psychologically, it says:
“Sellers tried, failed, and buyers just took control.”
That’s why this candle works only at support.
A bullish engulfing in the middle of nowhere means nothing.
3. Why daily timeframe matters
The daily chart:
Filters out noise
Reflects decisions made by institutions, not random scalpers
Produces fewer but higher-quality signals
That’s why:
The script uses daily data
You typically get very few trades per month
Most days: no trade
That “boredom” is the edge.
4. When a trade is taken (exact conditions)
A trade happens only if ALL are true:
Price drops into a recent daily support zone
A bullish engulfing candle forms on the daily chart
Risk is clearly defined (entry, stop, target)
If any one is missing → no trade
5. How risk is controlled (this is crucial)
The stop loss (where you admit you’re wrong)
The stop is placed:
Below the support level
Or below the low of the engulfing candle
With a small ATR buffer so normal noise doesn’t stop you out
Meaning:
“If price breaks below this area, buyers were wrong. I’m out.”
No hoping. No moving stops. No exceptions.
Position sizing (why this strategy survives losing streaks)
Each trade risks a fixed % of your account (default 1%).
So:
Big stop = smaller position
Small stop = larger position
This keeps every trade equal in risk, not equal in size.
That’s professional behavior.
6. The take-profit logic (why 2.8R matters)
Instead of guessing targets:
The strategy uses a multiple of risk (R)
Example:
Risk = $1
Target = $2.80
You can lose many times and still come out ahead.
This is why:
Win rate ≈ 60% is more than enough
Even 40–45% could still work if discipline is perfect
7. Why patience is the real edge (not the pattern)
The bullish engulfing is common.
Bullish engulfing at daily support is rare.
Most people fail because they:
Trade engulfings everywhere
Ignore location
Lower standards when bored
Add “just one more indicator”
Your edge is:
Saying no 95% of the time
Taking only trades that look obvious after they work
8. How to use this strategy effectively (rules to follow)
Rule 1: Only take “clean” setups
Skip trades when:
Support is messy or unclear
Price is chopping sideways
The engulfing candle is tiny
The market is news-chaotic (earnings, FOMC, etc.)
If you have to convince yourself, skip it.
Rule 2: One trade at a time
This strategy works best when:
You’re not stacked in multiple correlated trades
You treat each setup like it matters
Quality > quantity.
Rule 3: Journal screenshots, not just numbers
After each trade, save:
Daily chart screenshot
Support level marked
Entry / stop / target
After 50–100 trades, patterns jump out:
Best tolerance %
Best stop buffer
Markets that behave well vs poorly
That’s how the original trader refined it.
Rule 4: Expect boredom and drawdowns
You will have:
Weeks with zero trades
Clusters of losses
Long flat periods
That’s normal.
If you “fix” it by adding more trades:
You destroy the edge.
9. Who this strategy is perfect for
This fits you if:
You don’t want screen addiction
You prefer process over excitement
You’re okay being wrong often
You want something you can execute for years
It is not for:
Scalpers
Indicator collectors
People who need action every day
10. The mindset shift (the real lesson of that story)
The money didn’t come from bullish engulfings.
It came from:
Defining one repeatable behavior
Removing everything else
Trusting math + patience
Doing nothing most of the time
If you want, next we can:
Walk through real example trades bar-by-bar
Optimize settings for a specific market you trade
Add filters that increase quality without adding complexity
ابحث في النصوص البرمجية عن "BULL"

RSI Bull bear thresholds region highlight on priceBullish & bearish relative strength thresholds
Default 61 & 39 RSI


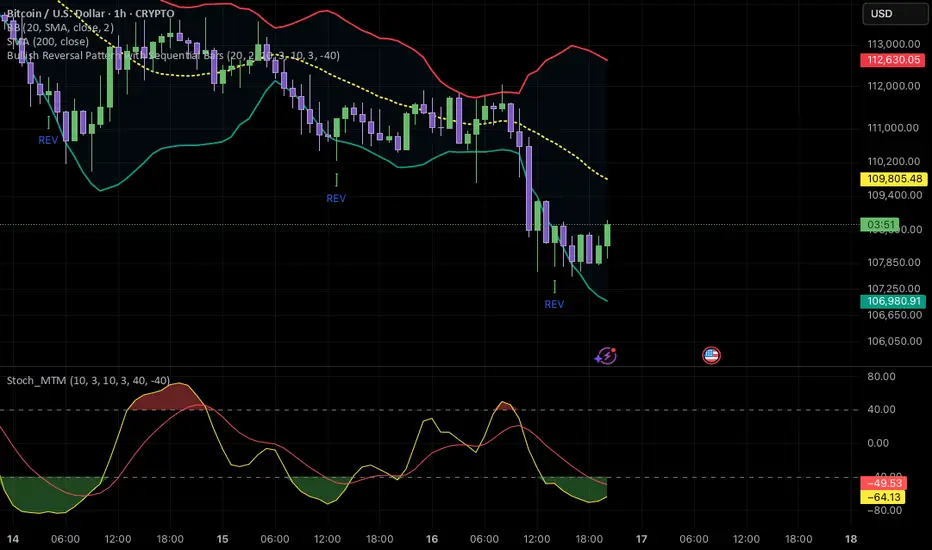
Bullish and Bearish Engulfing (Strength & Trend)This is the final indicator that will show all the “Bullish Engulfing” and “Bearish Engulfing” price action patterns on the chart.
There are several indicators that show this type of chart pattern, but this will show you on the chart all the types of engulfing that may exist and differentiated by type (or strength).
I have classified 4 types of patterns for strength.
Those of strength 1 represent patterns that only incorporate the body of the previous candle, and therefore represent a "base" signal.
Those of strength 2 represent patterns that have the close beyond the shadow, but with an open equal to the previous close.
Those of strength 3 represent patterns that open beyond the previous close.
Those of strength 4 represent patterns in which the body of the candle completely encompasses the previous candle.
Trend Filter
For a better experience I have also added a trend filter via an exponential moving average adjustable from the settings.
So if activated, patterns will only appear if the candle is completely above the moving average.
The indicator is completed by alerts that can be activated either via the "any alert function" in which you will receive any alert, or you can choose whether to receive only bullish ones or only bearish ones.

Bullish/Bearish Engulfing Candle ScannerFinds instances on any time frame of bullish or bearish engulfing candles, those with some increased average volume showing green arrows to highlight, otherwise red.

Bullish EMA Crossover Exact v6This indicator highlights bullish momentum shifts by plotting 9 EMA and 20 EMA crossovers. When the faster 9 EMA crosses above the slower 20 EMA, a bold black “X” appears exactly at the crossover price, signaling potential buy opportunities. Ideal for identifying strong uptrends and precise bullish entry points with clear visual confirmation.

Bullish & Bearish Once Bar PainterThe Bullish & Bearish First Bar Marker is a simple yet powerful indicator designed to highlight the first bullish and bearish bars in a sequence, helping traders identify key momentum shifts in the market. It marks:Bullish Bars: The first bar where the high and low are both higher than the previous bar (high > high and low > low ), painted green with a "Bullish" label.
Bearish Bars: The first bar where the high and low are both lower than the previous bar (high < high and low < low ), painted red with a "Bearish" label.
To avoid clutter, consecutive bullish or bearish bars are not marked until a non-bullish or non-bearish bar resets the sequence. This makes it ideal for spotting the start of strong upward or downward price movements.

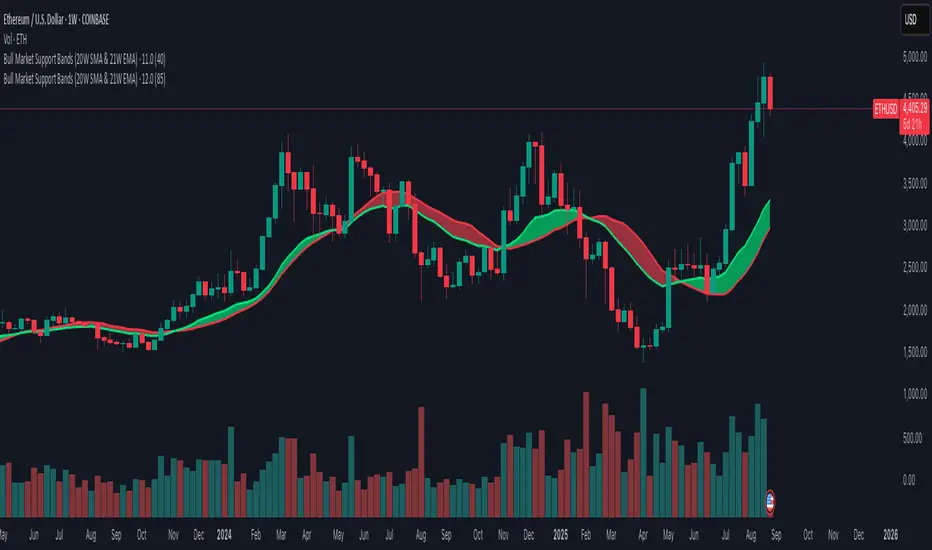
Bull Market Support Bands (20W SMA & 21W EMA)This indicator plots the 20-week Simple Moving Average (SMA) and the 21-week Exponential Moving Average (EMA), together forming the Bull Market Support Bands (BMSB).
Fully compatible with any chart; values are calculated using the weekly timeframe, even if applied on daily charts.
Adjustable band transparency in settings.
Includes optional alerts when EMA crosses above/below SMA.
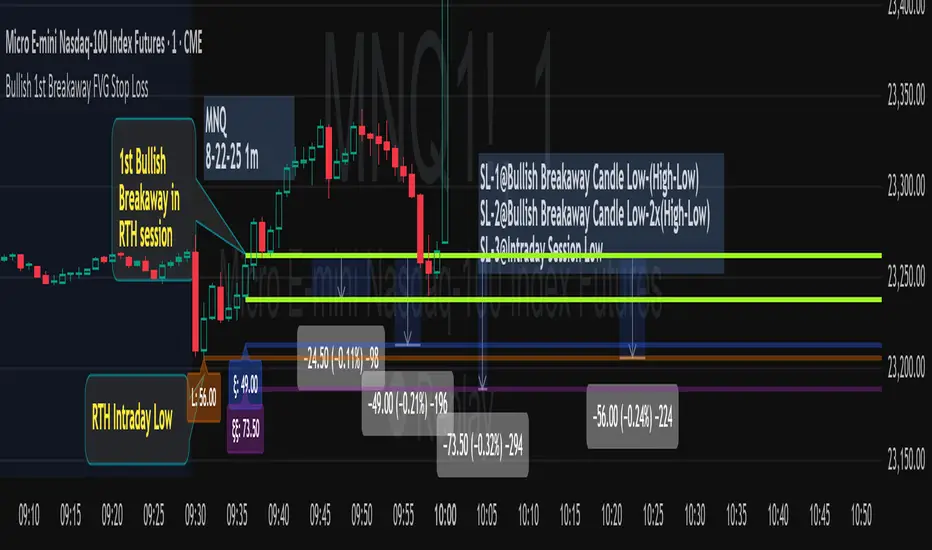
Bullish 1st Breakaway FVG Stop Loss
This indicator provides a defined 3-tier stop loss placement when you want to trade the 1st Bullish Breakaway FVG strategy. The Bullish Breakaway Dual Session FVG indicator is an independent indicator that track all bullish breakaway candles, however this one only tracks the very 1st breakaway candle with a stop loss visual cue.
Introduction of Bullish Breakaway Consolidated FVG:
Inspired by the FVG Concept:
This indicator is built on the Fair Value Gap (FVG) concept, with a focus on Consolidated FVG. Unlike traditional FVGs, this version only works within a defined session (e.g., ETH 18:00–17:00 or RTH 09:30–16:00).
Bullish consolidated FVG & Bullish breakaway candle
Begins when a new intraday low is printed. After that, the indicator searches for the 1st bullish breakaway candle, which must have its low above the high of the intraday low candle. Any candles in between are part of the consolidated FVG zone. Once the 1st breakaway forms, the indicator will shades the candle’s range (high to low).
Session Reset: Occurs at session close.
Choose your own session: use 930 to 1615 for RTH, 1800 to 1615 for ETH. (New York Time Zone)
Repaint Behavior:
If a new intraday (or intra-session) low forms, earlier breakaway patterns are wiped, and the system restarts from the new low.
Product Optimization:
This indicator is designed for CME future product with New York time zone. If you want to trade other products, please adjust your own time session.
Entry:
Long after the 1st Bullish Breakaway Candle in your active session.
However, best position of long is executed by your own trading skill and edge.
Stop Loss: ξ
ξ: This is the 1st stop loss, it is 1 equal size of the breakaway candle below the low.
ξξ: This is the 2nd stop loss, it is 2 equal sizes of the breakaway candle below the low.
L: This is the 3rd stop loss, it is the intraday session low.
Stop loss calculation:
Assuming you enter at the high of the breakaway candle, the SL number is shown as the high minus the stop loss placement.
Last Mention:
If you don't see anything in the indicator, adjust your session to an active session only, and use Tradingview replay function. This indicator is a live indicator with repainting mechanism.
Bullish & Bearish Signals (Dual Mode, Strong Filters)on research related to bullish & bearish signal, understanding how ema, macd works...

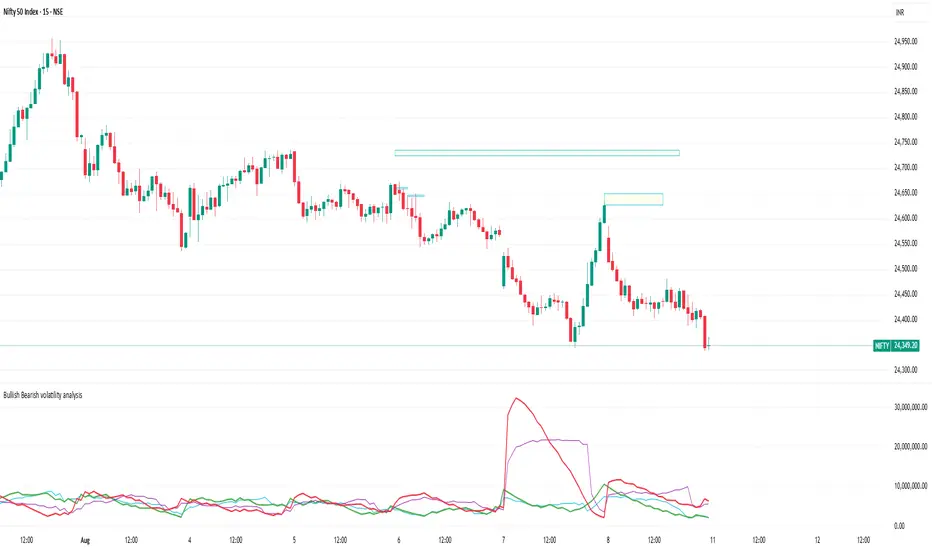
Bullish Bearish volatility analysisThis script is used to analyse Bullish/Bearish volatility direction based on volumes and moving average.
Bullish Divergence SMI Base & Trigger with ATR FilterDescription:
A bullish divergence indicator combining the Stochastic Momentum Index (SMI) and Average True Range (ATR) to pinpoint high-probability entries:
1. Base Arrow (Orange ▲):
• Marks every SMI %K / %D bullish crossover where %K < –70 (deep oversold)—the first half of the divergence setup.
• Each new qualifying crossover replaces the previous base, continuously “arming” the divergence signal.
• Configurable SMI lookbacks, oversold threshold, and a base timeout (default 100 days) to clear stale bases.
2. Trigger Arrow (Green ▲):
• Completes the bullish divergence: fires on the next SMI bullish crossover where %K > –60 and price has dropped below the base arrow’s close by at least N × ATR (default 1 × 14-day ATR).
• A dashed green line links the base and trigger to visually confirm the divergence.
• Resets after triggering, ready for a new divergence cycle.
Inputs:
• SMI %K Length, EMA Smoothing, %D Length
• Oversold Base Level (–70), Trigger Level (–60)
• ATR Length (14), ATR Multiplier (1.0)
• Base Timeout (100 days)
Ideal for any market, this study highlights genuine bullish divergences—oversold momentum crossovers that coincide with significant price reactions—before entering long trades.

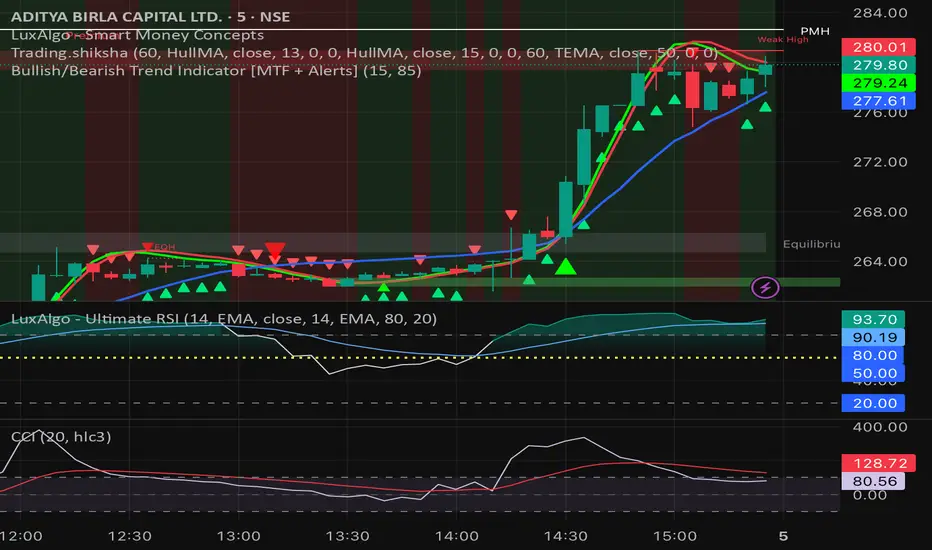
Bullish/Bearish Trend Indicator [MTF + Alerts] by Dow theory Summary of Logic:
✅ Bullish Trend:
Setup Bar: High > Previous High AND Low ≥ Previous Low
Confirmation Bar: High > Highest High of last 3 candles, Low ≥ Setup Bar Low
Trend Continues Until: Latest candle breaks 2nd last candle’s low → then trend becomes Bearish
🔻 Bearish Trend:
Setup Bar: Low < Previous Low AND High ≤ Previous High
Confirmation Bar: Low < Lowest Low of last 3 candles, High ≤ Setup Bar High
Trend Continues Until: Latest candle breaks 2nd last candle’s high → then trend becomes Bullish
Bullish & Bearish Wick MarkerMarks bullish and bearish engulfing candles
Bullish engulfing candle:
when the low is lower than the previous candle low and the body close is higher than the previous candle body
Bearish engulfing cande:
when the high is higher than the previous candle high and the body close is lower than the previous candle body

Bullish Volume AnomalyAnomaly is designed to spot hidden bullish accumulation before price actually breaks out, by blending a trend-aware volume measure with a volatility-adjusted price channel. Here’s how it works:
First, it runs a simple ATR-based zigzag to identify the current swing direction. Volume is then signed (+ for up-trends, – for down-trends) and cumulatively summed. By converting that cumulative signed volume into a z-score over the past 480 bars, we get a sense of when buying or selling pressure is unusually strong relative to its own history.
At the same time, price itself is normalized into a z-score over the same 480-bar window, and its change over that period is also tracked. These two measures—volume z-score (s) and price z-score (p)—are compared, and the indicator looks for moments when s outpaces p by at least two standard deviations (s – p > 2), while price momentum change remains low (c < 1) and the net volume is positive (s > 0). That combination flags instances where heavy buying is taking place but price hasn’t yet reacted.
To define a dynamic trading zone, it plots a 288-bar EMA of price as the middle band (t2), and builds upper and lower bands around it using the average close-to-open range multiplied by a user-set factor. The lower band (t1) sits beneath the EMA by that volatility-based margin. A signal fires only when the bar’s high stays below t1—meaning price is still “sleeping” under the lower volatility boundary even as bullish volume builds up.
Together, these filters home in on anomalies: strong, trend-aligned volume surges that outstrip price movement, occurring while price sits below its lower volatility band. In practice, that often marks early accumulation before a breakout. You can tweak the ATR length and multiplier for the zigzag, as well as the channel period and range factor, to suit different markets or timeframes.

Bullish Candlestick with No or Small Bottom Wickthis indicator highlights bullish candles with no lower wick of with a very small lower wick. the idea is that when this occurs, price will sooner or later get back to this area. you could use it for a strategy that sets up shorts just below the bullish candle.

Bullish and Bearish Harami DetectorHere’s a description of the script I built for you, designed for a **TradingView public indicator**:
### **Custom Bullish and Bearish Harami Detector with Timeframe Selection**
This custom Pine Script detects **Bullish Harami** and **Bearish Harami** candlestick patterns on the selected timeframe, with configurable settings for how many prior candles to consider for pattern detection.
---
### **Features:**
1. **Timeframe Selection:**
- **Input Field for Timeframe**: The script allows users to choose the timeframe for detecting patterns. For instance, you can set it to 1 hour, 4 hours, or even daily candles, ensuring the detection works as per your chosen market view.
- This is controlled by the `input.timeframe` function, and the user is prompted to select the desired timeframe (e.g., "1h", "4h", "1d").
2. **Enable/Disable Pattern Detection:**
- The user has the flexibility to enable or disable the detection of **Bullish Harami** and **Bearish Harami** patterns.
- The two toggles `detectBullishHarami` and `detectBearishHarami` allow users to turn on/off the detection for each pattern type.
3. **Customizable Bearish Candle Count for Bullish Harami:**
- The user can define how many prior **bearish candles** should be present before a **Bullish Harami** can be detected.
- The input variable `bearishCandleCountBullish` lets you choose how many previous bearish candles to consider for detecting a **Bullish Harami** (for example, the last 3, 5, or 6 bearish candles).
4. **Customizable Bullish Candle Count for Bearish Harami:**
- Similar to the Bullish Harami, the script allows the user to define how many prior **bullish candles** should be present before a **Bearish Harami** pattern is detected.
- The input variable `bearishCandleCountBearish` lets you select how many previous bullish candles to check for **Bearish Harami**.
5. **Pattern Detection Logic:**
- **Bullish Harami**: Detected when a bearish candle (open > close) is followed by a smaller bullish candle (open < close) where the entire body of the second candle is contained within the body of the first candle.
- **Bearish Harami**: Detected when a bullish candle (open < close) is followed by a smaller bearish candle (open > close) where the entire body of the second candle is contained within the body of the first candle.
- Both patterns are subject to the user-defined conditions (number of previous bearish or bullish candles).
6. **Visual Indicators:**
- **Bullish Harami**: A green label is plotted **below the bar** to indicate a **Bullish Harami** pattern.
- **Bearish Harami**: A red label is plotted **above the bar** to indicate a **Bearish Harami** pattern.
- The labels are displayed using the `plotshape` function with custom colors and text.
7. **Additional Settings**:
- The script includes tooltips and descriptions for each input to make the settings clear for users, allowing even those unfamiliar with candlestick patterns to understand and use the indicator effectively.
---
### **How It Works:**
- The script first checks the specified timeframe and identifies the current and previous candlesticks.
- It then applies the user-defined conditions for detecting the **Bullish Harami** and **Bearish Harami** patterns by checking the relative positions and sizes of the candlesticks over the selected number of previous candles.
- Once a pattern is detected, it plots a label on the chart (green for **Bullish Harami** and red for **Bearish Harami**) at the appropriate location (below or above the candle).
- The script updates dynamically as the price action unfolds.
---
### **Use Cases:**
- **Traders**: This script is useful for traders who want to identify reversal patterns like **Bullish Harami** and **Bearish Harami** on their chosen timeframes and adjust the sensitivity by changing the number of prior candles for pattern detection.
- **Customization**: Users can fine-tune the script’s settings based on their specific trading strategy, adjusting both the timeframe and the number of candles for pattern detection.
---
### **Conclusion:**
This indicator is an effective tool for detecting candlestick patterns, specifically **Bullish Harami** and **Bearish Harami**, on **TradingView**. By allowing customization in terms of timeframe and the number of prior candles to consider, users can tailor the script to fit their trading strategy and market conditions.

Bullish B's - RSI Divergence StrategyThis indicator strategy is an RSI (Relative Strength Index) divergence trading tool designed to identify high-probability entry and exit points based on trend shifts. It utilizes both regular and hidden RSI divergence patterns to spot potential reversals, with signals for both bullish and bearish conditions.
Key Features
Divergence Detection:
Bullish Divergence: Signals when RSI indicates momentum strengthening at a lower price level, suggesting a reversal to the upside.
Bearish Divergence: Signals when RSI shows weakening momentum at a higher price level, indicating a potential downside reversal.
Hidden Divergences: Looks for hidden bullish and bearish divergences, which signal trend continuation points where price action aligns with the prevailing trend.
Volume-Adjusted Entry Signals:
The strategy enters long trades when RSI shows bullish or hidden bullish divergence, indicating an upward momentum shift.
An optional volume filter ensures that only high-volume, high-conviction trades trigger a signal.
Exit Signals:
Exits long positions when RSI reaches a customizable overbought level, typically indicating a potential reversal or profit-taking opportunity.
Also closes positions if bearish divergence signals appear after a bullish setup, providing protection against trend reversals.
Trailing Stop-Loss:
Uses a trailing stop mechanism based on ATR (Average True Range) or a percentage threshold to lock in profits as the price moves in favor of the trade.
Alerts and Custom Notifications:
Integrated with TradingView alerts to notify the user when entry and exit conditions are met, supporting timely decision-making without constant monitoring.
Customizable Parameters:
Users can adjust the RSI period, pivot lookback range, overbought level, trailing stop type (ATR or percentage), and divergence range to fit their trading style.
Ideal Usage
This strategy is well-suited for trend traders and swing traders looking to capture reversals and trend continuations on medium to long timeframes. The divergence signals, paired with trailing stops and volume validation, make it adaptable for multiple asset classes, including stocks, forex, and crypto.
Summary
With its focus on RSI divergence, trailing stop-loss management, and volume filtering, this strategy aims to identify and capture trend changes with minimized risk. This allows traders to efficiently capture profitable moves and manage open positions with precision.
This Strategy BEST works with GLD!

Bullish On Neck Candlestick patternExplanation:
1. Bullish Large Candle: The first candle is defined as bullish, where the closing price is much higher than the opening price. It also needs to have a large body (at least 60% of the total candle height).
2. Small Bearish Candle: The second candle is bearish and closes near the high of the previous bullish candle, with a relatively small body.
3. Bullish On Neck Detection: The script looks for this pattern where the bullish large candle is followed by a smaller bearish candle that closes near the first candle's high, indicating potential for a bullish breakout.
4. Plot: When the pattern is detected, the script places a green triangle above the bar to signal the bullish on neck pattern.

Bullish Gap Up DetectionThis indicator is designed to identify gap-up trading opportunities in real-time. A gap-up occurs when the opening price of a stock is higher than the previous day's high, signaling potential bullish momentum.
Key Features :
Gap Detection : The indicator detects when today’s open is above yesterday’s high and remains above that level throughout the trading session.
Visual Alerts : A triangle shape appears below the price bar when a gap-up condition is met, providing clear visual signals for traders to consider potential entry points.
EMA Analysis : The indicator incorporates two Exponential Moving Averages:
10-day EMA: Used to assess short-term price trends and help determine if the stock is currently in an upward momentum phase.
20-day EMA: Provides additional context for medium-term trends, ensuring that gaps are only considered when the stock is in a favorable trend.
The indicator confirms that the 10-day EMA is above the 20-day EMA, indicating bullish sentiment in the market.
This indicator can be used in various trading strategies to capitalize on momentum following gap-up openings. It’s suitable for day traders and swing traders looking for entry points in trending stocks.
Bull Trade Zone IndicatorThe BULL TRADE ZONE INDICATOR is a powerful trading tool designed to help traders identify optimal entry and exit points in the market. This script uses a combination of two Exponential Moving Averages (EMA) and the Average True Range (ATR) to generate buy and sell signals, making it ideal for traders looking to enhance their trading strategy with precise and timely alerts.
Key Features:
Dynamic Buy and Sell Signals: The indicator generates buy signals when the 14 EMA crosses above the 150 EMA and the price is trading above the 150 EMA. Sell signals are generated when the 14 EMA crosses below the 150 EMA and the price is below the 150 EMA, providing clear guidance on potential market trends.
Built-In Stop-Loss Levels: Automatic stop-loss levels are calculated based on the ATR, helping traders manage risk effectively by setting realistic stop-loss points based on market volatility.
Minimal Chart Clutter: To maintain a clean and focused trading environment, the 14 EMA and 150 EMA values are privately used within the script without being visibly plotted on the chart, ensuring that the focus remains on actionable signals.
Clear Visual Alerts: Buy and sell signals are highlighted directly on the chart with intuitive labels, making it easy to spot trading opportunities at a glance.
Who Is This For?
This indicator is suitable for traders of all levels—whether you are a beginner looking for a straightforward trading tool or an experienced trader seeking to add an additional layer of confirmation to your strategy. The BULL TRADE ZONE INDICATOR helps you stay ahead of the market by precisely identifying key trading zones.
How to Use:
Add the indicator to your chart.
Monitor the buy and sell signals generated by the script.
Use the plotted stop-loss levels to manage your trades effectively.
Customize your trading strategy using the indicator’s signals to align with your risk appetite and market view.
Disclaimer:
This indicator is a technical analysis tool designed to assist with decision-making. It should be used alongside other analyses and strategies, not as the sole basis for trading decisions. Always perform your due diligence and risk management when trading.

Bullish/Bearish Volume Indicator ABDJO1- red bars are bearish volume
2- yellow bars are a weakness of bearish volume.
3-green bars are a strong bullish volume.
4-Orange bars are a weakness of bullish volume.
1. Price Movements
The chart does not explicitly show price movements, but the volume bars can give us indirect clues. Typically, a transition from green (strong bullish volume) to red (bearish volume) suggests a potential reversal from an uptrend to a downtrend. The presence of orange bars (weakness of bullish volume) following green bars indicates a decrease in buying momentum, which often precedes a price decline.
2. Trading Volume
Green Bars: Represent strong bullish volume, indicating strong buying interest.
Orange Bars: Indicate a weakening of bullish volume, suggesting that buyers are losing strength or interest at higher price levels.
Yellow Bars: Represent a weakening of bearish volume, which could indicate that selling pressure is decreasing and a potential reversal or stabilization in price might occur.
Red Bars: Signify strong bearish volume, indicating strong selling pressure.
3. Price-Volume Relationship
The transition from green to orange and then to red bars shows a typical pattern where initial strong buying interest (green) is followed by a decrease in buyer enthusiasm (orange), and eventually overtaken by sellers (red). This pattern often corresponds to a peak in prices followed by a reversal to the downside.
4. Technical Indicators
Without specific price data, traditional indicators like MA (Moving Averages), MACD (Moving Average Convergence Divergence), or KDJ (Stochastic Oscillator) cannot be calculated directly. However, the volume pattern itself can be used as a rudimentary momentum indicator, with decreasing bullish volume (orange) and increasing bearish volume (red) suggesting a bearish momentum.
5. Support and Resistance Levels
Support Level: Could be hypothesized near the transition point from yellow to green bars, where buyers previously started to overpower sellers.
Resistance Level: Likely near the transition from green to orange bars, where sellers begin to regain control and buying momentum fades.
6. Overall Trend Patterns
The overall trend, inferred from the volume bars, suggests a bullish phase losing momentum and transitioning into a bearish phase. This is typical of a market top where buying interest wanes and sellers begin to dominate.
7. Future Projections and Recommendations
Given the observed shift from bullish to bearish volume, there is a higher likelihood of a downward price movement in the near term. Investors should consider this a potential sell signal, especially as bearish volume (red bars) increases. Caution is advised for buyers, and it might be prudent for holders to take profits or set stop-loss orders to protect against potential declines.
