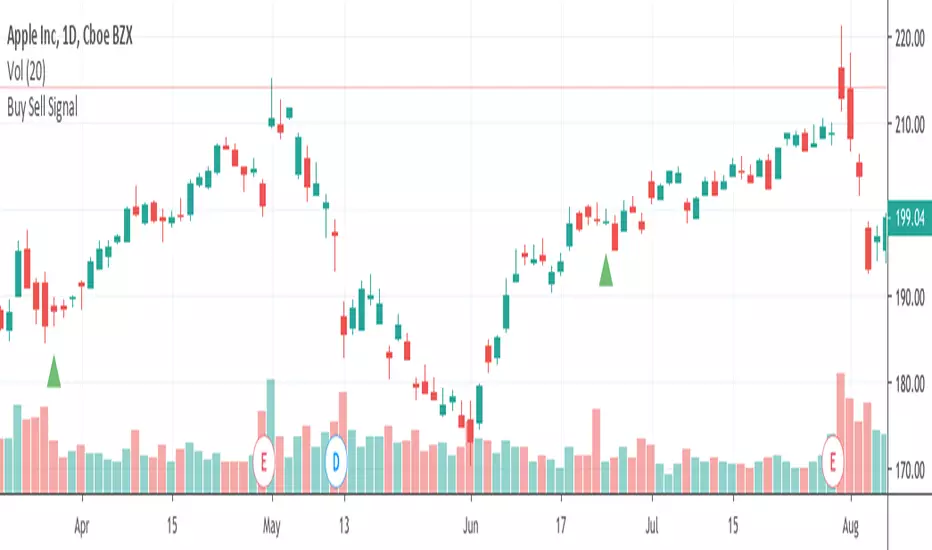
Buy Sell SignalFinding the highest winning percentage trade.
Work best on stock (1D time frame).
Only be available for a month.
If you like it, please message me
ابحث في النصوص البرمجية عن "Buy sell"
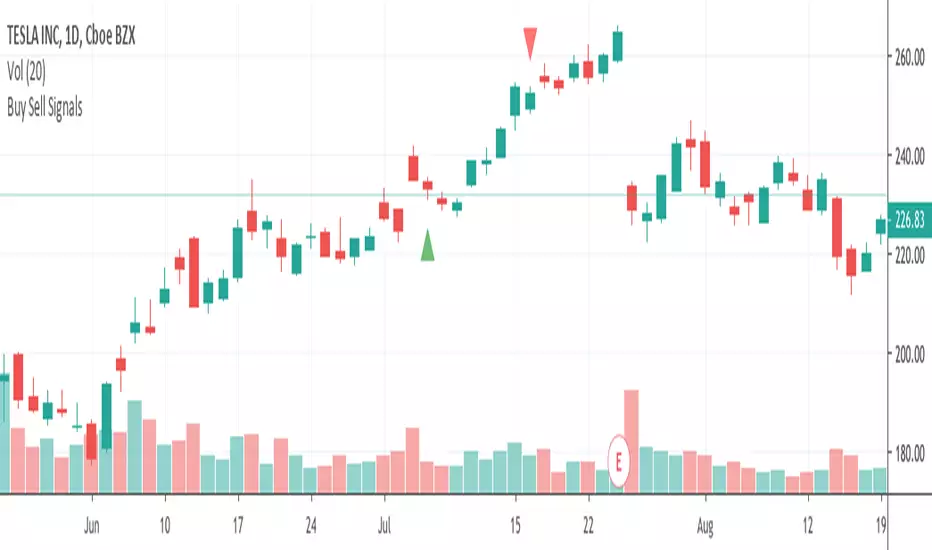
Buy Sell Signals 1Finding the high winning percentage trade signals.
It will be public for a month.
If you like it, please message me

Buy Sell SignalsFinding the high winning percentage trade signals.
It will be public for a month.
If you like it, please message me
Buy Sell SignalsFinding the high winning percentage trade signals.
It will be public for a month.
If you like it, please message me

Buy Sell SignalsFinding the high winning percentage trade signals.
It will be public for a month.
If you like it, please message me

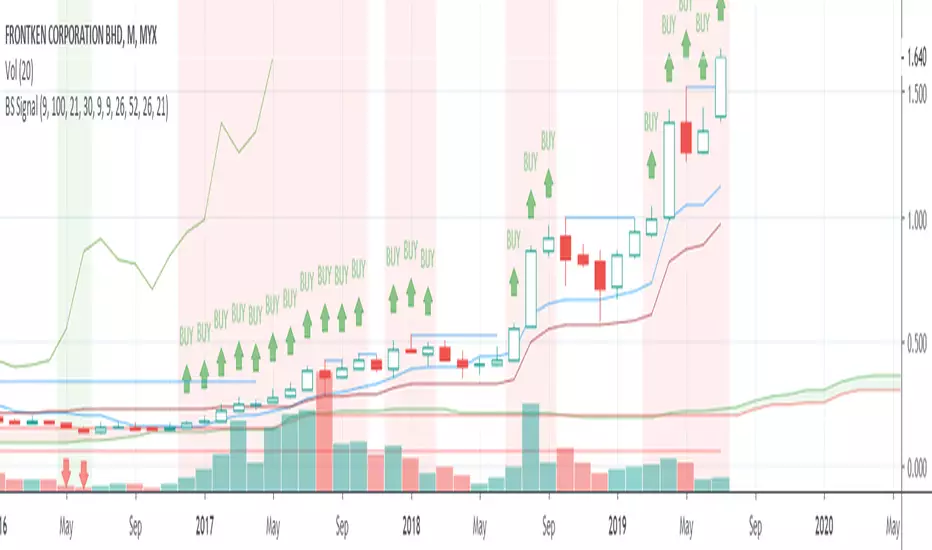
Buy Sell Signal & IchimokuThe script totally based on technical analysis. Indication of "Buy" will appear once the conditions are matched. Please don't follow "Buy" indication if it appear at top of chart.
Yellow candle is a pre-alert for any momentum coming together with increasing of price.
Yellow circle at volume bar is to show that the momentum was there.
Orange line is support & resistance.


Buy SellKıvanc hocanın yazdığı 2 stop loss indikatörünün birleşmesi sonucu bulundu. Çalışma mantığını kullandıkça anlayacaksınızıdır.


Buy Sell signal by Spicytrader
Get on board before going to the moon !
Spicytrader instantly identifies when a potential pump or dump is beginning.
Compatible with Autoview bot
GET ACCESS : spicytrader.com


Buy/Sell Ahmed Rashiedtrade with confidence good for both intra day and long term took me 2 yrs to finish it


VIX Term Structure Pro [v7.0 Enhanced]# VIX Term Structure Pro v7.0
[! (img.shields.io)](www.tradingview.com)
[! (img.shields.io)](www.tradingview.com)
[! (img.shields.io)](LICENSE)
**Professional VIX-based Market Sentiment & Timing Indicator**
专业的 VIX 市场情绪与择时指标
---
## 🌟 Overview / 概述
VIX Term Structure Pro is an advanced multi-factor market timing indicator that analyzes the VIX futures term structure, volatility regime, and market breadth to generate actionable buy/sell signals.
VIX Term Structure Pro 是一款高级多因子市场择时指标,通过分析 VIX 期货期限结构、波动率区间及市场广度,生成可操作的买卖信号。
---
## 🚀 Key Features / 核心功能
### 📊 Multi-Factor Scoring System / 多因子评分系统
- **Term Structure Z-Score**: Measures deviation from historical mean / 期限结构 Z 分数:衡量与历史均值的偏离
- **VIX/VX1 Basis**: Spot premium detection for panic signals / VIX 现货溢价:恐慌信号检测
- **Contango Analysis**: Futures curve shape insights / 期货升水分析
- **SKEW Integration**: Options skew for tail risk / SKEW 整合:尾部风险监测
- **Put/Call Ratio**: Sentiment extremes / 看跌/看涨比率:情绪极端
- **VVIX Support**: Volatility of volatility (optional) / VVIX 支持:波动率的波动率
### 🎯 Three-Tier Signal System / 三级信号系统
| Signal | Score | Description |
|--------|-------|-------------|
| 🚨 **CRASH BUY** | ≥ 6 | Extreme panic, rare opportunity / 极端恐慌,罕见机会 |
| 🟢 **STRONG BUY** | ≥ 5 | Multi-factor confluence / 多因子共振 |
| 🟡 **BUY DIP** | ≥ 4 | Accumulate on weakness / 逢低吸纳 |
| 🟠 **SELL/HEDGE** | ≤ -2 | Consider reducing risk / 考虑减仓对冲 |
| 🔴 **STRONG SELL** | ≤ -5 | Strong bearish signals / 强烈看跌信号 |
| 🔥 **EUPHORIA SELL** | ≤ -6 | Extreme greed, sell signal / 极度贪婪,卖出信号 |
### 📈 Dashboard Indicators / 仪表盘指标解读
| Indicator | Bullish 🟢 | Bearish 🔴 |
|-----------|------------|------------|
| Overall Bias | STRONG BUY / BUY DIP | STRONG SELL / SELL/HEDGE |
| AI Score | ≥ 5 (Extreme Fear) | ≤ -5 (Extreme Greed) |
| Market Trend | 🟢SPX 🟢NDX (Above MA200) | 🔴SPX 🔴NDX (Below MA200) |
| VIX Regime | LOW VOL (<15) | HIGH VOL (>25) |
| Term Struct Z | < -2.0 (Panic) | > 2.0 (Complacency) |
---
## ⚙️ Configuration / 配置选项
### 📡 Data Sources / 数据源
- **VIX Symbol**: Default `CBOE:VIX` (Alternative: `TVC:VIX`)
- **Put/Call Ratio**: Default `INDEX:CPCI` (Index P/C)
- **Timeframe**: Daily (stable) or Chart (real-time)
### ⚠️ Strategy Mode / 策略模式
- **High (Scalping)**: Sensitive, for short-term trades / 高敏感,短线
- **Normal (Swing)**: Balanced approach / 平衡模式
- **Low (Trend/Safe)**: Conservative, trend-following / 保守,趋势跟踪
### 🔬 Backtest Mode / 回测模式
- **OFF (Real-time)**: Shows current day data, suitable for live monitoring / 显示当日数据,适合实盘监控
- **ON (Historical)**: Uses only confirmed data, avoids look-ahead bias / 仅使用已确认数据,避免未来函数
---
## 📖 Usage Guide / 使用指南
### Best Practices / 最佳实践
1. **Apply to SPX/SPY/QQQ daily charts** for optimal signal accuracy
在 SPX/SPY/QQQ 日线图上使用,信号准确度最佳
2. **Wait for next trading day** to execute signals (signals trigger on daily close)
信号触发后在下一交易日执行(信号基于日线收盘)
3. **Use in conjunction with price action** for confirmation
结合价格走势确认信号
4. **Enable Market Trend Filter** (MA200) for safer entries in uncertain markets
开启趋势过滤(MA200)以在不确定市场中更安全入场
### Signal Interpretation / 信号解读
```
🚨 CRASH BUY (Score ≥ 6)
→ Rare extreme panic event
→ Historical average return: significant positive over 2 months
→ Consider aggressive positioning
🟢 STRONG BUY (Score ≥ 5)
→ Multiple indicators align
→ Historical average return: positive over 1 month
→ Consider building positions
🟡 BUY DIP (Score ≥ 4)
→ Moderate fear detected
→ Suitable for adding to existing positions
→ Filtered out in bear markets if Trend Filter is ON
```
---
## 📊 Historical Statistics / 历史统计
The indicator tracks signal frequency and average subsequent returns:
- **CRASH BUY**: 40-day return period (~2 months)
- **STRONG BUY**: 20-day return period (~1 month)
- **BUY DIP**: 10-day return period (~2 weeks)
指标追踪信号频率和后续平均收益,可在仪表盘中查看历史统计。
---
## 🔔 Alerts / 警报
Built-in alert conditions with cooldown mechanism to prevent spam:
| Alert | Condition |
|-------|-----------|
| Crash Buy Alert | Score ≥ 6, extreme panic |
| Strong Buy Alert | Score ≥ 5, multi-factor confluence |
| Buy Dip Alert | Score ≥ threshold |
| Euphoria Sell Alert | Score ≤ -6, extreme greed |
| Strong Sell Alert | Score ≤ -5 |
| VIX Basis Panic | VIX spot premium spike |
---
## 📋 Changelog / 更新日志
### v7.0 (Current)
- ✨ Three-tier buy/sell signal system
- 📊 Signal statistics with average return tracking
- 🔬 Backtest Mode toggle for historical testing
- 🎨 Configurable ±1 Z-Score reference lines
- ⚡ Modular scoring functions
- 🛡️ Dual index trend display (SPX + NDX)
- 📱 Compact & Full dashboard modes
---
## ⚠️ Disclaimer / 免责声明
**English:**
This indicator is for educational and informational purposes only. It does not constitute financial advice. Past performance does not guarantee future results. Always do your own research and consider your risk tolerance before trading.
**中文:**
本指标仅供教育和信息参考,不构成投资建议。过往表现不代表未来收益。交易前请自行研究并评估风险承受能力。
---
## 📄 License / 许可证
MIT License - Feel free to use, modify, and share.
---
## 🤝 Contributing / 贡献
Issues and pull requests are welcome!
欢迎提交问题和贡献代码!
---
**Made with ❤️ for the trading community**
**为交易社区用心打造**

JAM ORB Algo⚡ ORB Strategy + Backtesting (Pine Script v5)
This script implements a complete Opening Range Breakout (ORB) strategy, featuring built-in backtesting, advanced TP/SL visualization, full style customization, and a performance dashboard. It is designed for traders who want to clearly evaluate breakout performance directly on the chart.
🕑 ORB Window Configuration
🔹 Session selection: choose between Market Timezone or Custom Session.
🔹 Timezone support: configurable from UTC-8 to UTC+12.
🔹 Daily limit: option to allow only one trade per day.
🔹 Risk/Reward (RR) settings:
Configurable TP1, TP2, and TP3 levels.
Stop Loss calculated dynamically from the ORB range.
📊 Backtesting Engine
🔹 Interactive dashboard showing trades, wins, losses, and win rate.
🔹 Adjustable partial exits for each TP (TP1, TP2, TP3).
🔹 Automatic calculation of percentage-based profit and loss.
🔹 Tracks total trades, total profit, and average profit per trade.
🎨 Visual Customization
🔹 Fully customizable colors:
ORB high/low lines and range fill.
Buy/Sell entry labels.
TP and SL lines with background zones.
🔹 Line style and thickness options (solid, dotted, dashed).
🔹 Visibility controls for each TP/SL level.
🔹 Clear profit and loss zones drawn directly on the chart.
🚀 Trading Logic
🔹 LONG entries: triggered when price breaks above the ORB high.
🔹 SHORT entries: triggered when price breaks below the ORB low.
🔹 Automatic calculation of Stop Loss and TP1, TP2, TP3 based on ORB range and RR.
🔹 Customizable BUY / SELL labels displayed at entry.
✅ TP / SL Detection
🔹 Real-time detection of TP1, TP2, TP3, and SL hits.
🔹 Prevents double counting of the same level.
🔹 Extended TP/SL lines with shaded zones for better clarity.
📈 Backtesting Dashboard
🔹 Displayed in the top-right corner of the chart.
🔹 Shows:
Total trades
Wins / Losses
Win rate (%)
Total profit (%)
Average profit per trade
🔹 Fully customizable panel color.
✨ Summary
This script combines:
Opening Range detection
Breakout trading logic with advanced risk management
Professional-grade visualizations
Integrated historical performance tracking
High customization for sessions, styles, and colors
💡 Ideal for traders who want to trade ORB setups with clarity, structure, and measurable results.

Star V12⭐ Star Engine — Multi-Component, Multi-Timeframe Trade Execution System
The Star Engine is a stateful trade execution and analytics system designed to transform indicator confluence into structured, measurable trade runs. Rather than producing isolated buy/sell signals, the engine decomposes market behavior into pressure, confirmation, event grouping, and trade lifecycle management. Each component plays a specific role, and no single component is sufficient on its own. Below is a detailed breakdown of each subsystem and why it exists.
💣 Bomb Engine — Directional Pressure Measurement
The Bomb Engine is responsible for identifying directional pressure in the market. It evaluates whether price action exhibits sustained momentum in one direction, independent of whether that direction is immediately tradable.
What Bomb Uses
Bomb aggregates momentum- and trend-oriented inputs such as MACD-based momentum direction, momentum persistence and continuation logic, directional bias filters, and impulse strength evaluation. All inputs are evaluated across multiple timeframes, with each timeframe contributing independently.
How Bomb Works
Each timeframe produces a directional contribution (bullish, bearish, or neutral). Contributions are aggregated into a net Bomb total. The total is mapped into discrete tone buckets (blue, green, red, black, etc.). Higher totals indicate stronger directional dominance.
What Bomb Tells You
Bomb answers one question: Is there directional pressure building or persisting? It does not determine entry timing, exhaustion, or trade quality. Bomb is context, not execution. This allows Bomb to be early without being responsible for precision.
✨ Golden Engine — Structural Confirmation & Regime Filtering
The Golden Engine evaluates whether the directional pressure detected by Bomb is structurally supported. Golden exists to prevent entries during momentum exhaustion, conflicting timeframe regimes, and counter-structure moves.
What Golden Uses
Golden relies on a different indicator stack than Bomb, focused on confirmation and balance, including RSI regime classification (not simple overbought/oversold), momentum agreement vs divergence, trend-following vs counter-trend positioning, overextension detection, and compression and rotational behavior. Each timeframe is evaluated independently using the same logic.
The Role of RSI in Golden
RSI in Golden is used to identify regimes, not signals. It answers questions such as: Is momentum expanding or decaying? Is the move early, mid-structure, or extended? Do multiple timeframes share compatible RSI states? If RSI regimes conflict across timeframes, Golden will not confirm. This is one of the main mechanisms that makes Golden selective.
Momentum & Alignment Logic
Golden evaluates whether momentum supports continuation, is fragmenting, is diverging from price, or is contradicting higher-timeframe structure. If lower-timeframe impulses are not supported by higher-timeframe structure, Golden suppresses confirmation — even if Bomb remains strong.
What Golden Guarantees
Golden does not guarantee profitable trades. Golden guarantees that the detected directional pressure is not internally contradictory across RSI regimes, momentum behavior, and timeframe structure. This replaces vague terms like “clean” with explicit structural conditions.
🔗 Multi-Timeframe Aggregation (MTF)
Both Bomb and Golden operate on a multi-timeframe voting system. Lower timeframes capture early impulses, higher timeframes enforce structural context, each timeframe votes independently, conflicts weaken totals, and alignment strengthens totals. This creates temporal confluence, not just price-based confluence.
⭐ Star Events — Qualified Market Impulses
A Star (⭐) is created only when Bomb is active, Golden is active, both agree on direction, and all gating rules pass (thresholds, time filters, modes). A Star represents a qualified impulse, not a trade. Stars are atomic events used by the execution layer.
⏱ Star Clusters — Trade Run State
The Star Cluster groups Stars into runs. The first Star starts a cluster, anchor price, bar, and time are recorded, each additional Star increments the cluster count, and all Stars belong to the same run until exit. This prevents duplicate entries, signal spam, and overtrading in volatile conditions.
⛔ Reset Gap Logic — Temporal Control
To prevent rapid re-entry, a minimum time gap is required to start a new run. Stars occurring too close together are merged. Reset does not terminate active runs. This enforces time-based discipline, not indicator-based guessing.
1➡️ Entry Logic — Confirmation-Based Execution
The engine never enters on the first Star. Instead, the user defines 🔢 N (Entry Star Index). Entry occurs only on the Nth Star, and that bar is marked 1➡️🔢N. This ensures entries occur after persistence, not detection. At ENTRY, Best = 0.00 and Worst = 0.00. Statistics measure real trade performance, not early signal noise.
📊 STAT Engine — Live Trade Measurement
Once entry is active, the STAT engine tracks ⏱ run progression, 🏅 maximum favorable excursion, and 📉 maximum adverse excursion. Mechanics: uses highs and lows, not closes; updates every bar; entry bar resets stats; historical bars marked 🎨. This creates an objective performance envelope for every trade.
🛑 Exit Engine — Deterministic Outcomes
Trades are exited using explicit rules: 🏅 WIN → profit threshold reached, 📉 LOSE → risk threshold breached, ⏱ QUIT → structural or safety exit.
Safety Exits
🐢 Idle Stop — no Stars for N bars.
🧯 Freeze Failsafe — STAT inactivity.
QUIT is a controlled termination, not failure. Each exit is recorded with a short cause tag.
🧾 Trade Memory & Journaling
Every trade produces immutable records. Entry: time, price, side, confirmation index. Exit: time, price, PnL, result, cause. These records power tables, alerts, JSON output, and external automation.
📊 Time-Block Performance (NY Clock)
Performance is grouped by real time, not bar count. Rolling NY blocks (e.g. 3 hours). Independent statistics per block. Live trades persist across block boundaries. This enables session-based analysis.
🔔 Alerts & Automation
Alerts are state-based: Entry confirmed → Long / Short alert. Trade closed → Exit alert. Optional JSON output allows integration with bots, journals, and dashboards.
Summary
The Star Engine is a component-based trade execution system, where Bomb measures pressure, Golden validates structure, Stars qualify impulses, clusters define runs, entry is delayed by confirmation, stats measure reality, exits are deterministic, and results are time-aware. It is not designed to “predict the market”, but to control how trades are formed, managed, and evaluated.
