YY Price LimitsThis Pine Script indicator is designed to visualize potential price limits (e.g., daily price limits used in some markets like commodities) on a TradingView chart. It calculates and plots lines representing percentage-based price limits above and below a reference price (typically the previous day's close). The indicator allows you to customize the displayed price limits, their appearance, and how they extend across the chart. It's particularly useful for intraday traders who need to be aware of potential price ceilings and floors.
Key Features:
Percentage-Based Limits:
Calculates price limits based on percentages (3%, 5%, and 7%) of a reference price.
Customizable Display:
Toggle visibility of reference price and each percentage limit (3%, 5%, 7%).
Customize the color, style (solid, dashed, dotted), and width of the price limit lines.
Extends Lines: Allows you to extend the price limit lines to the left, right, both directions, or not at all.
CME Reference Price: It is designed to plot price limits based on the CME (Chicago Mercantile Exchange) methodology, which uses the last close as the reference price. The tooltip reminds users to verify the actual reference price on the CME Group website.
Intraday Focus: The indicator is specifically designed for intraday timeframes, as it uses the previous day's close as the reference point.
Clear Visuals: Plots horizontal lines with labels indicating the price level and percentage.
ابحث في النصوص البرمجية عن "CME"

Request█ OVERVIEW
This library is a tool for Pine Script™ programmers that consolidates access to a wide range of lesser-known data feeds available on TradingView, including metrics from the FRED database, FINRA short sale volume, open interest, and COT data. The functions in this library simplify requests for these data feeds, making them easier to retrieve and use in custom scripts.
█ CONCEPTS
Federal Reserve Economic Data (FRED)
FRED (Federal Reserve Economic Data) is a comprehensive online database curated by the Federal Reserve Bank of St. Louis. It provides free access to extensive economic and financial data from U.S. and international sources. FRED includes numerous economic indicators such as GDP, inflation, employment, and interest rates. Additionally, it provides financial market data, regional statistics, and international metrics such as exchange rates and trade balances.
Sourced from reputable organizations, including U.S. government agencies, international institutions, and other public and private entities, FRED enables users to analyze over 825,000 time series, download their data in various formats, and integrate their information into analytical tools and programming workflows.
On TradingView, FRED data is available from ticker identifiers with the "FRED:" prefix. Users can search for FRED symbols in the "Symbol Search" window, and Pine scripts can retrieve data for these symbols via `request.*()` function calls.
FINRA Short Sale Volume
FINRA (the Financial Industry Regulatory Authority) is a non-governmental organization that supervises and regulates U.S. broker-dealers and securities professionals. Its primary aim is to protect investors and ensure integrity and transparency in financial markets.
FINRA's Short Sale Volume data provides detailed information about daily short-selling activity across U.S. equity markets. This data tracks the volume of short sales reported to FINRA's trade reporting facilities (TRFs), including shares sold on FINRA-regulated Alternative Trading Systems (ATSs) and over-the-counter (OTC) markets, offering transparent access to short-selling information not typically available from exchanges. This data helps market participants, researchers, and regulators monitor trends in short-selling and gain insights into bearish sentiment, hedging strategies, and potential market manipulation. Investors often use this data alongside other metrics to assess stock performance, liquidity, and overall trading activity.
It is important to note that FINRA's Short Sale Volume data does not consolidate short sale information from public exchanges and excludes trading activity that is not publicly disseminated.
TradingView provides ticker identifiers for requesting Short Sale Volume data with the format "FINRA:_SHORT_VOLUME", where "" is a supported U.S. equities symbol (e.g., "AAPL").
Open Interest (OI)
Open interest is a cornerstone indicator of market activity and sentiment in derivatives markets such as options or futures. In contrast to volume, which measures the number of contracts opened or closed within a period, OI measures the number of outstanding contracts that are not yet settled. This distinction makes OI a more robust indicator of how money flows through derivatives, offering meaningful insights into liquidity, market interest, and trends. Many traders and investors analyze OI alongside volume and price action to gain an enhanced perspective on market dynamics and reinforce trading decisions.
TradingView offers many ticker identifiers for requesting OI data with the format "_OI", where "" represents a derivative instrument's ticker ID (e.g., "COMEX:GC1!").
Commitment of Traders (COT)
Commitment of Traders data provides an informative weekly breakdown of the aggregate positions held by various market participants, including commercial hedgers, non-commercial speculators, and small traders, in the U.S. derivative markets. Tallied and managed by the Commodity Futures Trading Commission (CFTC) , these reports provide traders and analysts with detailed insight into an asset's open interest and help them assess the actions of various market players. COT data is valuable for gaining a deeper understanding of market dynamics, sentiment, trends, and liquidity, which helps traders develop informed trading strategies.
TradingView has numerous ticker identifiers that provide access to time series containing data for various COT metrics. To learn about COT ticker IDs and how they work, see our LibraryCOT publication.
█ USING THE LIBRARY
Common function characteristics
• This library's functions construct ticker IDs with valid formats based on their specified parameters, then use them as the `symbol` argument in request.security() to retrieve data from the specified context.
• Most of these functions automatically select the timeframe of a data request because the data feeds are not available for all timeframes.
• All the functions have two overloads. The first overload of each function uses values with the "simple" qualifier to define the requested context, meaning the context does not change after the first script execution. The second accepts "series" values, meaning it can request data from different contexts across executions.
• The `gaps` parameter in most of these functions specifies whether the returned data is `na` when a new value is unavailable for request. By default, its value is `false`, meaning the call returns the last retrieved data when no new data is available.
• The `repaint` parameter in applicable functions determines whether the request can fetch the latest unconfirmed values from a higher timeframe on realtime bars, which might repaint after the script restarts. If `false`, the function only returns confirmed higher-timeframe values to avoid repainting. The default value is `true`.
`fred()`
The `fred()` function retrieves the most recent value of a specified series from the Federal Reserve Economic Data (FRED) database. With this function, programmers can easily fetch macroeconomic indicators, such as GDP and unemployment rates, and use them directly in their scripts.
How it works
The function's `fredCode` parameter accepts a "string" representing the unique identifier of a specific FRED series. Examples include "GDP" for the "Gross Domestic Product" series and "UNRATE" for the "Unemployment Rate" series. Over 825,000 codes are available. To access codes for available series, search the FRED website .
The function adds the "FRED:" prefix to the specified `fredCode` to construct a valid FRED ticker ID (e.g., "FRED:GDP"), which it uses in request.security() to retrieve the series data.
Example Usage
This line of code requests the latest value from the Gross Domestic Product series and assigns the returned value to a `gdpValue` variable:
float gdpValue = fred("GDP")
`finraShortSaleVolume()`
The `finraShortSaleVolume()` function retrieves EOD data from a FINRA Short Sale Volume series. Programmers can call this function to retrieve short-selling information for equities listed on supported exchanges, namely NASDAQ, NYSE, and NYSE ARCA.
How it works
The `symbol` parameter determines which symbol's short sale volume information is retrieved by the function. If the value is na , the function requests short sale volume data for the chart's symbol. The argument can be the name of the symbol from a supported exchange (e.g., "AAPL") or a ticker ID with an exchange prefix ("NASDAQ:AAPL"). If the `symbol` contains an exchange prefix, it must be one of the following: "NASDAQ", "NYSE", "AMEX", or "BATS".
The function constructs a ticker ID in the format "FINRA:ticker_SHORT_VOLUME", where "ticker" is the symbol name without the exchange prefix (e.g., "AAPL"). It then uses the ticker ID in request.security() to retrieve the available data.
Example Usage
This line of code retrieves short sale volume for the chart's symbol and assigns the result to a `shortVolume` variable:
float shortVolume = finraShortSaleVolume(syminfo.tickerid)
This example requests short sale volume for the "NASDAQ:AAPL" symbol, irrespective of the current chart:
float shortVolume = finraShortSaleVolume("NASDAQ:AAPL")
`openInterestFutures()` and `openInterestCrypto()`
The `openInterestFutures()` function retrieves EOD open interest (OI) data for futures contracts. The `openInterestCrypto()` function provides more granular OI data for cryptocurrency contracts.
How they work
The `openInterestFutures()` function retrieves EOD closing OI information. Its design is focused primarily on retrieving OI data for futures, as only EOD OI data is available for these instruments. If the chart uses an intraday timeframe, the function requests data from the "1D" timeframe. Otherwise, it uses the chart's timeframe.
The `openInterestCrypto()` function retrieves opening, high, low, and closing OI data for a cryptocurrency contract on a specified timeframe. Unlike `openInterest()`, this function can also retrieve granular data from intraday timeframes.
Both functions contain a `symbol` parameter that determines the symbol for which the calls request OI data. The functions construct a valid OI ticker ID from the chosen symbol by appending "_OI" to the end (e.g., "CME:ES1!_OI").
The `openInterestFutures()` function requests and returns a two-element tuple containing the futures instrument's EOD closing OI and a "bool" condition indicating whether OI is rising.
The `openInterestCrypto()` function requests and returns a five-element tuple containing the cryptocurrency contract's opening, high, low, and closing OI, and a "bool" condition indicating whether OI is rising.
Example usage
This code line calls `openInterest()` to retrieve EOD OI and the OI rising condition for a futures symbol on the chart, assigning the values to two variables in a tuple:
= openInterestFutures(syminfo.tickerid)
This line retrieves the EOD OI data for "CME:ES1!", irrespective of the current chart's symbol:
= openInterestFutures("CME:ES1!")
This example uses `openInterestCrypto()` to retrieve OHLC OI data and the OI rising condition for a cryptocurrency contract on the chart, sampled at the chart's timeframe. It assigns the returned values to five variables in a tuple:
= openInterestCrypto(syminfo.tickerid, timeframe.period)
This call retrieves OI OHLC and rising information for "BINANCE:BTCUSDT.P" on the "1D" timeframe:
= openInterestCrypto("BINANCE:BTCUSDT.P", "1D")
`commitmentOfTraders()`
The `commitmentOfTraders()` function retrieves data from the Commitment of Traders (COT) reports published by the Commodity Futures Trading Commission (CFTC). This function significantly simplifies the COT request process, making it easier for programmers to access and utilize the available data.
How It Works
This function's parameters determine different parts of a valid ticker ID for retrieving COT data, offering a streamlined alternative to constructing complex COT ticker IDs manually. The `metricName`, `metricDirection`, and `includeOptions` parameters are required. They specify the name of the reported metric, the direction, and whether it includes information from options contracts.
The function also includes several optional parameters. The `CFTCCode` parameter allows programmers to request data for a specific report code. If unspecified, the function requests data based on the chart symbol's root prefix, base currency, or quoted currency, depending on the `mode` argument. The call can specify the report type ("Legacy", "Disaggregated", or "Financial") and metric type ("All", "Old", or "Other") with the `typeCOT` and `metricType` parameters.
Explore the CFTC website to find valid report codes for specific assets. To find detailed information about the metrics included in the reports and their meanings, see the CFTC's Explanatory Notes .
View the function's documentation below for detailed explanations of its parameters. For in-depth information about COT ticker IDs and more advanced functionality, refer to our previously published COT library .
Available metrics
Different COT report types provide different metrics . The tables below list all available metrics for each type and their applicable directions:
+------------------------------+------------------------+
| Legacy (COT) Metric Names | Directions |
+------------------------------+------------------------+
| Open Interest | No direction |
| Noncommercial Positions | Long, Short, Spreading |
| Commercial Positions | Long, Short |
| Total Reportable Positions | Long, Short |
| Nonreportable Positions | Long, Short |
| Traders Total | No direction |
| Traders Noncommercial | Long, Short, Spreading |
| Traders Commercial | Long, Short |
| Traders Total Reportable | Long, Short |
| Concentration Gross LT 4 TDR | Long, Short |
| Concentration Gross LT 8 TDR | Long, Short |
| Concentration Net LT 4 TDR | Long, Short |
| Concentration Net LT 8 TDR | Long, Short |
+------------------------------+------------------------+
+-----------------------------------+------------------------+
| Disaggregated (COT2) Metric Names | Directions |
+-----------------------------------+------------------------+
| Open Interest | No Direction |
| Producer Merchant Positions | Long, Short |
| Swap Positions | Long, Short, Spreading |
| Managed Money Positions | Long, Short, Spreading |
| Other Reportable Positions | Long, Short, Spreading |
| Total Reportable Positions | Long, Short |
| Nonreportable Positions | Long, Short |
| Traders Total | No Direction |
| Traders Producer Merchant | Long, Short |
| Traders Swap | Long, Short, Spreading |
| Traders Managed Money | Long, Short, Spreading |
| Traders Other Reportable | Long, Short, Spreading |
| Traders Total Reportable | Long, Short |
| Concentration Gross LE 4 TDR | Long, Short |
| Concentration Gross LE 8 TDR | Long, Short |
| Concentration Net LE 4 TDR | Long, Short |
| Concentration Net LE 8 TDR | Long, Short |
+-----------------------------------+------------------------+
+-------------------------------+------------------------+
| Financial (COT3) Metric Names | Directions |
+-------------------------------+------------------------+
| Open Interest | No Direction |
| Dealer Positions | Long, Short, Spreading |
| Asset Manager Positions | Long, Short, Spreading |
| Leveraged Funds Positions | Long, Short, Spreading |
| Other Reportable Positions | Long, Short, Spreading |
| Total Reportable Positions | Long, Short |
| Nonreportable Positions | Long, Short |
| Traders Total | No Direction |
| Traders Dealer | Long, Short, Spreading |
| Traders Asset Manager | Long, Short, Spreading |
| Traders Leveraged Funds | Long, Short, Spreading |
| Traders Other Reportable | Long, Short, Spreading |
| Traders Total Reportable | Long, Short |
| Concentration Gross LE 4 TDR | Long, Short |
| Concentration Gross LE 8 TDR | Long, Short |
| Concentration Net LE 4 TDR | Long, Short |
| Concentration Net LE 8 TDR | Long, Short |
+-------------------------------+------------------------+
Example usage
This code line retrieves "Noncommercial Positions (Long)" data, without options information, from the "Legacy" report for the chart symbol's root, base currency, or quote currency:
float nonCommercialLong = commitmentOfTraders("Noncommercial Positions", "Long", false)
This example retrieves "Managed Money Positions (Short)" data, with options included, from the "Disaggregated" report:
float disaggregatedData = commitmentOfTraders("Managed Money Positions", "Short", true, "", "Disaggregated")
█ NOTES
• This library uses dynamic requests , allowing dynamic ("series") arguments for the parameters defining the context (ticker ID, timeframe, etc.) of a `request.*()` function call. With this feature, a single `request.*()` call instance can flexibly retrieve data from different feeds across historical executions. Additionally, scripts can use such calls in the local scopes of loops, conditional structures, and even exported library functions, as demonstrated in this script. All scripts coded in Pine Script™ v6 have dynamic requests enabled by default. To learn more about the behaviors and limitations of this feature, see the Dynamic requests section of the Pine Script™ User Manual.
• The library's example code offers a simple demonstration of the exported functions. The script retrieves available data using the function specified by the "Series type" input. The code requests a FRED series or COT (Legacy), FINRA Short Sale Volume, or Open Interest series for the chart's symbol with specific parameters, then plots the retrieved data as a step-line with diamond markers.
Look first. Then leap.
█ EXPORTED FUNCTIONS
This library exports the following functions:
fred(fredCode, gaps)
Requests a value from a specified Federal Reserve Economic Data (FRED) series. FRED is a comprehensive source that hosts numerous U.S. economic datasets. To explore available FRED datasets and codes, search for specific categories or keywords at fred.stlouisfed.org Calls to this function count toward a script's `request.*()` call limit.
Parameters:
fredCode (series string) : The unique identifier of the FRED series. The function uses the value to create a valid ticker ID for retrieving FRED data in the format `"FRED:fredCode"`. For example, `"GDP"` refers to the "Gross Domestic Product" series ("FRED:GDP"), and `"GFDEBTN"` refers to the "Federal Debt: Total Public Debt" series ("FRED:GFDEBTN").
gaps (simple bool) : Optional. If `true`, the function returns a non-na value only when a new value is available from the requested context. If `false`, the function returns the latest retrieved value when new data is unavailable. The default is `false`.
Returns: (float) The value from the requested FRED series.
finraShortSaleVolume(symbol, gaps, repaint)
Requests FINRA daily short sale volume data for a specified symbol from one of the following exchanges: NASDAQ, NYSE, NYSE ARCA. If the chart uses an intraday timeframe, the function requests data from the "1D" timeframe. Otherwise, it uses the chart's timeframe. Calls to this function count toward a script's `request.*()` call limit.
Parameters:
symbol (series string) : The symbol for which to request short sale volume data. If the specified value contains an exchange prefix, it must be one of the following: "NASDAQ", "NYSE", "AMEX", "BATS".
gaps (simple bool) : Optional. If `true`, the function returns a non-na value only when a new value is available from the requested context. If `false`, the function returns the latest retrieved value when new data is unavailable. The default is `false`.
repaint (simple bool) : Optional. If `true` and the chart's timeframe is intraday, the value requested on realtime bars may change its time offset after the script restarts its executions. If `false`, the function returns the last confirmed period's values to avoid repainting. The default is `true`.
Returns: (float) The short sale volume for the specified symbol or the chart's symbol.
openInterestFutures(symbol, gaps, repaint)
Requests EOD open interest (OI) and OI rising information for a valid futures symbol. If the chart uses an intraday timeframe, the function requests data from the "1D" timeframe. Otherwise, it uses the chart's timeframe. Calls to this function count toward a script's `request.*()` call limit.
Parameters:
symbol (series string) : The symbol for which to request open interest data.
gaps (simple bool) : Optional. If `true`, the function returns non-na values only when new values are available from the requested context. If `false`, the function returns the latest retrieved values when new data is unavailable. The default is `false`.
repaint (simple bool) : Optional. If `true` and the chart's timeframe is intraday, the value requested on realtime bars may change its time offset after the script restarts its executions. If `false`, the function returns the last confirmed period's values to avoid repainting. The default is `true`.
Returns: ( ) A tuple containing the following values:
- The closing OI value for the symbol.
- `true` if the closing OI is above the previous period's value, `false` otherwise.
openInterestCrypto(symbol, timeframe, gaps, repaint)
Requests opening, high, low, and closing open interest (OI) data and OI rising information for a valid cryptocurrency contract on a specified timeframe. Calls to this function count toward a script's `request.*()` call limit.
Parameters:
symbol (series string) : The symbol for which to request open interest data.
timeframe (series string) : The timeframe of the data request. If the timeframe is lower than the chart's timeframe, it causes a runtime error.
gaps (simple bool) : Optional. If `true`, the function returns non-na values only when new values are available from the requested context. If `false`, the function returns the latest retrieved values when new data is unavailable. The default is `false`.
repaint (simple bool) : Optional. If `true` and the `timeframe` represents a higher timeframe, the function returns unconfirmed values from the timeframe on realtime bars, which repaint when the script restarts its executions. If `false`, it returns only confirmed higher-timeframe values to avoid repainting. The default is `true`.
Returns: ( ) A tuple containing the following values:
- The opening, high, low, and closing OI values for the symbol, respectively.
- `true` if the closing OI is above the previous period's value, `false` otherwise.
commitmentOfTraders(metricName, metricDirection, includeOptions, CFTCCode, typeCOT, mode, metricType)
Requests Commitment of Traders (COT) data with specified parameters. This function provides a simplified way to access CFTC COT data available on TradingView. Calls to this function count toward a script's `request.*()` call limit. For more advanced tools and detailed information about COT data, see TradingView's LibraryCOT library.
Parameters:
metricName (series string) : One of the valid metric names listed in the library's documentation and source code.
metricDirection (series string) : Metric direction. Possible values are: "Long", "Short", "Spreading", and "No direction". Consult the library's documentation or code to see which direction values apply to the specified metric.
includeOptions (series bool) : If `true`, the COT symbol includes options information. Otherwise, it does not.
CFTCCode (series string) : Optional. The CFTC code for the asset. For example, wheat futures (root "ZW") have the code "001602". If one is not specified, the function will attempt to get a valid code for the chart symbol's root, base currency, or main currency.
typeCOT (series string) : Optional. The type of report to request. Possible values are: "Legacy", "Disaggregated", "Financial". The default is "Legacy".
mode (series string) : Optional. Specifies the information the function extracts from a symbol. Possible modes are:
- "Root": The function extracts the futures symbol's root prefix information (e.g., "ES" for "ESH2020").
- "Base currency": The function extracts the first currency from a currency pair (e.g., "EUR" for "EURUSD").
- "Currency": The function extracts the currency of the symbol's quoted values (e.g., "JPY" for "TSE:9984" or "USDJPY").
- "Auto": The function tries the first three modes (Root -> Base currency -> Currency) until it finds a match.
The default is "Auto". If the specified mode is not available for the symbol, it causes a runtime error.
metricType (series string) : Optional. The metric type. Possible values are: "All", "Old", "Other". The default is "All".
Returns: (float) The specified Commitment of Traders data series. If no data is available, it causes a runtime error.

COT Report Indicator - V2Hi this is the updated script for COT Report Indicator
Thanks for @Trading_Nerd
Now it's using v6 instead of v5.
It has debug info for showing the symbol
It includes BTC/ETH for CME, but you need to choose the symbol BTC or ETH from CME and use the W timeframe at least.

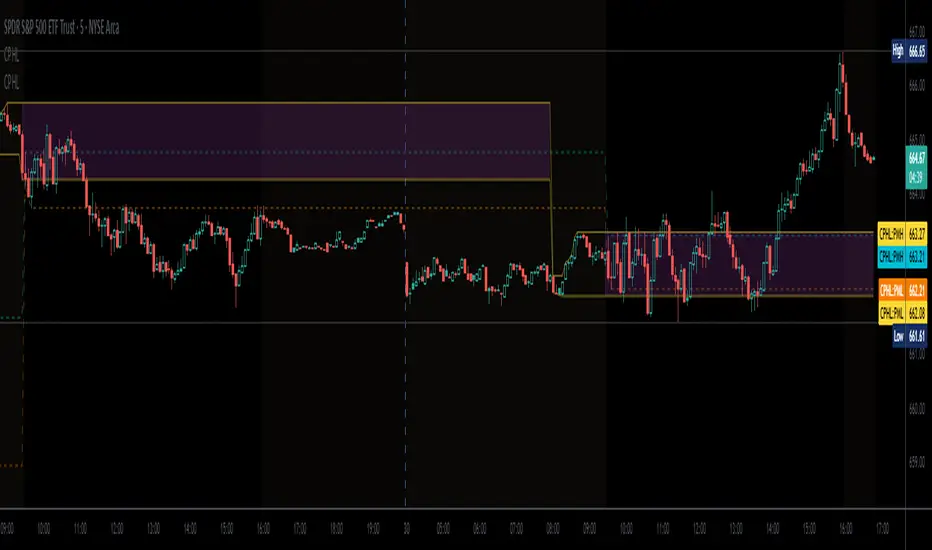
Auction Session Ranges (AMT Edition) [ Alerts] Auction Session Ranges (AMT Edition)
► Overview
The Session Ranges ( AMT Edition) is a session-based market structure and auction analysis tool designed to visually reveal acceptance, rejection, imbalance, and continuation across the Asia, London, and New York CME trading sessions.
Unlike typical indicators, this script is grounded in Auction Market Theory (AMT) and session-based structure, focusing on how price behaves at session extremes rather than relying on lagging calculations, oscillators, or predictive algorithms. Its purpose is to highlight areas where the market has earned the right to be traded, providing traders with a clear, rules-based framework for high-probability directional trades.
Important for backtesting: To properly backtest session extremes, Interaction Lines, and Closest Opposite Extreme Lines, you must use TradingView’s replay mode, as real-time bar-by-bar progression is required to observe how the market interacts with session extremes over time.
► Key Innovations
This is not a conventional session high/low indicator. Its originality comes from several unique design elements:
Differentiates interaction from true acceptance: Price touching an extreme does not automatically indicate directional intent.
Separates directional confirmation from range-bound indecision: Only confirmed crossings beyond the Interaction Line signal actionable bias.
Tracks failed auctions and partial acceptance: No volume profile or order book data required.
Visual, rule-based trade permission: Signals are objective, minimizing subjective interpretation.
Interaction & Closest Opposite Extreme Lines: Together, these lines map how far an auction progresses after an extreme is tested, highlighting continuation, partial acceptance, or failed auctions.
► Core Concepts Explained
1. Session Highs & Lows (Solid Lines)
Plotted continuously for each CME session (Asia, London, New York).
Represent the current auction boundaries for that session.
2. True Interaction Lines (Thick Dotted Lines)
Drawn when price touches or breaks a session extreme:
Touching session high → dotted line at the low of that candle
Touching session low → dotted line at the high of that candle
Auction context:
Touching alone ≠ acceptance
Acceptance occurs only when price moves beyond the Interaction Line and holds
Trading principle:
Price has not crossed → no directional bias → do not trade
Price crosses and holds → directional bias established
3. Acceptance vs Rejection
Accepted direction: Price crosses and holds beyond the Interaction Line
Rejected direction: Price crosses the line but immediately reverses
Neutral / No-Trade: Price trapped between extreme and Interaction Line
Important: Acceptance is conditional and dynamic. Each time price crosses back over the Interaction Line, acceptance is lost.
4. New Extremes = Continuation
Once an Interaction Line is crossed, each new session extreme in that direction reinforces the trend.
Traders should only look for continuation setups along the established directional bias.
AMT interpretation:
Repeated new extremes → directional imbalance
Failure to make new extremes → potential balance or rotation
5. Closest Opposite Extreme Lines (Thin Dotted Lines)
After acceptance, the script tracks price progress toward the opposite session extreme.
Plotted only if price reaches a user-defined percentage of the session range.
Helps identify:
Full acceptance (price reaches opposite extreme)
Partial acceptance (price stalls)
Failed auctions (price cannot progress meaningfully)
Trading guidance once Closest Lines appear:
Partial acceptance: Price stalls near the Closest Line but does not fully reach the opposite extreme → bias remains valid, but the move may be weakening; consider scaling out or tightening stops.
Full acceptance: Price reaches the opposite extreme → directional auction fully confirmed; bias continues, but expect potential rotation or balance afterward.
Failed auction (cannot progress meaningfully): Price reverses before reaching the Closest Line → signals exhaustion; avoid chasing the move and treat as potential trend failure.
Note: Only relevant after Interaction Line is crossed; if price never crosses the Interaction Line, Closest Lines have no trading significance.
► Step-by-Step Usage
Wait for a session extreme
Let price interact with the session high or low.
Observe the Interaction Line
No cross → do not trade
Cross and hold → directional bias established
Trade in the direction of new extremes only
Ignore counter-trend trades unless the Interaction Line is lost
Manage risk using structure
Interaction Line acts as a dynamic invalidation level
Use Closest Lines for context
Partial acceptance → bias valid, watch for weakening
Full acceptance → bias strong, continuation likely
Failed attempt → potential exhaustion, do not chase
Useful for trade management, scaling, and expectation setting
► Price Retests & Pullbacks
Scenario:
Price crosses above the Interaction Line (e.g., from a low interaction).
Over the next 3–4 15-minute bars, price dips back toward the Interaction Line, with wicks touching it but no decisive close below.
Interpretation:
Initial Acceptance Confirmed: Bias remains valid while price holds above/below the line.
Temporary Pullback / Retest: Market is re-evaluating the auction; testing participant agreement.
Wicks Touching the Line: Partial probing or liquidity sweep; market still respects original acceptance.
Trading Implication:
Continuation bias remains intact.
Pullbacks near the Interaction Line offer lower-risk entries.
Decisive close below → acceptance lost, signaling trend failure or invalidation.
Market Psychology:
Healthy auction behavior: extreme tested → acceptance confirmed → boundary retested for liquidity → continuation.
Failure to hold above signals weak acceptance or exhaustion.
✅ Key Takeaways:
Holding above Interaction Line → bias intact, pullback = opportunity
Closing below Interaction Line → acceptance lost, bias invalidated
Wicks touching only → normal retest, still valid
► No-Trade Conditions
Avoid trading when:
Price never crosses the Interaction Line
Price remains trapped between the extreme and the Interaction Line
Market rotates without forming new extremes
These indicate balance, not directional opportunity.
► Alerts
Optional alerts trigger when price crosses an Interaction Line for:
Asia session
London session
New York session
Alerts signal possible acceptance, not automatic trade entries.
► Who This Script Is For
Best suited for traders who:
Trade session structure in futures, indices, or FX
Follow Auction Market Theory principles
Prefer objective, rules-based confirmation
Want fewer but higher-quality trade opportunities
Not intended for:
Indicator stacking
Predictive trading
High-frequency scalping without structure
► Final Notes
This script does not tell you when to buy or sell.
It shows where the market has earned the right to be traded.
Use it as a decision filter, not a prediction engine.

Volume Delta Divergence Candle ColorThis indicator identifies divergences between price action and volume delta, highlighting potential reversal or continuation signals by coloring candles when buyer/seller pressure conflicts with the candle's direction.
**How It Works:**
The indicator analyzes real-time up/down volume data to detect two types of divergences:
🟣 **Seller Divergence (Fuscia)** - Occurs when a candle closes bullish (green) but the volume delta is negative, indicating more selling pressure despite the upward price movement. This suggests weak buying or potential distribution.
🔵 **Buyer Divergence (Cyan)** - Occurs when a candle closes bearish (red) but the volume delta is positive, indicating more buying pressure despite the downward price movement. This suggests weak selling or potential accumulation.
**Features:**
✓ Colors only divergent candles - non-divergent candles maintain your chart's default colors
✓ Uses actual exchange volume delta data (works best with CME futures and other instruments with tick-level data)
✓ Optional triangle markers above/below divergent candles for quick visual identification
✓ Clean, minimal design that doesn't clutter your chart
**Best Used For:**
- Identifying potential reversals or continuations
- Spotting weak price movements that may not follow through
- Confirming price action with underlying volume pressure
- Works on any timeframe with available volume delta data
**Note:** This indicator requires volume data from exchanges that provide tick-level information (CME futures, cryptocurrency exchanges, etc.). Results may vary on instruments with limited volume data.

Friday’s Close – Futures Weekend AnchorPurpose:
This indicator highlights the US futures weekend close price — the exact level where CME markets end trading on Friday at 4:00 PM CT / 5:00 PM ET.
It’s designed primarily for crypto traders who want to compare weekend market behavior to the traditional finance (TradFi) close.
Why it matters:
Crypto trades 24/7, but global liquidity and sentiment still pivot around the Friday futures close. During the weekend, crypto can “drift” relative to traditional markets — this line shows exactly where the week ended for Wall Street, giving you a clean reference point until futures reopen on Sunday evening.
Features
Precise Friday close capture (CME weekend close minute, not just daily bar)
Works on any ticker — especially useful for BTC, ETH, or other crypto assets
Adjustable for time zone (New York / Chicago / custom)
Option to select prior weeks with weekOffset
Draws a single clean line from Friday’s close forward — no clutter, no vertical stitches
Optional right-edge label with the close value and timestamp
Usage Tips
Keep the chart’s timezone in sync with your anchor (America/New_York = 5 PM ET, America/Chicago = 4 PM CT).
Use weekOffset = 1 to view last week’s Friday close.
Combine with volume, funding, or open interest indicators to see how weekend moves relate to the TradFi close.
Ideal for weekend analysis — shows whether crypto is trading rich or cheap vs. the Friday benchmark before futures reopen.
Recommended For
Crypto traders, analysts, and quant enthusiasts who monitor TradFi–crypto decoupling or weekend premium behavior.

Session Opens by TradeSeekersIt doesn't get much simpler than this indicator for futures traders wanting to track four key session open prices.
Sessions
1. ETH open - extended hours starts
2. Midnight open - new calendar day starts
3. CME open - Chicago exchange opens, data releases
4. RTH open - regular trading hours, volume cometh
Usage
All four of these prices / areas are important for futures traders to pay attention to.
RTH opens far below ETH sometimes will retrace, CME and RTH together can act as a powerful range.
Midnight open sometimes has little importance for the day, but then again it's provided beautiful bounces. Again each level I find to be impactful nearly every session, so I like to keep them close by in an understated manner.
Timezone
If you're not EST, adjust the timezone string accordingly (refer to TradingView docs for string formats).
Proximity Detection
Also, I added proximity detection that aims to keep level collisions from occurring. If a particular session open isn't shown it may be due to being exactly the same price as another open or it's too close to another open.
The proximity sensitivity can be adjusted in settings. The on chart appearance doesn't impact the alerting capability.
Aesthetics
I don't like boring charts so I added a fun "glow" effect, I went with a palette that reminded me of clear sky colors at those times of day (if you're EST).
Alerting
Alerting can be done with just a single alert, first open the indicator config and uncheck any session opens you don't want to be alerted on (why!?), and then use the standard alert menus in TradingView to set the alert on "Any alert() function call".
Why does this beautiful indicator exist?
While there are a handful of indicators that plot open prices with some overlap to this one, I didn't see any that alerted automatically without much fuss.

Global Risk Terminal – Multi-Asset Macro Sentiment IndicatorDescription:
The Global Risk Terminal is a sophisticated macro sentiment indicator that synthesizes signals from three key cross-asset relationships to produce a single, actionable risk appetite score. It is designed to help traders and investors identify whether global markets are in a risk-on (growth-seeking) or risk-off (defensive) regime. The indicator analyzes the behavior of commodities, equities, bonds, and currencies to generate a comprehensive view of market conditions.
Indicator Output:
The Global Risk Terminal produces a normalized risk score ranging from -1 to +1:
Positive values indicate risk-on conditions (growth assets favored)
Negative values indicate risk-off conditions (safe-haven assets favored)
Core Components:
Growth Pulse (Copper to Gold Ratio, HG/GC)
Purpose: Measures investor preference for industrial growth versus safe-haven assets.
Interpretation:
Rising ratio → Copper outperforming gold → Risk-on environment
Falling ratio → Gold outperforming copper → Risk-off environment
Flat ratio → Transitional market phase
Technical Implementation: Dual moving average slope method (fast MA default 20, slow MA default 40). Positive slope = +1, negative slope = -1, flat slope = 0
Equity Rotation (Russell 2000 to S&P 500 Ratio, RTY/ES)
Purpose: Tracks rotation between small-cap and large-cap equities, revealing market risk appetite.
Interpretation:
Rising ratio → Small-caps outperforming → Strong risk-on
Falling ratio → Large-caps outperforming → Defensive positioning
Technical Implementation: Dual moving average slope method (same as Growth Pulse)
Flow Gauge (10-Year Treasury to US Dollar Index, ZN/DXY)
Purpose: Captures liquidity conditions and cross-asset capital flows.
Interpretation:
Rising ratio → Treasury prices rising or USD weakening → Liquidity expansion, risk-on environment
Falling ratio → Treasury prices falling or USD strengthening → Liquidity contraction, risk-off environment
Technical Implementation: Dual moving average slope method
Composite Risk Score Calculation:
Analyze each component for trend using dual moving averages
Assign signal values: +1 (risk-on), -1 (risk-off), 0 (neutral)
Average the three signals:
Risk Score = (Growth Pulse + Equity Rotation + Flow Gauge) / 3
Optional smoothing with exponential moving average (default 3 periods) to reduce noise
Interpreting the Risk Score:
+0.66 to +1.0: Full risk-on – favor cyclical sectors, small-caps, growth strategies
+0.33 to +0.66: Moderate risk-on – mostly bullish environment, watch for fading momentum
-0.33 to +0.33: Neutral/transition – markets in flux, signals mixed, exercise caution
-0.66 to -0.33: Cautious risk-off – favor defensive sectors, reduce high-beta exposure
-1.0 to -0.66: Full risk-off – strong defensive positioning, prioritize safe-haven assets
How to Use the Global Risk Terminal to Frame Trades:
Aligning Trades with Market Regime
Risk-On (+0.33 and above): Look for buying opportunities in cyclical stocks, high-beta equities, commodities, and emerging markets. Use long entries for swing trades or intraday positions, following confirmed price action.
Risk-Off (-0.33 and below): Shift focus to defensive sectors, large-cap quality stocks, U.S. Treasuries, and safe-haven currencies. Prefer short entries or reduced exposure in risky assets.
Entry and Exit Framing
Use the risk score as a macro filter before executing trades:
Example: The risk score is +0.7 (strong risk-on). Prefer long positions in equities or commodities that are showing bullish confirmation on your regular chart.
Conversely, if the risk score is -0.7 (strong risk-off), avoid aggressive longs and consider short or defensive trades.
Watch for threshold crossings (+/-0.33, +/-0.66) as potential inflection points for adjusting position size, stop-loss levels, or sector rotation.
Confirming Trade Decisions
Combine the Global Risk Terminal with price action, volume, and trend indicators:
If equities rally but the risk score is declining, this may indicate a fragile rally driven by few leaders—trade cautiously.
If equities fall but the risk score is rising, consider counter-trend entries or buying dips.
Risk Management and Position Sizing
Strong alignment across components → increase position size and hold with wider stops
Mixed or neutral signals → reduce exposure, tighten stops, or avoid new trades
Defensive regimes → rotate into stable, low-volatility assets and increase cash buffer
Framing Trades Across Timeframes
Use the indicator as a strategic guide rather than a precise timing tool. Even without the MTF table:
Daily trend alignment → Guide swing trade bias
Shorter timeframe price action → Refine entry points and stop placement
Example: Daily chart shows +0.6 risk score → identify high-probability long setups using intraday technical patterns (breakouts, trend continuation).
Sector and Asset Rotation
Risk-On: Focus on cyclical sectors (financials, industrials, materials, energy), small-caps, high-beta instruments
Risk-Off: Focus on defensive sectors (utilities, consumer staples, healthcare), large-caps, safe-haven instruments
Alert Integration
Set alerts on the risk score to notify you when markets move from neutral to risk-on or risk-off regimes. Use these alerts to plan entries, exits, or portfolio adjustments in advance.
Customization Options:
Moving Average Length (5–100): Adjust sensitivity of trend detection
Score Smoothing (1–10): Reduce noise or see raw risk score
Visual Themes: Six preset themes (Cyber, Ocean, Sunset, Monochrome, Matrix, Custom)
Display Options: Show or hide component dashboards, main header, risk level lines, gradient fill, and component signals
Label Size: Tiny, Small, Normal, Large
Alert Conditions:
Risk score crosses above +0.66 → Strong risk-on
Risk score crosses below -0.66 → Strong risk-off
Risk score crosses zero → Neutral line
Risk score crosses above +0.33 → Moderate risk-on
Risk score crosses below -0.33 → Moderate risk-off
Data Sources:
HG1! – Copper Futures (COMEX)
GC1! – Gold Futures (COMEX)
RTY1! – Russell 2000 E-mini Futures (CME)
ES1! – S&P 500 E-mini Futures (CME)
ZN1! – 10-Year U.S. Treasury Note Futures (CBOT)
DXY – U.S. Dollar Index (ICE)
Notes and Limitations:
Works best during clear macro regimes and aligned trends
Use with price action, volume, and other technical tools
Not a standalone trading system; serves as a macro context filter
Equal weighting assumes all three components are equally important, but market conditions may vary
Past performance does not guarantee future results
Conclusion:
The Global Risk Terminal consolidates complex cross-asset signals into a simple, actionable score that informs market regime, portfolio positioning, sector rotation, and trading decisions. Its user-friendly layout and extensive customization options make it suitable for traders of all experience levels seeking macro-driven insights. By framing trades around risk score thresholds and combining macro context with tactical execution, traders can identify higher-probability opportunities and optimize position sizing, entries, and exits across a wide range of market conditions.

Custom Period High LowSummary
I'm moving over from TradeStation and default Pre-Market Session there is 0800-0930. Default PMS on TradingView is 0400-0930. I find that the 0800-0930 High and Low are more accurate levels. This script addresses exactly that - it allows you to grab High and Low of any custom time slot.
This script started as Custom Pre-Market H/L, that's why the shading. Then I realized it can be used for any custom time period, so I renamed it to PERIOD H/L.
Limitations
Different tickers are provided by different exchanges, in different time zones. The end result is that the SAME session time (0800-0930) may shift for different tickers. Examples:
- SPY : 0800-0930 // no shift: NYSE, in NYC
- ES1!: 0900-1030 // shifted 1 hr ahead: CME, in Chicago
- NQ1!: 0900-1030 // shifted 1 hr ahead: CME, in Chicago
To see for yourself, set Time Zone config parameter to empty string for non-NYC tickers like ES1! or NQ1 and watch times for shaded and non-shaded areas.
Why TV chooses to go by the ticker's TZ, and not the TZ that's configured in the lower right corner of my TV screen - I have no idea. But asking for user's TZ is how you fix it.
If you know how I can get that value so I don't have to ask the user - let me know. I'm new to TV.
Hacks
You can use it more than once for, say, Opening Range Breakout. Configure your custom PMS for 0930-0945, change lines, remove area fill - and ta-da - you have High and Low for first 15 min! See release chart for the example.
4 diffs (CB & IBIT Premium)📊 Script Name: 4 diffs (CB & IBIT Premium)
Version: Pine Script® v6
Overlay: Yes (table displayed on chart)
🧠 What it Does:
This script tracks four important Bitcoin price differentials to monitor spot/perpetual/futures price inefficiencies and ETF premium/discounts, and displays them in a live table on the chart. It helps traders identify arbitrage opportunities or institutional pricing signals.
📈 Displayed Metrics:
Coinbase Premium
→ Difference between Coinbase spot and Binance spot prices.
→ Use case: US vs. offshore spot market divergence.
Coinbase Spot vs Binance Perpetual
→ Difference between Coinbase spot and Binance perpetual price.
→ Use case: Spot-perp basis, often used for funding rate insights or market stress.
Bybit vs Binance Perpetual
→ Difference between Bybit perp and Binance perp price.
→ Use case: Compare derivative pricing across major offshore exchanges.
IBIT Premium (CME vs ETF-implied)
→ Compares CME futures price vs. IBIT’s implied spot BTC value
→ IBIT implied BTC = IBIT ETF price ÷ (BTC held / shares outstanding)
→ Use case: Gauge institutional premium/discount and ETF arbitrage clues.
🛠️ Customization:
Text color of the table is adjustable via the input setting.
📌 Visual Output:
A fixed 2×4 table appears in the top-right corner of the chart.
Each row shows a label and the live price difference in USD.

Really Key Levels█ OVERVIEW
This indicator shows the most useful and universally used key trading levels (and only those) in a visually appealing way. Its originality lies in the fact that it was developed due to being unable to find an indicator that wasn't cluttered with other features or far less relevant levels, or one that would indicate the bar causing the level (i.e., not just using a horizontal line over the whole chart), or one that was well-programmed and didn’t frequently refresh for many seconds for no obvious reason, taking far too long to do so for such a seemingly simple indicator.
█ FEATURES
Shows the most frequently used key levels in a visually appealing way
Indicates the bar that causes the level, with the line starting at that bar
Works correctly and consistently on both RTH and ETH charts
Lines can be optionally extended both left and right, if the user prefers
Works with US/European stocks and US futures (at least)
Configurable futures regular session (default time is for CME futures, e.g., ES/NQ, etc.)
Users can configure line colour, style, and thickness
Adjustable label locations to prevent overlap with other indicator labels
Nice defaults that look good, and a well-contrasting label text colour
Well-documented, high-quality, open-source code for those who are interested
█ CONCEPTS
The indicator shows the following levels by a line starting at the bar that causes them:
Current Day RTH High/Low (visible and updated only during RTH; visible with no further updates in the post-market)
Current Day RTH Open (only after the RTH open)
Pre-Market High/Low (as it develops in the pre-market and fixed after RTH open)
Previous Day RTH Close
Previous Day RTH High/Low
Previous Day Pre-Market High-Low
Two Days Ago RTH Close
Other levels may be added in future versions, if requested and if they are Really Key Levels.
Regarding futures: despite being a 23-hour market (for CME futures, 5 p.m. the previous day to 4 p.m. the current day), most trading activity takes place together with the RTH on stock exchanges in New York, 08:30 to 3 p.m. Central (Chicago) time. Therefore, a user-configurable regular market is defined at those times, with times before this (from 5 p.m. the previous day) being considered pre-market, and times after this (until 4 p.m.) being considered post-market.
Care was taken so that the code uses no hard-coded time zones, exchanges, or session times. For this reason, it can in principle work globally. However, it very much depends on the information provided by the exchange, which is reflected in built-in Pine Script variables (see Limitations below).
█ LIMITATIONS
Pre-market levels are not shown when viewing an RTH chart.
The indicator was developed and tested on US/European stocks and US futures. It may or may not work for stocks and futures in other countries (depending on their pre- and post-market definitions and what information the exchange provides to TradingView via the relevant built-in Pine Script variable). It does not work on other security types, especially those with a 24-hour market that don't have a uniquely defined daily close, implicit H/L time window, or a pre-market.

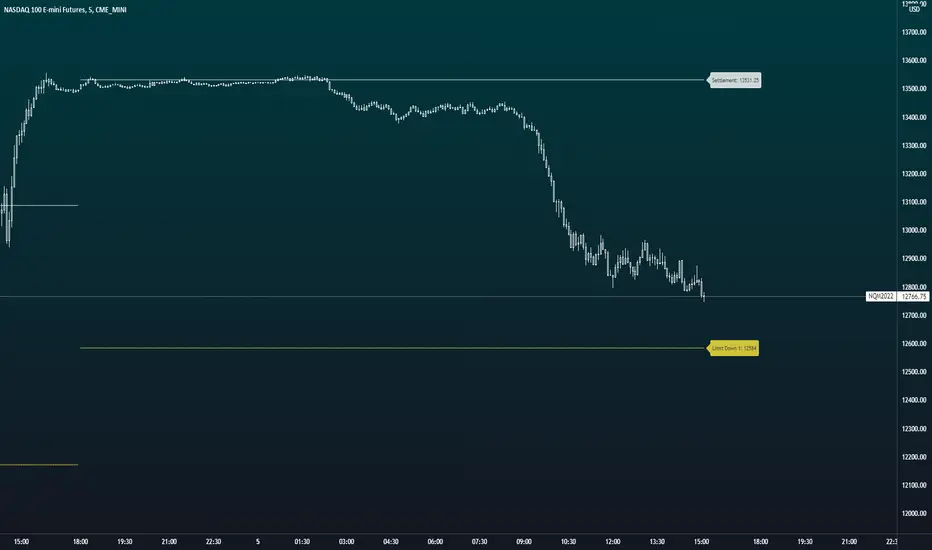
Change % Inteligente - NQ / ES / YMTopstep Compliance: Daily Price Change % Alert (NQ / ES / YM)
Script Purpose
This script helps funded traders (especially those using Topstep or similar programs) monitor the real-time percentage change of major equity index futures: Nasdaq (NQ), S&P 500 (ES), and Dow Jones (YM).
⚠️ Why it matters
Topstep prohibits trading within 2% of the daily price limits set by the CME. If a trader holds a position too close to those limits, they risk account disqualification.
📊 How it works
• Detects the instrument: NQ1!, ES1!, YM1!, or M2025 contracts
• Calculates the real-time % change from today’s market open
• Simulates daily CME price limits (+7% / -7%)
• Highlights when price enters the last 2% of the limit range (prohibited zone)
• Displays a clean, floating panel with the current % change and a warning if necessary
• Sends a visual and optional audio alert when in the prohibited zone
🧠 What makes this script unique?
This tool is **not for technical analysis**. It focuses exclusively on **funding program compliance** and **account protection**, which is not covered by other public scripts. It’s lightweight, intuitive, and designed for traders who manage risk like professionals.
✅ Open-source and ready for review.
✅ CHART SETUP FOR PUBLICATION
✔️ Use a clean chart
✔️ Only apply this script
✔️ Make sure the panel is visible (top-right or top-center recommended)
❌ No extra indicators or drawings
✔️ Use NQM2025, ESM2025 or YMM2025 on a volatile day (to show -1% to -3% range)
INSTRUCTIONS
1. Add the script to your chart.
2. Use it with NQ1!, ES1!, or YM1! (or M2025 contracts).
3. The panel will show today’s price change %.
4. If the market is within the last 2% of the CME price limit, a warning will appear.
5. Use this to avoid violating Topstep’s trading rules during volatile days.
Celestial Pair Spread Hello friends, after a very long time!
Today, I tried to put into code an idea that came to my mind spontaneously and suddenly.
Note :
This script is experimental and improvable.
I haven't had a chance to try it yet.
TIMEFRAME : 1D (Daily Bars)
CELESTIAL SPREAD
The spread moves in a very limited area and is consistent within itself, especially on days far from the end of the contract.
That's why there is a reassuring sky atmosphere. That's why this name was given completely improvised.
Basic logic of the script
We enter the name of the CME Futures contract we want to enter:
Ex : CL1! , ES1! , ZC1! , NQ1!
The script creates us a pair trade parity divided into secondary contracts.
Example : ES1!/ES2!
What is pair trading?
I will explain briefly here.
For users who are wondering:
www.investopedia.com
Let's get back to our topic.
Now we have created a parity that does not actually exist.
This parity is the manifestation of the relative movements of two contracts.
When the parity rises, ES1! increased,ES2! has fallen.
In the opposite case, We can say: ES1! Contract has been dropped ES2! has increased.
Pair trading is generally a trade that needs to be kept in mind from time to time.
It is a method preferred by professionals who can process very quickly.
Market risk is minimal, but since 2 contracts are purchased, more money is paid and very low percentage profits are made.
It is very expensive to do pair trading, especially with oil and its derivatives and interest security derivatives.
The contract we are considering has micros. (small-item contracts tied to the same value)
So when we switch to our broker MES1!/MES2! We will trade.
For all CME futures :
www.cmegroup.com
Anyway, let's continue:
The script created the parity showing its relationship with the next contract and plotted it as bars.
Celestial bands are just like Bollinger bands, but they consist of 3 bands based on percentage changes rather than standard deviation.
The middle band is obtained from moving averages.
The upper and lower bands are the middle band subjected to a threshold value.
The threshold value can be changed.
0.15 percent was charged for this script.
CAUTION :
As can be seen in the example below;
The most important thing is not to make any transactions when the contract switch dates are approaching.
Therefore, it is recommended to use it just below the main chart.
The blue bars in the parity are
Values that outside the upper and lower threshold values are colored blue.
For this condition
Alerts has been added.
Don't forget to add alert and edit.
MAIN PURPOSE
It is aimed to start a pair trade when such conditions come and to quickly close the trades when the parity basis reaches the value.
OTHER IMPORTANT POINTS
Other issues are broker related issues.
Difference between initial margins and maintanence margins of contracts (between 1! and 2!)
It shouldn't be too high.
The commission should not be too high.
Leverage must be high because the profit percentage is very low.
To calculate leverage you must divide your contract size by the relevant margin requirement.
Sample margin requirement table:
www.interactivebrokers.com
RISKS
It is an experimental and intellectual script,
the risk of contract price differences (maybe it will not leave a profit except for very extreme values)
I remind you of the quickness risk that comes from a two-legged trade.
Alerts definitely synchronized with an audible alert sent to a smartphone as an e-mail notification and displayed on the locked screen for quick action.
Best regards!

Auto Fibonacci Levels + Auto Trend Line generatorAnother indicator for you guys!!!
This indicator consists of the 5 key Fibonacci retracement levels, plotted automatically to user input settings. I also have included an auto support/resistance trend line generator.
What is a Fibonacci retracement?
'Fibonacci retracement is a method of technical analysis for determining support and resistance levels. It is named after the Fibonacci sequence of numbers, whose ratios provide price levels to which markets tend to retrace a portion of a move before a trend continues in the original direction.' - Wikipedia
How to use the Fibonacci retracement?
- The Fibonacci levels are default. These percentiles from price to the average of the high in a sample and low in a sample give you a guideline of where a bottom may be, where a top may be, and where a range is being created.
- Look for the price to reject from 61.8% and 76.4%, and also look for price to bounce from 38.2% and 23.6%. If a lower low/higher high is made, the fib levels will follow and the percentiles within will be recalculated after a 5 candle offset period.
- If you see price trending towards the lower percentiles (38&23) and using the 50% as resistance, look for a break downwards and vice versa.
-This Fibonacci set as all others is subject to fake-out, always use this with another series indicator, or don't use it as a signal for entry at all (unless you have a backdated strategy)
How to use the trend line generator?
-The trend line generator will only plot when a lower low/higher high has taken place within the input amount of candles. It is also offset by a user amount.
-The check box will give the option to have the trend line's plot or not.
- If you see a green/red dot it means that that will be your first coordinate for the trend line, and until the computations are complete it will give you an idea of which direction it will be in (resistance or support)
-When opening this indicator zoom out all the way to connect any trend lines that do not load automatically.
Let me know if you have any questions, suggestions or issues! Thank you everyone!
-Cheatcode1 :)
SP:SPX TVC:DXY BMFBOVESPA:EUR1! CME:BTC1! BINANCE:BTCUSDT

U.S. Futures Price LimitsThis scripts plots settlement and the circuit breaker limits for U.S. Equity Indexes. The current limits for the equity index futures are + and - 7%, 13%, and 20% from the previous day's settlement price. If price reaches these levels trading is either paused briefly or for the remainder of the day. The full resource (CME Website) is below.
There are plans to add the remainder of the most actively traded U.S. Futures Markets.
To find out more about the price limits it is best to use the CME's website as a reference.
www.cmegroup.com
ICT Index Futures Vertical LinesLearning to trade is complicated enough, so to make the process it little less daunting, I decided to create something helpful.
This indicator relieves you of drawing the same lines and levels over and over each trading day.
It also provides key price levels for you to watch when the trading session starts.
This project is inspired by the ICT 2022 Mentorship.
This indicator was designed and tested to practice and trade the CME Index Futures like Nasdaq, S&P500 and the DOW.
The concepts by ICT are known to work on other markets like Crypto, but I haven't tested that so use at your own risk.
Features:
When a new trading day starts, the following lipstick is put on the chart:
Vertical lines:
- Globex (Overnight) Session Start @17.00
- New York Midnight @ 00:00
- New York AM Session Start @ 08.30
- CME Open @ 09.30
- New York Lunch Start @12.00
- New York PM Session Start @13.00
- New York PM Session End @ 16.30
Important levels:
- Globex (Overnight) Session Opening price
- Globex (Overnight) Session High
- Globex (Overnight) Session Low
- New York Mignight Opening Price
Additional features:
- Shows the day of the week at the bottom for your convenience
- London Killzone Vertical lines
- London Killzone Highlight
- NY Lunch No-Trade-Zone Highlight
- Important levels have a small label to show their meaning and price
- Almost everything is customizable: colors, line types, times, etc
- Customizable timezone setting in case you don't want to work on ICT's recommended timezone (New York UTC-4)
- Toggle to Show only Today's drawings on the chart. You can choose to display all chart lipstick from almost a month of trading data to do your research. Ideal if you want to determine the daily profiles for example.
Screenshots:
London Killzone Highlight turned on:
Multi Day Lipstick:

[Nekonyam] Auto Select Currency Binance Open InterestDisplays open interest in crypto currencies.
It automatically changes the open interest displayed according to the virtual currency displayed on the chart.
It works even if you are viewing an exchange other than Binance.
It shows open interest according to the base currency, so it works with BTCEUR and other currencies.
ETHBTC, for example, shows the open interest in ETH.
If you are viewing a currency that does not provide open interest from Binance to TradingView, it will not work.
It will not work if ETFs, CME futures, etc. are displayed. (such as GBTC or BTC1!)
仮想通貨のオープンインタレストを表示します。
チャートに表示している仮想通貨に合わせて自動で表示するオープンインタレストを変えます。
バイナンス以外の取引所を表示していても使えます。
ベース通貨に合わせてオープンインタレストを表示しているので、BTCEURなどでも使えます。
ETHBTCなどはETHのオープンインタレストが表示されます。
BinanceからTradingViewにオープンインタレストが提供されていない通貨を表示している場合は使えません。
ETFやCME先物などを表示している場合は使えません。(GBTCやBTC1!など)

Session Levels - Ultimate Range IndicatorSession Levels - Ultimate Range Indicator
Primarily developed for trading the E-MINI Futures Markets like NQ or ES from the CME Group,
but also more than suitable for Crypto or other instruments.
This indicator highlights the chosen session, which can be Globex, Asian, London and New York.
It plots the important levels and also renders the Opening Range as it forms (a.k.a. Initial Balance).
After the 1st hour Opening Range is finished, it can plot the Standard Deviations / Projections.
See below for a complete feature list.
All Opening Ranges on chart and for the New York session the Range Projections are turned on:
s3.tradingview.com
How to use (example):
If you are trading the Nasdaq Futures (NQ!)
Enable the Globex Overnight session. Basically in the Futures Market, the Globex session is everything outside of US trading hours of Stocks. This draws the important overnight levels, like the Low, 25%, 50%, 75% and the High.
Enable the New York Session with Levels and Opening Range. Generally, 70% of the time the 1st hour will put a Low or High of the day.
If the price is trading above the Globex Low, most likely the Low of the Day is formed and the price target for the day will be 1.5x Standard Deviation and 2x Standard Deviation.
[*} Deviation of the Initial Balance depends on the volume ad overall market structure.
** This is not financial advice or any guarantee **
Features:
Show each Session Highlighted on Intraday chart in it's own color (each session can be turned off and has customizable times and color)
Show Line Levels of each session: Low, 25%, 50%, 75% and the High (customizable color)
Show the Opening Range (Initial Balance) of the Asian, London and New York session. Note: NY has more options.
Opening Range is displayed as a box with level lines (customizable color)
Levels are drawn to the end of the NY Cash session (customizable time)
Show IB Standard Deviations 0.5 - 3.0. Calculated from the Opening Range (Initial Balance)
Option to display Higher Timeframe levels: Previous Day Open/Close and Previous Week Open/Close
All level lines and OR boxes size dynamically as the session progresses
Built in Alerts for when price hits key levels. e.g. Alert when price crosses the NY Opening Range High. Or an Alert when the first STDEV is hit.
Option to toggle display of drawings for Today's trading session only, or Show all recent session levels. This keeps the chart clean or not.
Extras:
The NY Opening Range also has a 50% level line
The NY Opening Bar can be highlighted separately
The Level Lines can have small labels turned on/off. Values are only shown on mouse over to keep a clean chart
Keep in mind:
1) This indicator works on all instruments, but on instruments with limited market hours, your chart setting
has to be set to "Extended Hours" otherwise. For example TSLA on NASDAQ.
2) The Exchange Time Zone for the CME Group is Chicago UTC-6. So the session times you configure in the settings menu are based on that timezone too.
3) Globex opens at 5pm CST and closes when the US session starts 8:30CST.
4) When enabling the Alerts in the Indicator settings, be sure to also create an alarm for this indicator using the Alarm function of Tradingview.

BTC Futures BasisShows various basis percentages in a table and plots historical basis. Also has an alert function for backwardation events. Useful for tracking bullish/bearish sentiment in BTC futures markets.
*Currently displays March and June futures for the following exchanges: Bitmex, Binance, Deribit, Okex, and FTX
Also displays CME Continuous Next Contract. All of the symbols are customizable.
-----------
Market-wide backwardation usually occurs during a heavy sell-off (such as a liquidation cascade).
**For getting alerts of backwardation events, I recommend creating an alert on the 1 minute chart with the condition "Any alert() function call". Alert level is customizable as well.
-----------
*NOTE!! : Futures contracts expire (obviously), so the contract symbols will need to be updated periodically. I will try to keep them updated going into the future.
**NOTE2!! : The alert() function does not track the CME contract. This is to avoid false triggers.

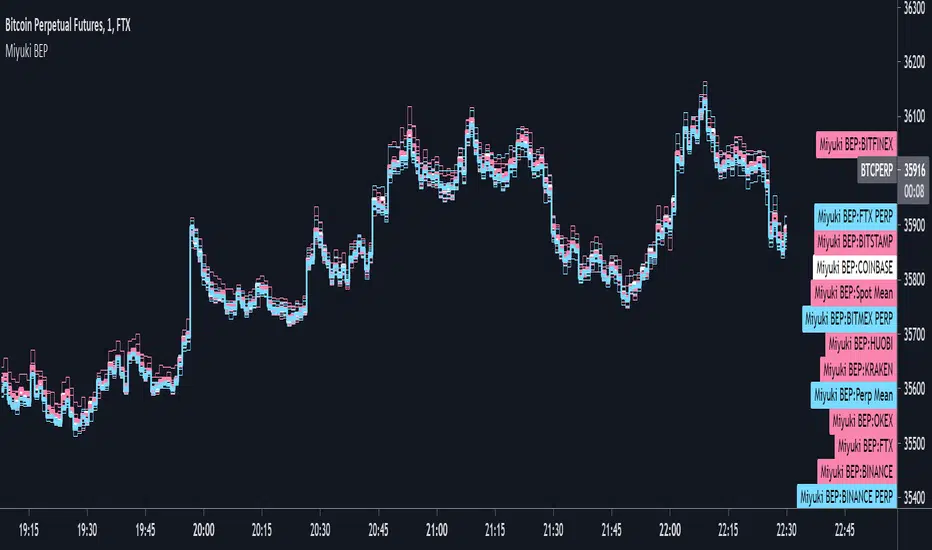
Miyuki BTC Exchange PremiumThis is a simple indicator to display the difference between different BTC exchanges on the chart. It works similarly to my BTC Spot Perp Delta indicator.
There are options to choose which spot and perp exchanges should be included in the mean calculations. It also includes the following options -
- COLOUR BY EXCHANGE: colour each exchange its own colour, or according to if its a spot or perp market
- PLOT EACH EXCHANGE: an option to plot every exchange
- PLOT MEANS: an option to plot the spot and perp means
- PLOT CME: an option to plot the CME price
I find its best used on the lowest timeframes. It can be a good way to visualise the spread between exchanges.
True Strength Indicator - WMAThis is the base Tradingview TSI indicator but with the WMA (weighted moving average) versus the base EMA. CME_MINI:ES1! CME_MINI:NQ1! CBOT_MINI:YM1! CME:E61!
AlgoYields - AAlgoYields A — Everyday Overlay for Clean, Actionable Context
Please follow — more indicators & ideas coming soon!
Equipped with alerts and customizable styles, this overlay is designed for daily use: attractive look for fast reads, low noise, high signal. It blends a few trusted tools into a single, elegant view so you can track trend, momentum, and breakouts without overcrowding.
What’s inside
Trading Session Backdrop
Quarter-tinted background (distinct color per quarter) for quick macro orientation; subtle week-to-week transparency shifts; CME pre-market, regular session, and post-market shading; weekends left clear.
Includes multiple curated color palettes. Ask if you want a custom theme.
EMA Cloud
A staircase of short EMAs for trend strength + two macro EMAs (defaults: 80 & 200). Macro EMAs auto-tint: blue when price is above, orange when below.
All lengths are user-configurable.
RSI-Derived Bar Colors
Contextual bar coloring by RSI level/zone to make strength/weakness instantly visible.
Comes with multiple palettes optimized for light/dark charts.
Price Channel & Breakouts
Select band source: Close (tight), HLC3 (medium), or High/Low (widest). Breakout dots print above/below bars and are color-coded by trend context:
Green : break below lower band in an uptrend (buy-the-dip candidates).
Yellow : break above upper band in an uptrend (potential exhaustion / quick scalp).
Orange : break below lower band in a downtrend (continuation shorts).
Red : break above upper band in a downtrend (fade-the-pop entries).
Buffer values can be tuned to reduce noise or enhance reactivity
How to use it
––––––––––
Bullish Breakdowns ( green dots) — often attractive dip-buys within uptrends.
Confirm with macro-EMA slope: steeper = stronger follow-through; flatting slope = take quicker profits and watch for potential rollover.
Bullish Breakouts ( yellow dots) — be selective. If RSI confirms strength, these can be solid for quick scalps; otherwise, beware “touch-and-fade” at the upper band.
Apply the same logic in reverse for shorts:
Bearish Breakouts ( red ) and Bearish Breakdowns ( orange ) favor short entries/continuations.
Inputs worth tweaking
EMA lengths (short stack + macro 80/200 defaults).
RSI bar-color palette (pick for light/dark themes).
Channel source (Close / HLC3 / High-Low) and breakout buffer.
Session/quarter palette selection.
Alerts
Choose from built-in signals (channel breaks, EMA crosses, significant RSI levels).
Notes & best practices
Backtest breakouts per asset/timeframe to tune buffers and TP/SL targets.
Use level + slope together: RSI/EMA levels flag conditions; slope confirms impulse/continuation.
Let the EMA cloud and macro EMAs set bias; use RSI bars and breakout dots for timing.

WaveRider [Scalping-Algo]# 📊 TrendPulse Pro - Indicator Guide
## 🎯 What is it?
A clean all-in-one trend tool. Combines 4 smoothed MAs, candlestick patterns & session highlights. No clutter, just signals.
---
## 🔧 Features
### 📈 4 Smoothed Moving Averages
- **21 SMMA** (Cyan) → Fast trend, scalping
- **50 SMMA** (Green) → Swing entries
- **100 SMMA** (Gold) → Medium trend filter
- **200 SMMA** (Red) → Major trend direction
💡 *Price above all = strong bull. Below all = strong bear.*
---
### ⚡ 3 Line Strike Pattern
Rare but powerful reversal signal.
- 🟢 **Bull 3LS** → 3 red candles + 1 big green that closes above first candle
- 🔴 **Bear 3LS** → 3 green candles + 1 big red that closes below first candle
💡 *Best near support/resistance zones.*
---
### 💎 Engulfing Candles
Shows momentum shift.
- 🟢 **Bull Engulf** → Green candle swallows previous red
- 🔴 **Bear Engulf** → Red candle swallows previous green
💡 *Filter with trend direction for better win rate.*
---
### 🕐 Session Highlight
See your trading window clearly.
- Light shade = Pre-session (prep time)
- Darker shade = Active session (go time)
💡 *Default is CME hours. Adjust in settings.*
---
## 📝 Quick Setup
1. Add to chart
2. Pick your timeframe (works on any)
3. Toggle what you need ON/OFF
4. Set your session times
5. Trade with confidence
---
## 🎨 Color Guide
| Element | Default Color | Meaning |
|---------|---------------|---------|
| 21 MA | Cyan | Fast trend |
| 50 MA | Green | Swing trend |
| 100 MA | Gold | Filter |
| 200 MA | Red | Big picture |
| Fill Green | Light Green | Bullish bias |
| Fill Red | Light Red | Bearish bias |
---
## ⚠️ Tips
✅ Use MA stack for trend bias
✅ Wait for patterns AT key levels
✅ Combine with volume
✅ Respect the 200 MA
❌ Don't trade against all MAs
❌ Don't chase every signal
❌ Don't ignore session times
---
## 🚀 Best Practices
**For Scalping:**
- Focus on 21 & 50 MA
- Trade engulfing patterns
- Use 1-5 min charts
**For Swing:**
- Focus on 100 & 200 MA
- Trade 3 Line Strike
- Use 1H-4H charts
---
Made with ☕ by a trader, for traders.
*"Keep it simple. Let price do the talking."*
