Enhanced Circle CandlestickEnhanced Circle Candlestick
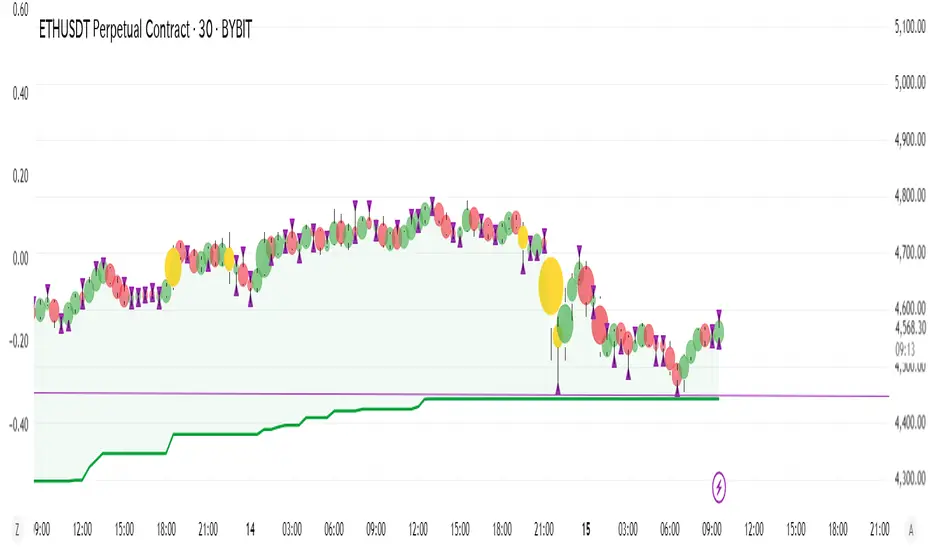
This script transforms standard candlesticks into circles, visualizing momentum, volume, and volatility in a unique way. The size and color of the circles change based on the body size of the candlestick, while a change in color signifies a volume spike. Long wicks are also highlighted, providing a quick visual cue for potential reversals or indecision.
Features
Circle Visualization: Replaces the standard candlestick body with a circle. The size of the circle is determined by the size of the candlestick body, making it easy to spot periods of high momentum.Gradient Color: The circle's opacity changes based on the body size. Smaller bodies have a lighter color, while larger, more powerful bodies have a darker, more vivid color. This visual gradient provides a clear indication of a bar's strength.Volume Spike Highlight: The circle's color will change to a bright yellow when the current volume exceeds the average volume by a user-defined factor, indicating a significant influx of buying or selling pressure.Long Wick Markers: The script draws a small triangle above or below the candlestick when a wick's length surpasses a user-defined percentage of the body's size. This helps identify potential exhaustion, rejection, or indecision in the market.
Settings
Bullish/Bearish Color: Customize the base colors for bullish (green) and bearish (red) circles.Volume Spike Color: Choose the color for the circle when a volume spike occurs.Volume Spike Factor: Set the multiplier for the volume spike detection. For example, a value of 2.0 means a volume spike is detected when the current volume is twice the 20-period moving average.Circle Opacity (0-100): Adjust the base transparency of the circles. Lower numbers result in more opaque (solid) colors.Opacity Factor: Controls how quickly the color gradient changes based on the body size. A higher value makes the color change more dramatic.Wick Length Factor (vs Body): Set the threshold for marking long wicks. A value of 0.8 means a wick is marked if its length is 80% or more of the candlestick body's size.
How to Use
Add this indicator to your chart.Open the Chart Settings.In the "Symbol" tab, set the transparency of the candlestick "Body" to 0%. (This step is essential because the indicator's settings will not be applied when the indicator is not selected, and the default platform settings take precedence.)
I do not speak English at all. Please understand that if you send me a message, I may not be able to reply, or my reply may have a different meaning. Thank you for your understanding.
ابحث في النصوص البرمجية عن "Candlestick"
Silver BulletSilver Bullet is a trading tool built for finding cleaner, higher-probability setups. It focuses on key windows of market movement and adds helpful tools like daily range levels and candlestick patterns.
Whether you’re trading breakouts or reversals, Silver Bullet gives you a clearer view of the market and more confidence in your setups.
⸻
🔹 Trading Setup #1: Macro Time
The Macro Time setting offers two modes: Macro Bullet and Silver Bullet. Both help traders focus on specific times when the market tends to deliver clean moves.
• Macro Bullet is based on the high and low of a full macro session. It automatically detects the session’s range and bias, then offers optimal entries for either Long or Short setups. Once the session resolves, it provides Fibonacci-based levels for entry, target, and stop loss.
• Silver Bullet is based on ICT concepts and focuses on the hourly range for London, NY AM, and NY PM sessions. It’s designed for quick time blocks and highlights key levels as the session unfolds.
To use this setup, set Macro Time to “ICT Sessions” and select your preferred mode under Bullet Mode.
⸻
🔹 Trading Setup #2: Daily Range
Enable Daily Range to draw Fibonacci levels based on either the previous day’s candle or the current day’s developing range. These levels help you identify potential support, resistance, and midpoint zones throughout the day.
With the current day’s range, levels automatically update in real time as new highs or lows form — keeping your chart aligned with evolving price action.
⸻
🔹 Trading Setup #3: Candlestick Patterns
Turn on Candlestick Patterns to automatically highlight clean reversal signals such as Hammers, Hanging Men, Shooting Stars, and Tweezers. Each pattern is detected using specific criteria and trend filters to reduce noise and improve reliability. They work especially well as confirmation signals around key levels or session zones.
Silver Bullet brings structure, clarity, and precision to your intraday trading. By combining time-based bias, price action levels, and pattern recognition, it helps you trade with purpose — not guesswork. Use one setup or combine all three for a complete view of the market, tailored to your style and session of choice.

Enhanced Buy/Sell Pressure, Volume, and Trend Bar analysisEnhanced Buy/Sell Pressure, Volume, and Trend Bar Analysis Indicator
Overview
This indicator is designed to help traders identify buy and sell pressure, volume changes, and overall trend direction in the market. It combines multiple concepts like price action, volume, and trend analysis, candlestick anaysis to provide a comprehensive view of market dynamics. The visual elements are intuitive, making it suitable for traders at different levels. This indicator works together with Enhanced Pressure MTF Screener which is a screener based of this indicator to make it easier to see Bullish/Bearish pressures and trend across multiple timeframes.
Image below: is the Enhanced Buy/Sell Pressure, Volume, and Trend Bar Analysis with the Enhanced Pressure MTF Screener indicator both active together.
Key Features
1.Buy/Sell Pressure Identification
Buy Pressure: Calculated based on price movement where the close price is higher than the opening price.
Sell Pressure: Calculated when the closing price is equal to or lower than the opening price.These pressures help you understand whether buyers or sellers are more dominant for each bar.
2.Volume Analysis
Normalized Volume: Volume data is normalized, making it easier to compare volume levels over different periods.
Volume Histogram: The volume is also presented as a histogram for easy visualization, showing whether the current volume is higher or lower compared to the average.
3.Simplified Coloring Option
You can choose to simplify the coloring of bars to reflect the dominant pressure: green for bullish pressure and red for bearish pressure. This makes it visually easier to identify who is in control. When simplified coloring is disabled, the bars' colors will represent the combined effect of buy and sell pressure.
4.Heikin-Ashi Candles for Pressure Calculation
The indicator includes an option to use Heikin-Ashi candles instead of traditional candles to calculate buy and sell pressure. Heikin-Ashi candles are known for smoothing out price action and providing a clearer trend representation.
5.Trend Background Coloring
This feature uses exponential moving averages (EMAs) to determine the trend:
Short-Term EMA vs. Long-Term EMA: When the short-term EMA is above the long-term EMA, the trend is considered bullish, and vice versa.
The background color changes based on the identified trend: green for an uptrend and red for a downtrend. This feature helps visualize the overall market direction at a glance.
6.Signals for Key Price Actions
The indicator plots various symbols to signal important price movements:
Bullish Close (▲): Indicates a strong upward movement where the close price crosses above the open.
Bearish Close (▼): Indicates a downward movement where the close price falls below the open.
Higher High (•): Highlights new highs compared to previous bars, useful for confirming an uptrend.
Lower Low (•): Highlights lower lows compared to previous bars, which can indicate a downtrend or bearish pressure.
Calculations Explained
1.Buy and Sell Pressure Calculation
The buy pressure is determined by the price range (high - low) if the closing price is above the opening price, indicating an increase in value.
The sell pressure is similarly calculated when the closing price is equal to or below the opening price.
The indicator uses the Average True Range (ATR) for normalization. Normalizing helps you compare pressure across different periods, regardless of market volatility.
2.Volume Normalization
Volume Normalization: To make volume comparable across different periods, the indicator normalizes it using the Simple Moving Average (SMA) of volume over a user-defined length.
Volume Histogram: The histogram provides a clear representation of volume changes compared to the average, making it easier to spot unusual activity that may indicate market shifts.
3.Combined Pressure Calculation
The indicator calculates a combined pressure value by subtracting sell pressure from buy pressure.
When combined pressure is positive, buying is dominant, and when negative, selling is dominant. This helps in visually understanding the ongoing momentum.
4.Trend Calculation
The indicator uses two EMAs to determine the trend:
Short-Term EMA (default 14-period) to capture recent price movements.
Long-Term EMA (default 50-period) to provide a broader trend perspective.
By comparing these EMAs on a higher timeframe, the indicator can identify whether the trend is up or down, making it easier for traders to align their trades with the larger market movement.
Inputs and Customization
The indicator provides several options for customization, allowing you to adjust it to your preferences:
SMA Length: Determines the lookback period for moving averages and volume normalization. A longer length provides more smoothing, whereas a shorter length makes the indicator more responsive.
Buy/Sell/Volume Colors: Customize the colors used to represent buying, selling, and volume to suit your preferences.
Heikin Ashi Option: Toggle between using Heikin Ashi or traditional OHLC (Open-High-Low-Close) candles for pressure calculations.
Trend Timeframe and EMA Periods: You can choose different timeframes and EMA periods for trend analysis to suit your trading strategy.
How to Use This Indicator
Identifying Market Momentum: Use the buy/sell pressure columns to see which side (buyers or sellers) is in control. Positive pressure combined with green color indicates strong buying, while red indicates selling.
Volume Confirmation: Check the volume area plot and histogram. High volume coupled with strong pressure is a sign of conviction, meaning the current move has backing from market participants.
Trend Identification: The trend background color helps identify the overall trend direction. Trade in the direction of the trend (e.g., take long positions during a green background).
Signal Indicators: The plotted symbols like "Bullish Close" and "Bearish Close" provide visual signals of key price actions, useful for timing entry or exit points.
Practical use Example
Scenario: The market is consolidating, and you see alternating green and red bars.
Action: Wait for a consistent sequence of green bars (buy pressure) along with a green background (uptrend) to consider going long, although you can go long without having a green background, the background adds confirmation layer.
Scenario: The market has several bearish closes (red ▼ symbols) accompanied by increasing volume.
Action: This could indicate strong selling pressure. If the background also turns red, it might be a good time to exit long positions or consider shorting.
Higher timeframe pressure and volume: Another way to use the indicator is to check buy/sell volume and pressure of the higher timeframe say weekly or daily or any timeframe you consider higher, once you’ve identified or feel confident in which direction the bar is going along with the full picture of trend, you can go to the lower timeframe and wait for it to sync with the higher timeframe to consider a long or a short. It is also easier to see when markets sync up by also applying the Enhanced Pressure MTF Screener which works in companion to this indicator.
Visual Cues and Interpretation
Combined Pressure Plot: The green and red column plot at the bottom of the chart represents the dominance between buying and selling. Tall green bars signify strong buying, while tall red bars indicate selling dominance.
Trend Background: Helps visualize the overall direction without manually drawing trend lines. When the background turns green, it generally indicates that the shorter-term moving average has crossed above the longer-term average—a sign of a bullish trend.
To Summarize shortly
The Enhanced Buy/Sell Pressure, Volume, and Trend Bar Analysis Indicator is an advanced but simple tool designed to help traders visually understand market dynamics. It combines different aspects of market analysis of candle pressure from buyers and sellers, volume confirmation, and trend identification into a single view, which can assist both new and experienced traders in making informed trading decisions.
This indicator:
Saves time by simplifying market analysis.
Provides clear visual cues for buy/sell pressure, volume, and trend.
Offers customizable settings to suit individual trading styles.
Always, I am happy to share my creations with you all for free. If you guys have cool ideas you would like to share, or suggestions for improvements the comment is below and I hope this overview gave an idea of how to use the indicator :D

Judas Swing ICT 01 [TradingFinder] New York Midnight Opening M15🔵 Introduction
The Judas Swing (ICT Judas Swing) is a trading strategy developed by Michael Huddleston, also known as Inner Circle Trader (ICT). This strategy allows traders to identify fake market moves designed by smart money to deceive retail traders.
By concentrating on market structure, price action patterns, and liquidity flows, traders can align their trades with institutional movements and avoid common pitfalls. It is particularly useful in FOREX and stock markets, helping traders identify optimal entry and exit points while minimizing risks from false breakouts.
In today's volatile markets, understanding how smart money manipulates price action across sessions such as Asia, London, and New York is essential for success. The ICT Judas Swing strategy helps traders avoid common pitfalls by focusing on key movements during the opening time and range of each session, identifying breakouts and false breakouts.
By utilizing various time frames and improving risk management, this strategy enables traders to make more informed decisions and take advantage of significant market movements.
In the Judas Swing strategy, for a bullish setup, the price first touches the high of the 15-minute range of New York midnight and then the low. After that, the price returns upward, breaks the high, and if there’s a candlestick confirmation during the pullback, a buy signal is generated.
bearish setup, the price first touches the low of the range, then the high. With the price returning downward and breaking the low, if there’s a candlestick confirmation during the pullback to the low, a sell signal is generated.
🔵 How to Use
To effectively implement the Judas Swing strategy (ICT Judas Swing) in trading, traders must first identify the price range of the 15-minute window following New York midnight. This range, consisting of highs and lows, sets the stage for the upcoming movements in the London and New York sessions.
🟣 Bullish Setup
For a bullish setup, the price first moves to touch the high of the range, then the low, before returning upward to break the high. Following this, a pullback occurs, and if a valid candlestick confirmation (such as a reversal pattern) is observed, a buy signal is generated. This confirmation could indicate the presence of smart money supporting the bullish movement.
🟣 Bearish Setup
For a bearish setup, the process is the reverse. The price first touches the low of the range, then the high. Afterward, the price moves downward again and breaks the low. A pullback follows to the broken low, and if a bearish candlestick confirmation is seen, a sell signal is generated. This confirmation signals the continuation of the downward price movement.
Using the Judas Swing strategy enables traders to avoid fake breakouts and focus on strong market confirmations. The strategy is versatile, applying to FOREX, stocks, and other financial instruments, offering optimal trading opportunities through market structure analysis and time frame synchronization.
To execute this strategy successfully, traders must combine it with effective risk management techniques such as setting appropriate stop losses and employing optimal risk-to-reward ratios. While the Judas Swing is a powerful tool for predicting price movements, traders should remember that no strategy is entirely risk-free. Proper capital management remains a critical element of long-term success.
By mastering the ICT Judas Swing strategy, traders can better identify entry and exit points and avoid common traps from fake market movements, ultimately improving their trading performance.
🔵 Setting
Opening Range : High and Low identification time range.
Extend : The time span of the dashed line.
Permit : Signal emission time range.
🔵 Conclusion
The Judas Swing strategy (ICT Judas Swing) is a powerful tool in technical analysis that helps traders identify fake moves and align their trades with institutional actions, reducing risk and enhancing their ability to capitalize on market opportunities.
By leveraging key levels such as range highs and lows, fake breakouts, and candlestick confirmations, traders can enter trades with more precision. This strategy is applicable in forex, stocks, and other financial markets and, with proper risk management, can lead to consistent trading success.

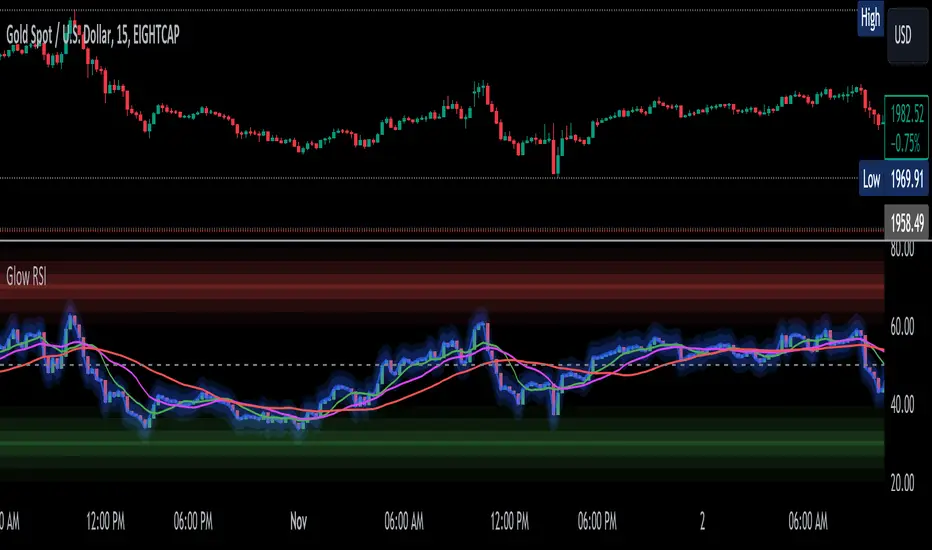
Glowing RSI Candlesticks (With Buy and Sell helpers)This is not your average, boring RSI indicator.
This indicator is still an RSI (momentum) indicator, but I have converted the line into candlesticks.
It has an option to make it glow neon blue to make it look cooler (dark background recommended for full effect).
There is a red zone at 70, because of course, and a green zone at 30 for the same reason.
On top of that, it has triple moving averages, two of which it uses to create some simple buy and sell indications (the vertical green and red lines).
Enjoy! :)
RSI CANDLESTICKSThis indicator display open, high, low, and close data in the form of a candlestick.
Credits to @allanster for the idea from

Dynamic Range Filter with Trend Candlesticks (Zeiierman)█ Overview
Dynamic Range Filter with Trend Candlesticks (Zeiierman) is a volatility-responsive trend engine that adapts in real-time to market structure, offering a clean and intelligent visualization of directional bias. It blends dynamic range calculation with customizable smoothing techniques and layered trend confirmation logic, making it ideal for traders who rely on clear trend direction, structural range analysis, and momentum-based candlestick signals.
By measuring scaled volatility over configurable lengths and applying advanced moving average techniques, this indicator filters out market noise while preserving true directional intent. Complementing this, a dual-trend system (range-based and candle-based) enhances clarity and responsiveness, particularly during shifting market conditions.
█ How It Works
⚪ Scaled Volatility Band Calculation
At the core lies a volatility engine that constructs adaptive range bands around price using smoothed high/low calculations. The bands are dynamically adjusted using:
High/Low Smoothing – Applies a moving average to the raw high and low data before calculating the range.
Scaled Range Volatility – A 2.618 multiplier scales the distance between smoothed highs and lows, forming a responsive volatility envelope.
Band Multiplier – Controls how wide the upper/lower range bands extend from the mean.
This filtering process minimizes false signals and highlights only structurally meaningful moves.
⚪ Multi-Type Smoothing Engine
Users can choose from a wide array of smoothing algorithms for trend construction, including:
HMA (default), SMA, EMA, RMA
KAMA – Adapts to market volatility using efficiency ratios.
VIDYA – Momentum-sensitive smoothing using CMO logic.
FRAMA – Dynamically adjusts to fractal dimension in price.
Super Smoother – Ideal for eliminating aliasing in range signals.
This provides the trader with fine-tuned control over reactivity vs. smoothness.
⚪ Trend Detection (Dual Engine)
The indicator includes two independent trend tracking systems:
Main Trend Filter – Based on adaptive volatility band shifts.
Candle Trend Filter – A second-tier confirmation using smoothed candle data, ideal for directional candles and confirmation entries.
█ How to Use
⚪ Trend Confirmation
Use the Trend Line and colored candlesticks for high-probability entries in the trend direction. The more trend layers that align, the higher the confidence.
⚪ Reversal Zones
When the price reaches the outer bands or fails to break them, look for candle color shifts or a crossover in the range to anticipate possible reversals or consolidations.
█ Settings
Scaled Volatility Length – Controls the lookback used to stabilize the base volatility band.
MA Type & Length – Choose and fine-tune the smoothing method (HMA, EMA, KAMA, etc.)
High/Low Smoother – Pre-smoothing for structural high/low banding.
Band Multiplier – Adjusts the width of the dynamic bands.
Trend Length (Candles) – Length used for candle-based trend confirmation.
-----------------
Disclaimer
The content provided in my scripts, indicators, ideas, algorithms, and systems is for educational and informational purposes only. It does not constitute financial advice, investment recommendations, or a solicitation to buy or sell any financial instruments. I will not accept liability for any loss or damage, including without limitation any loss of profit, which may arise directly or indirectly from the use of or reliance on such information.
All investments involve risk, and the past performance of a security, industry, sector, market, financial product, trading strategy, backtest, or individual's trading does not guarantee future results or returns. Investors are fully responsible for any investment decisions they make. Such decisions should be based solely on an evaluation of their financial circumstances, investment objectives, risk tolerance, and liquidity needs.

Enhanced SPX and BTC Overlay with EMASPX-BTC Momentum Gauge and EMA Cross Indicator
Thorough Analysis:
• Combined Overlay (Green/Red Line):
o Function: Plots a wide line over the price chart, representing a composite of SPX and BTC dynamics adjusted by volume data.
o Color Coding:
Green: Indicates bullish conditions when the combined value exceeds its 10-period SMA and Bitcoin volume increases.
Red: Signals bearish conditions when the combined value drops below its 10-period SMA and Bitcoin volume decreases.
o Line Characteristics:
Width: Set at 8 for high visibility.
Transparency: 86% for both colors to overlay without obscuring candlesticks.
Scaling: Uses a factor of 0.02446 to amplify movements, making trend changes more noticeable.
• Continuous Bright Red and Green Lines:
o 20-period EMA of Current Ticker (Red):
Purpose: Acts as a medium-term trend indicator, smoothing price data to reflect the asset's general direction over time.
Color: Bright red for easy identification.
Transparency: 60% to keep it visible but not overpowering.
o 5-period EMA of BTC (Green):
Purpose: Provides insights into short-term Bitcoin momentum, capturing rapid changes in market sentiment.
Color: Bright green to distinguish from the red EMA.
Transparency: 30% for high visibility against price movements.
Detailed Analysis of the EMA Cross:
• Crossing Points:
o Bullish Crossover:
Occurs when the 5-period BTC EMA (green) moves above the 20-period EMA of the current ticker (red).
Suggests that Bitcoin's short-term momentum is gaining strength relative to the asset's medium-term trend, potentially signaling an upcoming uptrend or strengthening of an existing one.
o Bearish Crossover:
When the green line falls below the red, it indicates that Bitcoin's immediate momentum is weakening compared to the asset's medium-term trend, which might precede a downtrend or confirm one.
• Early Trade Signals:
o Entry/Exit Points:
These crossovers can guide traders in making timely decisions to enter or exit trades, especially when corroborated by the combined overlay's color.
o Confirmation:
EMA crossovers can confirm trends indicated by the combined overlay. For example, a bullish crossover with a green combined line could validate a buying opportunity.
o Volatility Insights:
The rapid shifts in Bitcoin's 5-period EMA highlight potential volatility spikes, offering an additional layer of market analysis, particularly useful in volatile markets.
• Strategic Use:
o Multi-Market Insight: The script integrates data from both traditional (SPX) and crypto (BTC) markets, allowing for a more comprehensive analysis of market conditions.
o Decision-Making: Provides traders with visual cues for market sentiment, trend direction, and potential reversals, enhancing strategic trading decisions.
o Trend Confirmation: The combination of EMA crossovers and the overlay's color changes offers a multi-faceted approach to trend confirmation or divergence.
In Summary:
• This script merges elements of traditional stock market analysis with cryptocurrency dynamics, utilizing color changes, line thickness, and EMA crossovers to visually communicate market conditions, offering traders a robust tool for analyzing and acting on market movements.

Forex Hammer and Hanging Man StrategyThe strategy is based on two key candlestick chart patterns: Hammer and Hanging Man. These chart patterns are widely used in technical analysis to identify potential reversal points in the market. Their relevance in the Forex market, known for its high liquidity and volatile price movements, is particularly pronounced. Both patterns provide insights into market sentiment and trader psychology, which are critical in currency trading, where short-term volatility plays a significant role.
1. Hammer:
• Typically occurs after a downtrend.
• Signals a potential trend reversal to the upside.
• A Hammer has:
• A small body (close and open are close to each other).
• A long lower shadow, at least twice as long as the body.
• No or a very short upper shadow.
2. Hanging Man:
• Typically occurs after an uptrend.
• Signals a potential reversal to the downside.
• A Hanging Man has:
• A small body, similar to the Hammer.
• A long lower shadow, at least twice as long as the body.
• A small or no upper shadow.
These patterns are a manifestation of market psychology, specifically the tug-of-war between buyers and sellers. The Hammer reflects a situation where sellers tried to push the price down but were overpowered by buyers, while the Hanging Man shows that buyers failed to maintain the upward movement, and sellers could take control.
Relevance of Chart Patterns in Forex
In the Forex market, chart patterns are vital tools because they offer insights into price action and market sentiment. Since Forex trading often involves large volumes of trades, chart patterns like the Hammer and Hanging Man are important for recognizing potential shifts in market momentum. These patterns are a part of technical analysis, which aims to forecast future price movements based on historical data, relying on the psychology of market participants.
Scientific Literature on the Relevance of Candlestick Patterns
1. Behavioral Finance and Candlestick Patterns:
Research on behavioral finance supports the idea that candlestick patterns, such as the Hammer and Hanging Man, are relevant because they reflect shifts in trader psychology and sentiment. According to Lo, Mamaysky, and Wang (2000), patterns like these could be seen as representations of collective investor behavior, influenced by overreaction, optimism, or pessimism, and can often signal reversals in market trends.
2. Statistical Validation of Chart Patterns:
Studies by Brock, Lakonishok, and LeBaron (1992) explored the profitability of technical analysis strategies, including candlestick patterns, and found evidence that certain patterns, such as the Hammer, can have predictive value in financial markets. While their study primarily focused on stock markets, their findings are generally applicable to the Forex market as well.
3. Market Efficiency and Candlestick Patterns:
The efficient market hypothesis (EMH) posits that all available information is reflected in asset prices, but some studies suggest that markets may not always be perfectly efficient, allowing for profitable exploitation of certain chart patterns. For instance, Jegadeesh and Titman (1993) found that momentum strategies, which often rely on price patterns and trends, could generate significant returns, suggesting that patterns like the Hammer or Hanging Man may provide a slight edge, particularly in short-term Forex trading.
Testing the Strategy in Forex Using the Provided Script
The provided script allows traders to test and evaluate the Hammer and Hanging Man patterns in Forex trading by entering positions when these patterns appear and holding the position for a specified number of periods. This strategy can be tested to assess its performance across different currency pairs and timeframes.
1. Testing on Different Timeframes:
• The effectiveness of candlestick patterns can vary across different timeframes, as market dynamics change with the level of detail in each timeframe. Shorter timeframes may provide more frequent signals, but with higher noise, while longer timeframes may produce more reliable signals, but with fewer opportunities. This multi-timeframe analysis could be an area to explore to enhance the strategy’s robustness.
2. Exit Strategies:
• The script incorporates an exit strategy where positions are closed after holding them for a specified number of periods. This is useful for testing how long the reversal patterns typically take to play out and when the optimal exit occurs for maximum profitability. It can also help to adjust the exit logic based on real-time market behavior.
Conclusion
The Hammer and Hanging Man patterns are widely recognized in technical analysis as potential reversal signals, and their application in Forex trading is valuable due to the market’s high volatility and liquidity. This strategy leverages these candlestick patterns to enter and exit trades based on shifts in market sentiment and psychology. Testing and optimization, as offered by the script, can help refine the strategy and improve its effectiveness.
For further refinement, it could be valuable to consider combining candlestick patterns with other technical indicators or using multi-timeframe analysis to confirm patterns and increase the probability of successful trades.
References:
• Lo, A. W., Mamaysky, H., & Wang, J. (2000). Foundations of Technical Analysis: Computational Algorithms, Statistical Inference, and Empirical Implementation. The Journal of Finance, 55(4), 1705-1770.
• Brock, W., Lakonishok, J., & LeBaron, B. (1992). Simple Technical Trading Rules and the Stochastic Properties of Stock Returns. The Journal of Finance, 47(5), 1731-1764.
• Jegadeesh, N., & Titman, S. (1993). Returns to Buying Winners and Selling Losers: Implications for Stock Market Efficiency. The Journal of Finance, 48(1), 65-91.
This provides a theoretical basis for the use of candlestick patterns in trading, supported by academic literature and research on market psychology and efficiency.

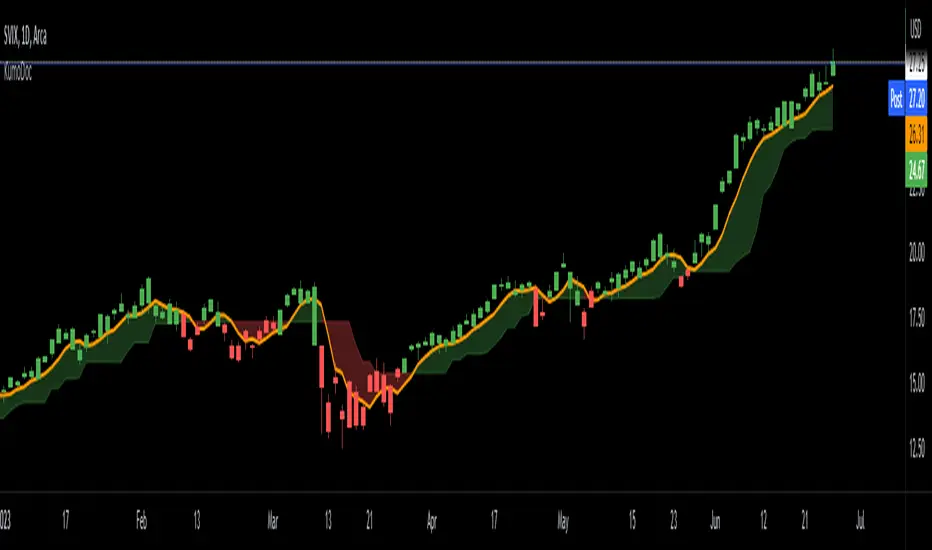
IKH Cloud V1.0 (nextSignals)The IKH Cloud V1.0 (nextSignals) is an Ichomoku-type indicator that can be used for various trading strategies. It's based on a ThinkScript study from @stephenharlinmd (aka nextSignals) that uses an instantaneous moving average as the base MA, and a custom trailing stop. Both of these components form the cloud.
Indicator Components and Calculation
The indicator comprises two key components:
Instantaneous Moving Average (IMA) : This is a type of moving average that places a greater weight on the most recent data points, and is based on Ehler's book "Rocket Science for Traders". This is slightly different from the Doc's original, but is very approximate.
Trailing Stop : This component helps determine the stop loss level that moves along with the price. The trailing stop is based on the highest high and the lowest low of the last 5 bars, as well as the simple moving averages of the low and high of the previous bar. The trailing stop is calculated separately for each condition: when the bar index is greater than 1 and when the previous 'a' variable is either 1 or 0.
These two components are used to create a filled area on the chart, also known as the 'cloud'. The color of the cloud and the candlesticks change based on the relative positions of the IMA and the trailing stop.
How to Use the Indicator
The following are just ideas on how to use this indicator, and is not financial advice in any form:
Trend Identification: When the IMA is above the trailing stop (cloud), it indicates an uptrend, and when it's below, it indicates a downtrend.
Entry/Exit Signals: Traders can consider going long when the candlesticks move above the cloud and short when they move below the cloud.
Stop Loss Level: The trailing stop line (the cloud's edge) can serve as a dynamic stop loss level.
Please don't use just this indicator on its own. Please use this in conjunction with other analysis tools, indicators, and systems you already have in place. Always consider the overall market context and use appropriate risk management strategies.
Volume Shaded CandlesDescription:
The Volume Shaded Candles indicator (VSC) is a technical analysis tool designed to represent price candles on a chart with transparency based on the volume traded during each candle. This overlay indicator enhances visual analysis by providing a visual representation of volume intensity.
How it Works:
The VSC indicator calculates the volume-to-transparency ratio by dividing the current volume by the highest volume within the last 10 periods. The ratio is then used to determine the shading intensity of the price candles. Higher volume relative to the recent highest volume results in lower transparency, while lower volume results in higher transparency.
Usage:
To effectively utilize the Volume Shaded Candles indicator, follow these steps:
1. Apply the Volume Shaded Candles indicator to your chart by adding it from the available indicators.
2. Configure the indicator's inputs:
- Specify the color for bullish candles using the "Bullish Color" input.
- Specify the color for bearish candles using the "Bearish Color" input.
3. Observe the shaded candles on the chart:
- Bullish candles are colored with the specified bullish color and shaded according to the volume intensity.
- Bearish candles are colored with the specified bearish color and shaded according to the volume intensity.
4. Interpret the shaded candles:
- Darker shading indicates higher volume during the corresponding candle.
- Lighter shading indicates lower volume during the corresponding candle.
5. Combine the analysis of shaded candles with other technical analysis tools, such as trend lines, support and resistance levels, or candlestick patterns, to identify potential trade setups.
6. Implement appropriate risk management strategies, including setting stop-loss orders and position sizing, to manage your trades effectively and protect your capital.
Price Action [Morty]This price action indicator uses the higher timeframe SSL channel to identify trends.
The long entry signal is a bullish candlestick pattern when the price retraces to EMA20 in an uptrend.
The short entry signal is a bearish candlestick pattern when the price retraces to the EMA20 in a downrend.
Currently, this indicator shows engulfing patterns, pin bar patterns, 2 bar reversal patterns and harami patterns.
It also shows a volatility squeeze signal when the Bollinger bands is within the Kelter channels.
The buy and sell signal can also be filter by the ADX indicator greater than a threshold.
You can set your stoploss to the previous low/high when you go long/short.
The risk/reward ratio could be 1 to 1.5.
This indicator can be used in any market.

Cycle-Synced Channel Breakout📌 Cycle-Synced Channel Breakout – Detect Breakouts Confirmed by Candles and Momentum Cycles
📖 Overview
The Cycle-Synced Channel Breakout indicator is a precision breakout detection tool that combines the power of:
• Adaptive Keltner Channels
• Dominant Cycle Period Analysis (Ehlers-inspired)
• Candlestick Pattern Recognition (Engulfing)
This multi-layered approach helps identify true breakout opportunities by filtering out noise and false signals, making it ideal for swing traders and intraday traders seeking high-probability directional moves.
⚙️ How It Works
1. Keltner Channel Envelope
A dynamic volatility channel based on the EMA and ATR defines the upper and lower bounds of price movement.
2. Engulfing Candle Detection
The script detects strong bullish and bearish engulfing patterns, which often signal trend reversals or momentum continuations.
3. Dominant Cycle Momentum (Ehlers-inspired)
Using a smoothed power oscillator derived from a detrended price series, the indicator assesses whether momentum is accelerating during the breakout — filtering out weak moves.
4. Signal Confirmation Logic
A signal is only shown when:
• An engulfing pattern is detected, and
• Price breaks out of the Keltner Channel, and
• Momentum (cycle power) is rising
5. Visual Feedback
• Breakout signals are plotted with “BUY” or “SELL” labels
• Faded green/red background highlights confirmed breakouts
• Optional display of engulfing candles with triangle markers
⸻
🛠️ Key Features
• ✅ Adaptive Keltner Channels
• ✅ Bullish/Bearish Engulfing Candle Recognition
• ✅ Ehlers-style Cycle Momentum Confirmation
• ✅ Background highlights for confirmed breakouts
• ✅ Optional candle pattern visualization
• ✅ Lightweight and Pine v6 compatible
⸻
🧪 Inputs
• Keltner Length – EMA period for channel basis
• Multiplier – Multiplied with ATR to determine band width
• Cycle Lookback – Used to calculate smoothed cycle power
• Show Engulfing Candles? – Toggles candlestick signals
• Show Breakout Signals? – Toggles breakout labels and backgrounds
⸻
🧠 How to Use
• Look for “BUY” or “SELL” labels when:
• An engulfing candle breaks through the Keltner Channel
• Cycle momentum confirms strength behind the move
• The background color will faintly highlight the breakout direction.
• Use in combination with other trend or volume indicators for added confluence.
🔒 Notes
• This indicator is not repainting.
• It is designed for educational and research purposes only.
• Works across all timeframes and asset classes (stocks, crypto, forex, etc.)

Easy MA SignalsEasy MA Signals
Overview
Easy MA Signals is a versatile Pine Script indicator designed to help traders visualize moving average (MA) trends, generate buy/sell signals based on crossovers or custom price levels, and enhance chart analysis with volume-based candlestick coloring. Built with flexibility in mind, it supports multiple MA types, crossover options, and customizable signal appearances, making it suitable for traders of all levels. Whether you're a day trader, swing trader, or long-term investor, this indicator provides actionable insights while keeping your charts clean and intuitive.
Configure the Settings
The indicator is divided into three input groups for ease of use:
General Settings:
Candlestick Color Scheme: Choose from 10 volume-based color schemes (e.g., Sapphire Pulse, Emerald Spark) to highlight high/low volume candles. Select “None” for TradingView’s default colors.
Moving Average Length: Set the MA period (default: 20). Adjust for faster (lower values) or slower (higher values) signals.
Moving Average Type: Choose between SMA, EMA, or WMA (default: EMA).
Show Buy/Sell Signals: Enable/disable signal plotting (default: enabled).
Moving Average Crossover: Select a crossover type (e.g., MA vs VWAP, MA vs SMA50) for signals or “None” to disable.
Volume Influence: Adjust how volume impacts candlestick colors (default: 1.2). Higher values make thresholds stricter.
Signal Appearance Settings:
Buy/Sell Signal Shape: Choose shapes like triangles, arrows, or labels for signals.
Buy/Sell Signal Position: Place signals above or below bars.
Buy/Sell Signal Color: Customize colors for better visibility (default: green for buy, red for sell).
Custom Price Alerts:
Custom Buy/Sell Alert Price: Set specific price levels for alerts (default: 0, disabled). Enter a non-zero value to enable.
Set Up Alerts
To receive notifications (e.g., sound, popup, email) when signals or custom price levels are hit:
Click the Alert button (alarm clock icon) in TradingView.
Select Easy MA Signals as the condition and choose one of the four alert types:
MA Crossover Buy Alert: Triggers on MA crossover buy signals.
MA Crossover Sell Alert: Triggers on MA crossover sell signals.
Custom Buy Alert: Triggers when price crosses above the custom buy price.
Custom Sell Alert: Triggers when price crosses below the custom sell price.
Enable Play Sound and select a sound (e.g., “Bell”).
Set the frequency (e.g., Once Per Bar Close for confirmed signals) and create the alert.
Analyze the Chart
Moving Average Line: Displays the selected MA with color changes (green for bullish, red for bearish, gray for neutral) based on price position relative to the MA.
Buy/Sell Signals: Appear as shapes or labels when crossovers or custom price levels are hit.
Candlestick Colors: If a color scheme is selected, candles change color based on volume strength (high, low, or neutral), aiding in trend confirmation.
Why Use Easy MA Signals?
Easy MA Signals is designed to simplify technical analysis while offering advanced customization. It’s ideal for traders who want:
A clear visualization of MA trends and crossovers.
Flexible signal generation based on MA crossovers or custom price levels.
Volume-enhanced candlestick coloring to identify market strength.
Easy-to-use settings with tooltips for beginners and pros alike.
This script is particularly valuable because it combines multiple features into one indicator, reducing chart clutter and providing actionable insights without overwhelming the user.
Benefits of Easy MA Signals
Highly Customizable: Supports SMA, EMA, and WMA with adjustable lengths.
Offers multiple crossover options (VWAP, SMA10, SMA20, etc.) for tailored strategies.
Custom price alerts allow precise targeting of key levels.
Volume-Based Candlestick Coloring: 10 unique color schemes highlight volume strength, helping traders confirm trends.
Adjustable volume influence ensures adaptability to different markets.
Flexible Signal Visualization: Choose from various signal shapes (triangles, arrows, labels) and positions (above/below bars).
Customizable colors improve visibility on any chart background.
Alert Integration: Built-in alert conditions for crossovers and custom prices support sound, email, and app notifications.
Easy setup for real-time trading decisions.
User-Friendly Design: Organized input groups with clear tooltips make configuration intuitive.
Suitable for beginners and advanced traders alike.
Example Use Cases
Swing Trading with MA Crossovers:
Scenario: A trader wants to trade Bitcoin (BTC/USD) on a 4-hour chart using an EMA crossover strategy.
Setup:
Set Moving Average Type to EMA, Length to 20.
Set Moving Average Crossover to “MA vs SMA50”.
Enable Show Buy/Sell Signals and choose “arrowup” for buy, “arrowdown” for sell.
Select “Emerald Spark” for candlestick colors to highlight volume surges.
Usage: Buy when the EMA20 crosses above the SMA50 (green arrow appears) and volume is high (dark green candles). Sell when the EMA20 crosses below the SMA50 (red arrow). Set alerts for real-time notifications.
Scalping with Custom Price Alerts:
Scenario: A day trader monitors Tesla (TSLA) on a 5-minute chart and wants alerts at specific support/resistance levels.
Setup:
Set Custom Buy Alert Price to 150.00 (support) and Custom Sell Alert Price to 160.00 (resistance).
Use “labelup” for buy signals and “labeldown” for sell signals.
Keep Moving Average Crossover as “None” to focus on price alerts.
Usage: Receive a sound alert and label when TSLA crosses 150.00 (buy) or 160.00 (sell). Use volume-colored candles to confirm momentum before entering trades.
When NOT to Use Easy MA Signals
High-Frequency Trading: Reason: The indicator relies on moving averages and volume, which may lag in ultra-fast markets (e.g., sub-second trades). High-frequency traders may need specialized tools with real-time tick data.
Alternative: Use order book or market depth indicators for faster execution.
Low-Volatility or Sideways Markets:
Reason: MA crossovers and custom price alerts can generate false signals in choppy, range-bound markets, leading to whipsaws.
Alternative: Use oscillators like RSI or Bollinger Bands to trade within ranges.
This indicator is tailored more towards less experienced traders. And as always, paper trade until you are comfortable with how this works if you're unfamiliar with trading! We hope you enjoy this and have great success. Thanks for your interested in Easy MA Signals!

Candle Emotion Index (CEI) StrategyThe Candle Emotion Index (CEI) Strategy is an innovative sentiment-based trading approach designed to help traders identify and capitalize on market psychology. By analyzing candlestick patterns and combining them into a unified metric, the CEI Strategy provides clear entry and exit signals while dynamically managing risk. This strategy is ideal for traders looking to leverage market sentiment to identify high-probability trading opportunities.
How It Works
The CEI Strategy is built around three core oscillators that reflect key emotional states in the market:
Indecision Oscillator . Measures market uncertainty using patterns like Doji and Spinning Tops. High values indicate hesitation, signaling potential turning points.
Fear Oscillator . Tracks bearish sentiment through patterns like Shooting Star, Hanging Man, and Bearish Engulfing. Helps identify moments of intense selling pressure.
Greed Oscillator . Detects bullish sentiment using patterns like Marubozu, Hammer, Bullish Engulfing, and Three White Soldiers. Highlights periods of strong buying interest.
These oscillators are averaged into the Candle Emotion Index (CEI):
CEI = (Indecision + Fear + Greed) / 3
This single value quantifies overall market sentiment and drives the strategy’s trading decisions.
Key Features
Sentiment-Based Trading Signals . Long Entry: Triggered when the CEI crosses above a lower threshold (e.g., 0.1), indicating increasing bullish sentiment. Short Entry: Triggered when the CEI crosses above a higher threshold (e.g., 0.2), signaling rising bearish sentiment.
Volume Confirmation . Trades are validated only if volume exceeds a user-defined multiplier of the average volume over the lookback period. This ensures entries are backed by significant market activity.
Break-Even Recovery Mechanism . If a trade moves into a loss, the strategy attempts to recover to break-even instead of immediately exiting at a loss. This feature provides flexibility, allowing the market to recover while maintaining disciplined risk management.
Dynamic Risk Management . Maximum Holding Period: Trades are closed after a user-defined number of candles to avoid overexposure to prolonged uncertainty. Profit-Taking Conditions: Positions are exited when favorable price moves are confirmed by increased volume, locking in gains. Loss Threshold: Trades are exited early if the price moves unfavorably beyond a set percentage of the entry price, limiting potential losses.
Cooldown Period . After a trade is closed, a cooldown period prevents immediate re-entry, reducing overtrading and improving signal quality.
Why Use This Strategy?
The CEI Strategy combines advanced sentiment analysis with robust trade management, making it a powerful tool for traders seeking to understand market psychology and identify high-probability setups. Its unique features, such as the break-even recovery mechanism and volume confirmation, add an extra layer of discipline and reliability to trading decisions.
Best Practices
Combine with Other Indicators . Use trend-following tools (e.g., moving averages, ADX) and momentum oscillators (e.g., RSI, MACD) to confirm signals.
Align with Key Levels . Incorporate support and resistance levels for refined entries and exits.
Multi-Market Compatibility . Apply this strategy to forex, crypto, stocks, or any asset class with strong volume and price action.

Mars Signals - SSL Trend AnalyzerIntroduction
The "Mars Signals - Precision Trend Analyzer with SSL Baseline & Price Action Zones" is a comprehensive technical analysis tool designed for traders seeking to enhance their market analysis and trading strategies. This indicator integrates multiple advanced trading concepts, including dynamic moving averages, trend detection algorithms, momentum indicators, volume analysis, higher timeframe confirmation, candlestick pattern recognition, and precise price action zones. By combining these elements, the indicator aims to provide clear and actionable buy and sell signals, helping traders to make informed decisions in various market conditions.
Core Components and Functionality
1.Dynamic Baseline Calculation
Moving Average Types: The indicator allows users to select from a variety of moving average types for the baseline calculation, including Simple Moving Average (SMA), Exponential Moving Average (EMA), Hull Moving Average (HMA), Weighted Moving Average (WMA), Double EMA (DEMA), Triple EMA (TEMA), Least Squares Moving Average (LSMA), Triangular Moving Average (TMA), Kijun (from Ichimoku Kinko Hyo), and McGinley's Dynamic.
Baseline Length: Users can customize the length of the moving average, providing flexibility to adjust the sensitivity of the baseline to market movements.
Signal Line Generation: The indicator computes a dynamic signal line based on the relationship between the close price and the moving averages of the high and low prices. This signal line adapts to market volatility and trend changes.
2.SSL Baseline Integration
SSL Baseline: In addition to the primary baseline, the indicator incorporates an SSL (Semaphore Signal Level) Baseline, which further refines trend detection by considering the highs and lows over a specified period.
Dual Confirmation: The combination of the primary baseline and the SSL baseline enhances the reliability of the trend signals by requiring agreement between both baselines before generating a signal.
3.Momentum and Trend Filters
Relative Strength Index (RSI): The indicator uses the RSI to assess the momentum of price movements, filtering out signals that occur during overbought or oversold conditions.
Moving Average Convergence Divergence (MACD): The MACD is employed to identify the direction and strength of the trend, adding another layer of confirmation to the signals.
Average Directional Index (ADX): The ADX measures the strength of the trend, ensuring that signals are generated only when the market shows significant directional movement.
4.Volume Analysis
Volume Filter: An optional volume filter compares the current volume to its moving average, allowing traders to focus on signals that occur during periods of higher market activity.
5.Higher Timeframe Confirmation
Multi-Timeframe Analysis: The indicator can incorporate data from a higher timeframe, comparing the current price to the higher timeframe's baseline and signal line. This feature helps traders align their trades with the broader market trend.
6.Candlestick Pattern Recognition
Bullish Patterns: The indicator detects bullish patterns such as Bullish Engulfing, Piercing Line, Hammer, and Doji.
Bearish Patterns: It also identifies bearish patterns like Bearish Engulfing, Dark Cloud Cover, Shooting Star, and Doji.
Pattern Prioritization: The patterns are prioritized to highlight the most significant formations, which can serve as additional confirmation for trade entries and exits.
7.Price Action Zones
Support and Resistance Levels: The indicator automatically identifies pivot highs and lows to establish dynamic support and resistance levels.
Zone Visualization: It draws shaded rectangles on the chart to represent these zones, providing a clear visual aid for potential reversal or breakout areas.
ATR-Based Zone Width: The zones' thickness is dynamically calculated using the Average True Range (ATR), adjusting to the current market volatility.
Background Coloring: The chart background changes color when the price is above the maximum resistance or below the minimum support, alerting traders to significant price movements.
Interpreting the Signals
1.Buy Signals
Conditions:
Price crosses above the signal line.
RSI is below 70 (not overbought).
MACD line is above the signal line (indicating bullish momentum).
ADX is above the user-defined threshold (default is 20), confirming a strong trend.
(Optional) Volume is above its moving average if the volume filter is enabled.
(Optional) Price is above the higher timeframe baseline and signal line if the higher timeframe filter is enabled.
(Optional) A bullish candlestick pattern is detected if the candlestick pattern filter is enabled.
Visual Indicators:
An upward-pointing label with the text "BUY" appears below the price bar.
The baseline and SSL baseline lines turn to colors indicating bullish conditions.
2.Sell Signals
Conditions:
Price crosses below the signal line.
RSI is above 30 (not oversold).
MACD line is below the signal line (indicating bearish momentum).
ADX is above the user-defined threshold, confirming a strong trend.
(Optional) Volume is above its moving average if the volume filter is enabled.
(Optional) Price is below the higher timeframe baseline and signal line if the higher timeframe filter is enabled.
(Optional) A bearish candlestick pattern is detected if the candlestick pattern filter is enabled.
Visual Indicators:
A downward-pointing label with the text "SELL" appears above the price bar.
The baseline and SSL baseline lines turn to colors indicating bearish conditions.
3.Support and Resistance Zones
Interpretation:
Resistance Zones: Represent areas where the price may face selling pressure. A break above these zones can signal a strong bullish move.
Support Zones: Represent areas where the price may find buying interest. A break below these zones can signal a strong bearish move.
Background Color:
The background turns red when the price is above the maximum resistance, indicating potential overextension.
The background turns green when the price is below the minimum support, indicating potential undervaluation.
Effective Usage Strategies
1.Customization
Adjusting Baseline and SSL Settings: Traders should experiment with different moving average types and lengths to match their trading style and the specific characteristics of the asset being analyzed.
Filtering Parameters: Modify RSI, MACD, and ADX settings to fine-tune the sensitivity of the signals.
Volume and Higher Timeframe Filters: Enable these filters to add robustness to the signals, especially in volatile markets or when trading higher timeframes.
2.Combining with Other Analysis
Fundamental Analysis: Use the indicator in conjunction with fundamental insights to validate technical signals.
Risk Management: Always apply proper risk management techniques, such as setting stop-loss and take-profit levels based on the support and resistance zones provided by the indicator.
3.Backtesting
Historical Analysis: Utilize the indicator's settings to backtest trading strategies on historical data, helping to identify the most effective configurations before applying them in live trading.
4.Monitoring Market Conditions
Volatility Awareness: Pay attention to the ATR and ADX readings to understand market volatility and trend strength, adjusting strategies accordingly.
Event Considerations: Be cautious around major economic announcements or events that may impact market behavior beyond technical indications.
Indicator Inputs and Customization Options
Baseline Type and Length: Select from multiple moving average types and specify the period length.
ADX Settings: Adjust the length, smoothing, and threshold for trend strength confirmation.
Volume Filter: Enable or disable the volume confirmation filter.
Higher Timeframe Filter: Choose to incorporate higher timeframe analysis and specify the desired timeframe.
Candlestick Patterns: Enable or disable the detection of candlestick patterns for additional signal confirmation.
SSL Baseline Type and Length: Customize the SSL baseline settings separately from the primary baseline.
Price Action Zones Settings:
Zone Thickness: Adjust the visual thickness of the support and resistance zones.
Lookback Period: Define how far back the indicator looks for pivot points.
ATR Multiplier for Zone Width: Set the multiplier for ATR to determine the dynamic width of the zones.
Maximum Number of Zones: Limit the number of support and resistance zones displayed.
Pivot Bars: Customize the number of bars to the left and right used for identifying pivot highs and lows.
Conclusion
The "Mars Signals - Precision Trend Analyzer with SSL Baseline & Price Action Zones" is a versatile and powerful tool that amalgamates essential technical analysis techniques into a single, user-friendly indicator. By providing clear visual signals and incorporating multiple layers of confirmation, it assists traders in identifying high-probability trading opportunities. Whether you are a day trader, swing trader, or long-term investor, this indicator can be tailored to suit your trading style and enhance your decision-making process.
To maximize the benefits of this indicator:
Understand Each Component: Familiarize yourself with how each part of the indicator contributes to the overall signal generation.
Customize Thoughtfully: Adjust the settings based on the asset class, market conditions, and your risk tolerance.
Practice Diligently: Use demo accounts or paper trading to practice and refine your strategy before deploying it in live markets.
Stay Informed: Continuously educate yourself on technical analysis and market dynamics to make the most informed decisions.
Disclaimer
Trading financial markets involves risk, and past performance is not indicative of future results. This indicator is a tool to aid in analysis and should not be the sole basis for any trading decision. Always conduct your own research and consider consulting with a licensed financial advisor.

Strong Pullback Indicator [Rami_LB]Strong Pullback Indicator
Description:
The Strong Pullback Indicator is designed to identify potential pullbacks or even trend reversals by utilizing a specific candlestick pattern in conjunction with the Relative Strength Index (RSI). It is advised to employ this indicator in chart intervals of 15 minutes or higher, as intervals below 15 minutes may generate excessive false signals.
Working Mechanism:
Upon detecting the designated candlestick pattern, the indicator examines whether any of the last five candles exhibit RSI values below 30 or above 70 across at least four distinct time intervals, depending on whether the pattern is bullish or bearish. The RSI calculations incorporate eight different intervals: 1 minute (1m), 5 minutes (5m), 15 minutes (15m), 30 minutes (30m), 1 hour (1h), 2 hours (2h), 4 hours (4h), and 1 day (1d). An arrow is rendered above or below the current candle only when these conditions are met.
Users have the option to adjust the number of overbought or oversold intervals, as well as the general settings for the RSI.
SL/TP Lines:
The indicator can also serve as a trade signal to initiate trades in the opposite direction. To evaluate the potential success of a trade in a backtesting scenario, SL (Stop Loss) and TP (Take Profit) lines can be displayed on the chart. The SL is calculated by taking the distance from the close of the current candle to the high/low of the previous candle and multiplying it by 2.
In the settings, you can alter the Risk Reward Ratio (RRR) of the trade. Given the pullback nature of this indicator, a RRR of 1:1 is deemed logical, thus set as the default value.
Bullish vs. Bearish Candle Counter:
An additional feature of this indicator is its ability to analyze the last 100 candles to ascertain the ratio of bullish to bearish candles. When a 60% threshold is reached, the chart background color alters accordingly. This feature was conceived after a thorough analysis of over 50,000 candles of a currency pair revealed nearly identical counts of bullish and bearish candles, suggesting a market tendency to maintain this balance.
Within the settings, you have the flexibility to modify the number of candles to be analyzed and the percentage threshold for each candle type.
Should you have any ideas on how to enhance the accuracy of this indicator, or suggestions for other indicators that could improve the signals, feel free to leave a comment.

Liquidity Spike PoolThe “Liquidity Pools” indicator is a tool for market analysts that stands out for its ability to clearly project the intricate zones of manipulation present in financial markets. These crucial territories emerge when supply or demand takes over, resulting in long shadows (wicks) on the chart candles. Imagine these regions as "magnets" for prices, as they represent authentic "liquidity pools" where the flow of money into the market is significantly concentrated. But the value of the indicator goes beyond this simple visualization: these zones, when identified and interpreted correctly, can play a crucial role for traders looking for profitable entry points. They can mutate into important bastions of support or resistance, providing traders with key anchor points to make informed decisions within their trading strategies.
A key aspect to consider is the importance of different time frames in analyzing markets. Larger time frames, such as daily or 4h, tend to host larger and more relevant liquidity zones. Therefore, a successful strategy might involve identifying these areas of manipulation over longer time frames through the use of this indicator, and then applying these findings to shorter time frames. This approach allows you to turn manipulation zones into crucial reference points that merit constant surveillance while making trading decisions on shorter time frames.
The indicator uses color to convey information clearly and effectively:
- Dark blue lines highlight candles with significant upper wick, signaling the possible presence of an important manipulation area in the considered area.
- Dark red lines are reserved for sizable candlesticks with significant upper wick, emphasizing situations that are particularly relevant to traders.
- Dark gray lines highlight candles with significant lower wick, providing a valuable indication of manipulation zones where the bid may have prevailed.
- White lines highlight sizable candlesticks with significant lower wick, clearly indicating situations where demand has been predominant and may have helped form a liquidity pool.
This indicator constitutes an important resource for identifying and clearly displaying candles with significant wicks, allowing traders to distinguish between ordinary market conditions and circumstances particularly relevant to their trading strategies. Thanks to the distinctive colors of the lines, the indicator offers intuitive visual guidance, allowing traders to make more informed decisions while carrying out their analyses.

Engulfing and emaThis is a Pine Script script that helps you see the Engulfing Candlestick and Inside Bar (Boring Candle) candle patterns on the TradingView chart, as well as drawing two Exponential Moving Averages (EMA). Here's a simple explanation:
1. **Candle Pattern**:
- This script identifies the Engulfing Candlestick pattern, which indicates potential changes to the price. If this pattern is detected, the script will show a green (for buy) or red (for sell) arrow above or below that candle.
- The script also identifies the Inside Bar (Boring Candle), which indicates the period area in the market. This candle will be the color you choose (default is orange).
2. **Moving Average (EMA)**:
- This script also plots two Exponential Moving Averages (EMA) on the chart. EMA is a tool that helps you see price trends more clearly.
3. **Risk Management**:
- This script calculates the Stop Loss (SL) and Take Profit (TP) levels for each Engulfing pattern. This helps you manage your trading risks.
- Labels are displayed on the charts for SL and TP, so you know where to place them.
With the help of this script, you can easily identify important patterns in the market and manage your risks better. Make sure to choose a demo account before using it in real trading.

FOREX MASTER PATTERN Companion ToolWhat This Indicator Does
The Forex Master Pattern uses candlesticks, which provide more information than line, OHLC or area charts. For this reason, candlestick patterns are a useful tool for gauging price movements on all time frames. While there are many candlestick patterns, there is one which is particularly useful...
The Engulfing Pattern
An engulfing pattern provides an excellent trading opportunity because it can be easily spotted and the price action indicates a strong and immediate change in direction. In a downtrend, an up candle real body will completely engulf the prior down candle real body (bullish engulfing). In an uptrend a down candle real body will completely engulf the prior up candle real body (bearish engulfing).
Used in conjunction with the FOREX Master Pattern value line, the Engulfing Pattern can assist the trader with reversal timing or trend confirmation during the expansion and trend phases.
As shown in the screenshot below. Engulfing Candles usually precede a sharp move in price in the direction of the engulfing candle.
As shown in the screenshot below, when the Show Lines option is ON while using the indicator, both red and green lines are drawn on the chart automatically when engulfing candles form. These lines are projected forward 100 bars and tend to be reliable support and resistance areas. These areas are typically hidden from view.
In addition to the Show Lines option, the indicator (by default) creates boxes around trading zones that are created when an engulfing candle is formed. (There is an option to hide these from view if desired).
As seen in the screenshot below, these areas / zones are wider than a line and encompass a resistance / support zone rather than a specific price. Liquidity is usually high in these areas and a lot of selling / buying occurs here. These zones are drawn in advance out into the future giving the trader an idea of where price will revert to eventually.
A combination of LINES and AREAS can be used giving the user a better idea of where within the zone price will go.
As seen on the screenshot below, this combination provides a pretty accurate indication of the reversal point well in advance.
As seen in the screenshot below, when a ZONE / AREA has been fully breached (crossed) by price, the area is deactivated an no longer continues forward on the chart. Until price breaches an area, it remains valid and continues on the chart until and only if it is breached by price.
The Indicator is fully customizable.
The use can change the color of the engulfing candles, the color of the zones, transparency etc. You can turn OFF or ON any of the features such as lines, zones, bar coloring, and plotted arrows.
I really hope you get value from this indicator and... HAPPY TRADING!!

AbdulLibraryLibrary "AbdulLibrary"
The library consists of three sections:
Technical Analysis Functions - A collection of tools commonly used by day traders
Trading Setup Filters Functions - A number of filters that help day traders to screen trading signals
Candlestick Pattern Detection Functions - To detect different candlestick patterns that are used in day trading setups
Note that this would have been possible without the help of @ZenAndTheArtOfTrading as I build-up this library after completing his pine script mastery course so big thanks to him
The content of the library are:-
fibLevels(preDayClose, preDayHigh, preDayLow) Calculates Daily Pivot Point and Fibonacci Key Levels
Parameters:
preDayClose : The previous day candle close
preDayHigh : The previous day candle high
preDayLow : The previous day candle low
Returns: Returns Daily Pivot Point and Fibonacci Key Levels as a tuple
bullishFib(canHigh, canLow, fibLevel) Calculates Fibonacci Levels in Bullish move
Parameters:
canHigh : The high of the move
canLow : The low of the move
fibLevel : The Fib level as % you want to calculate
Returns: Returns The Fib level for the Bullish move
bearishFib(canHigh, canLow, fibLevel) Calculates Fibonacci Levels in Bearish move
Parameters:
canHigh : The high of the move
canLow : The low of the move
fibLevel : The Fib level as % you want to calculate
Returns: Returns The Fib level for the Bearish move
getCandleSize() Calculates the size of candle (high - low) in points
Returns: Returns candle size in points
getCandleBodySize() Calculates the size of candle (close - open) in points
Returns: Returns candle body size in points
getHighWickSize() Calculates the high wick size of candle in points
Returns: Returns The high wick size of candle in points
getLowWickSize() Calculates the low wick size of candle in points
Returns: Returns The low wick size of candle in points
getBodyPercentage() Calculates the candle body size as % of overall candle size
Returns: Returns The candle body size as % of overall candle size
isSwingHigh(period) Checks if the price has created new swing high over a period of time
Parameters:
period : The lookback time we want to check for swing high
Returns: Returns True if the current candle or the previous candle is a swing high
isSwingLow(period) Checks if the price has created new swing low over a period of time
Parameters:
period : The lookback time we want to check for swing low
Returns: Returns True if the current candle or the previous candle is a swing low
isDojiSwingHigh(period) Checks if a doji is a swing high over a period of time
Parameters:
period : The lookback time we want to check for swing high
Returns: Returns True if the doji is a swing high
isDojiSwingLow(period) Checks if a doji is a swing low over a period of time
Parameters:
period : The lookback time we want to check for swing low
Returns: Returns True if the doji is a swing low
isBigBody(atrFilter, atr, candleBodySize, multiplier) Checks if a candle has big body compared to ATR
Parameters:
atrFilter : Check if user wants to use ATR to filter candle-setup signals
atr : The ATR value to be used to compare candle body size
candleBodySize : The candle body size
multiplier : The multiplier to be used to compare candle body size
Returns: Returns Boolean true if the candle setup is big
isSmallBody(atrFilter, atr, candleBodySize, multiplier) Checks if a candle has small body compared to ATR
Parameters:
atrFilter : Check if user wants to use ATR to filter candle-setup signals
atr : The ATR value to be used to compare candle body size
candleBodySize : The candle body size
multiplier : The multiplier to be used to compare candle body size
Returns: Returns Boolean true if the candle setup is small
isHammer(fibLevel, colorMatch) Checks if a candle is a hammer based on user input parameters and candle conditions
Parameters:
fibLevel : Fib level to base candle body on
colorMatch : Checks if user needs for the candel to be green
Returns: Returns Boolean - True if the candle setup is hammer
isShootingStar(fibLevel, colorMatch) Checks if a candle is a shooting star based on user input parameters and candle conditions
Parameters:
fibLevel : Fib level to base candle body on
colorMatch : Checks if user needs for the candel to be red
Returns: Returns Boolean - True if the candle setup is star
isBullEngCan(allowance, period) Check if a candle is a bullish engulfing candle
Parameters:
allowance : How many points the candle open is allowed to be off (To allow for gaps)
period : The lookback period for swing low check
Returns: Boolean - True only if the candle is a bullish engulfing candle
isBearEngCan(allowance, period) Check if a candle is a bearish engulfing candle
Parameters:
allowance : How many points the candle open is allowed to be off (To allow for gaps)
period : The lookback period for swing high check
Returns: Boolean - True only if the candle is a bearish engulfing candle
isBullDoji(maxSize, wickLimit, colorFilter) Check if a candle is a bullish doji candle
Parameters:
maxSize : Maximum candle body size as % of total candle size to be considered as doji
wickLimit : Maximum wick size of one wick compared to the other wick
colorFilter : Checks if the doji is green
Returns: Boolean - True if the candle is a bullish doji
isBearDoji(maxSize, wickLimit, colorFilter) Check if a candle is a bearish doji candle
Parameters:
maxSize : Maximum candle body size as % of total candle size to be considered as doji
wickLimit : Maximum wick size of one wick compared to the other wick
colorFilter : Checks if the doji is red
Returns: Boolean - True if the candle is a bearish doji
isBullOutBar() Check if a candle is a bullish outside bar
Returns: Boolean - True if the candle is a bullish outside bar
isInsideBar() Check if a candle is an inside bar
Returns: Returns Boolean - True if a candle is an inside bar

Circular Candlestick ChartAn original (but impractical) way to represent a candlestick chart using circles arc.
The most recent candles are further away from the circle origin. Note that OHLC values follow a clockwise direction. A higher arc length would indicate candles with a higher body or wick range.
The Length settings determine the number of past candles to be included in the circular candlestick chart. The Width setting control the width of the circular chart. The Spacing setting controls the space between each arcs. Finally, the Precision settings allow obtaining a more precise representation of candles, with lower values returning more precise results, however, more precision requires a higher amount of lines. Settings are quite hard to adjust, using a higher length might require a lower spacing value.
Additionally, the script includes two pointers indicating the location of the 75 (in blue) and 25 (in orange) percentiles. This allows obtaining an estimate of the current market sentiment, with the most recent arcs laying closer to the 75 percentile pointer indicating an up-trend.
This new way to represent candlesticks might be useful to more easily identify candles clusters or to find new price patterns. Who knows, we know that new ways to see prices always stimulate traders imagination.
See you next year.

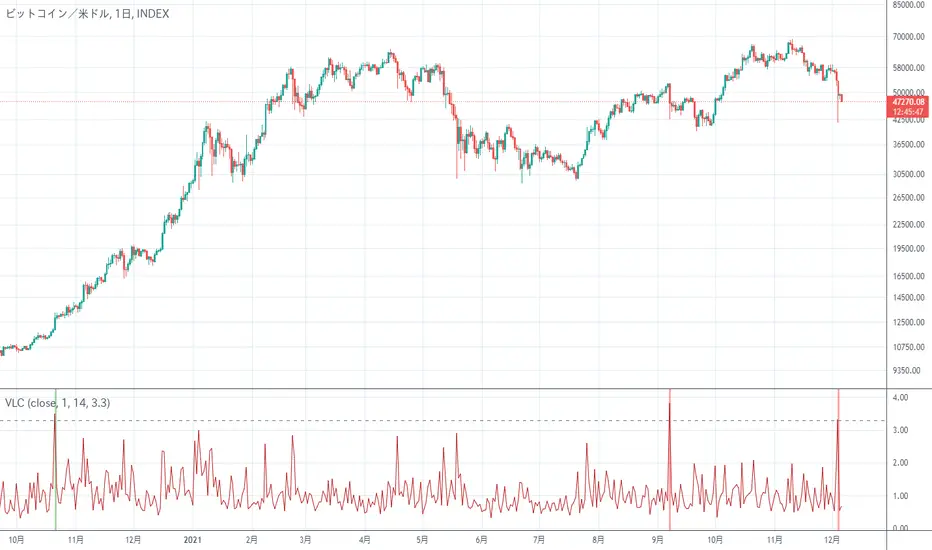
Very Long Candlestick Alert 長いローソク足を検出It is an indicator that only detects long candlesticks.
May alert you when the market crashes
Depending on the chart, it may be necessary to adjust the Threshold of the setting
長いローソク足を検出するだけのインジケーターです
相場がクラッシュした時にアラートをならせるかもしれません
チャートによっては設定のThresholdを調整する必要があります