ابحث في النصوص البرمجية عن "Exponential"

Exponential weighted volatilityEstimator of current annualized volatility that works for daily, weekly, monthly timeframes.
Lambda should be choosen inside the 0 to 1 range, with a lower lambda giving more weight to the movement in the most recent candlesticks. The literature default is 0.97, I'm setting a default value of 0.94 instead.


Exponential Hull MA Oscillator PrototypeClamped EHMA Oscillator Prototype with 21/200 EHMA with additional JMA smoothing (Credit: @everget)
Note: This is an experiment - this is not a polished indicator


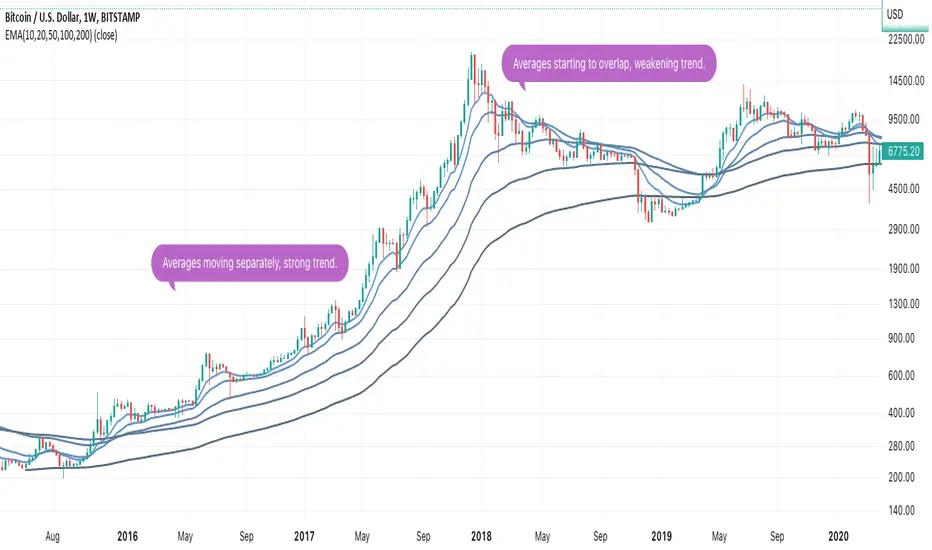
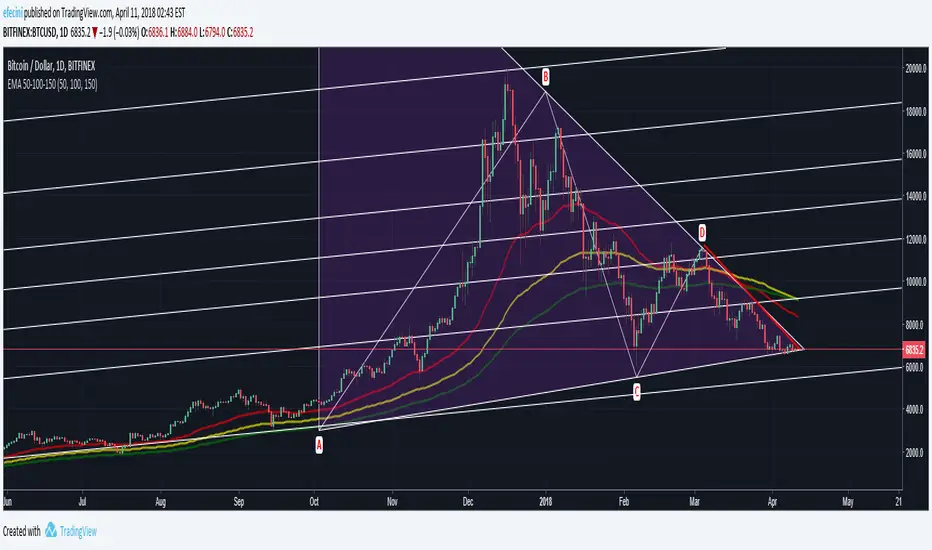
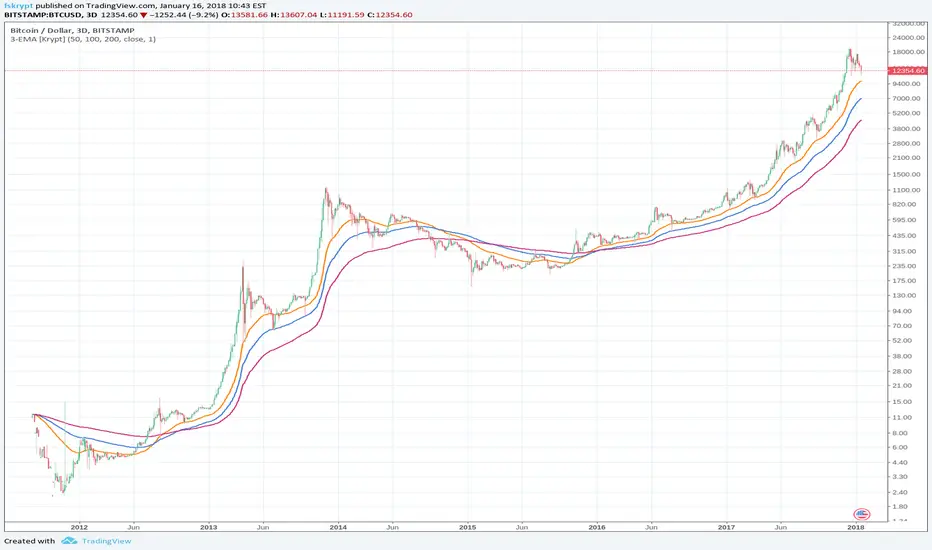
exponential Moving Averagesall in one ema for a select set i use 12/26 then the longer ones 50,100,200


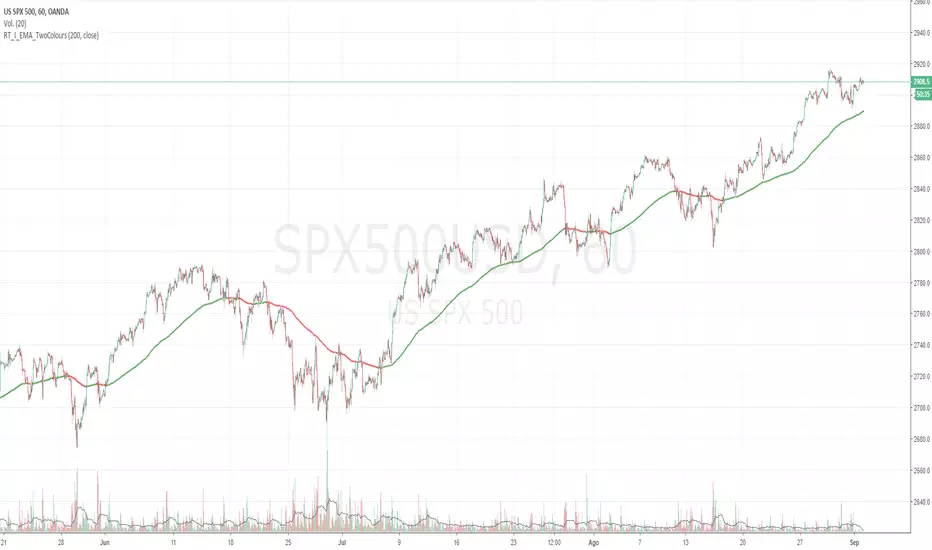
Moving average Two ColoursExponential moving average of 200 periods, which changes color according to the position of the candles.
(200 periods: default configuration Option to change periods allowed)
If the candles are on the EMA, this will have green color, otherwise red color (colors, thickness configurable).
**********************************************************************************************************************************************
Descripción en Español:
Media móvil Exponencial de 200 periodos, la cuál cambia de color según posición de las velas.
(200 periodos: configuración default. Opción de cambio de periodos permitida)
Si las velas están sobre la EMA , esta tendrá color verde, caso contrario color rojo (colores, grosor configurables).


EMA FIBO 4HOURSExponential Moving Averages of 4 Fibonacci Levels((55,144,233,377)*6) in 4 Hour Timezone


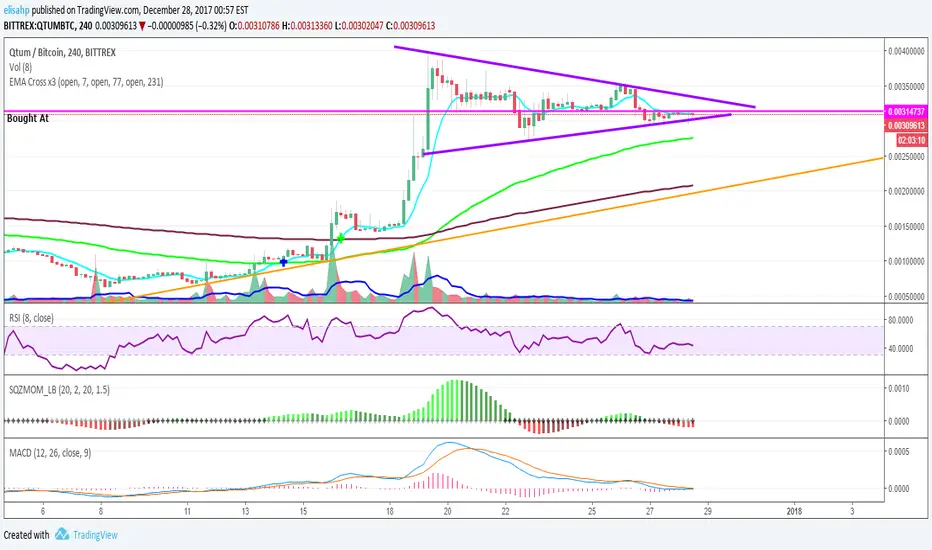
EMA Cross x3 (7, 77, 231)Exponential Moving Average at periods, 7, 77, 231. You will see a blue cross when the short EMA crosses the medium EMA, and a green cross when it crosses the long EMA.
EMA SpreadExponential Moving Average Spread is the percentage spread difference between EMA1 (Slow) and EMA2 (Fast) ie. the gap between two indicators slow and fast. Useful when used alongside EMA cross, MACD, and RSI to strengthen buy/sell signals.

MTF EMAExponential Moving Average indicator that can be configured to display different timeframe EMA's.
Timeframe is set in minutes. Max timeframe currently is the daily (1440 minutes). Any value higher than 1440 will result in no plot.
Examples:
Daily 50 EMA plotted on 4H chart
4H 50 EMA and Daily 50 EMA plotted on 1H chart
Can also work in reverse if needed.
Example, Daily 50 EMA plotted on Weekly Chart


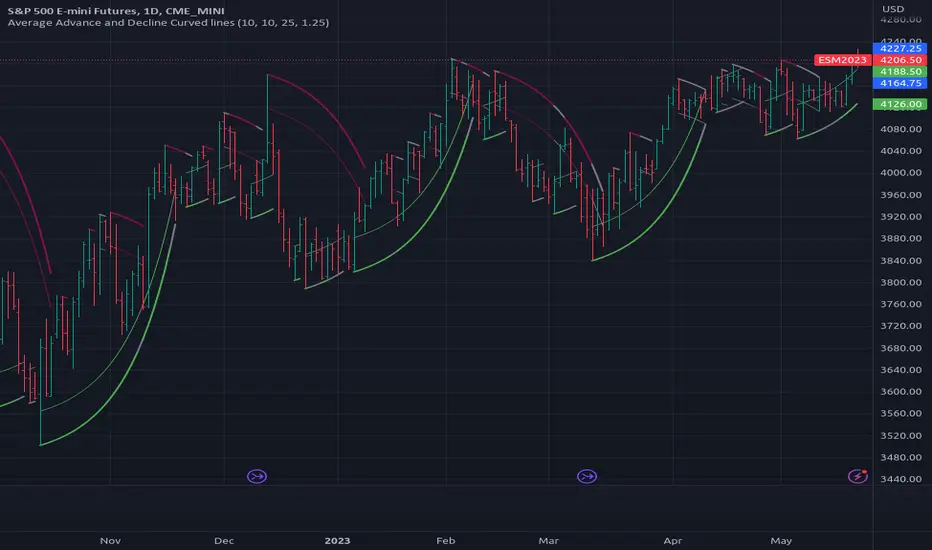
[RS]Average Advance and Decline Curved Lines V0exponential curve linear regression, use falloff multiplier to control curve falloff strength.
Trend Dashboard & Supply DemandTrend Dashboard & Supply Demand
This indicator is a comprehensive trend analysis and price action study tool designed for traders who value a clean interface and data-driven insights. It combines momentum tracking, trend identification, and structural analysis into a single visual suite.
Key Features:
Triple EMA System: Features three Exponential Moving Averages (Fast, Mid, Slow) to help traders identify trend alignment and potential dynamic support/resistance levels.
Smart Supply/Demand Zones: Automatically projects the latest Demand/Supply zones based on ATR (Average True Range) volatility. To maintain a clean chart, old zones are automatically removed when new signals appear.
Professional Dashboard: A real-time monitor displaying Market Status (Bullish/Bearish), RSI Momentum, Volatility (ATR), and suggested Trade Bias.
Optimized Visuals: Designed for maximum scannability, ensuring zones and labels do not obstruct price candles or other critical chart data.
How to Use:
Identify the Trend: Check the Triple EMA alignment and the "Market Status" on the dashboard.
Find Entries: Look for price pullbacks into the DEMAND zone (for longs) or rallies into the SUPPLY zone (for shorts) after a signal is generated.
Confirm Momentum: Use the RSI value in the dashboard to ensure the market is not overextended before entering a trade.
Customization: You can adjust the zone thickness (Zone Mult) in the settings menu to fit your specific timeframe or trading style.
⚠️ Disclaimer: This script is provided for EDUCATIONAL PURPOSES ONLY. It does not constitute financial advice, investment recommendations, or an invitation to trade. Trading involves significant risk. The developer (TomGoodCar) is not responsible for any losses incurred from the use of this script. Always perform your own research and backtesting before making any investment decisions.
