Dynamic Signal EngineDynamic Signal Engine
The Dynamic Signal Engine is a powerful and versatile indicator, designed to help traders make informed decisions by combining trend analysis with key support and resistance levels. This tool is inspired by the Linear Regression Oscillator , which laid the foundation for this enhanced implementation. By building on the original concept, this script introduces additional features, customization, and integration with dynamic trading strategies to suit diverse trading styles.
Key Features
Inspiration and Foundation
This indicator draws inspiration from the Linear Regression Oscillator , leveraging its robust trend detection capabilities while adding custom enhancements for broader functionality and user adaptability.
Trading Style Customization
Adaptable for Scalping, Intraday, and Swing Trading with dynamic parameter adjustments for each style.
User-defined inputs for thresholds, lookback periods, and visualization options provide further control.
Enhanced Linear Regression Oscillator (LRO)
A refined implementation of the LRO calculates deviations from a regression line, normalized for improved trend detection.
Identifies bullish and bearish crossovers with added alerts and visual markers.
Includes proximity alerts for critical thresholds to help traders anticipate key market movements.
Dynamic Support and Resistance Integration
Incorporates ENIGMA Signal Logic to identify swing highs and lows, dynamically marking them as fractal support and resistance levels.
When a sell signal from ENIGMA is generated, traders can choose to sell immediately or use the low of the previous candle as the entry point. Similarly, for a buy signal, traders can buy immediately or use the high of the previous candle for entry. These signals are visually indicated by a green triangle for buy signals, ensuring clear and actionable insights.
Advanced Visualization
Displays key levels with customizable horizontal lines (solid, dashed, or dotted) and labels for clarity.
Candle colours and mini arrows highlight trends and potential trading opportunities.
Real-Time Alerts
Alerts for LRO threshold crossings and swing-level breaches keep you updated without the need for constant monitoring.
Optimized for Usability
Designed to keep charts clean by limiting displayed trades and signals to recent activity.
Adjustable parameters ensure flexibility and a user-friendly experience.
How It Works
Trend Detection with Enhanced LRO
The indicator builds on the Linear Regression Oscillator , calculating oscillations of price movements and normalizing them for trend analysis. Crossovers and threshold proximity are visualized on the chart and trigger alerts for potential market shifts.
Dynamic Support and Resistance Levels
The ENIGMA Signal Logic identifies recent swing highs and lows, marking them as key levels. These levels are dynamically updated as new swing points are detected, providing actionable support and resistance zones.
Signal Confirmation
Buy or sell signals are confirmed when:
Price breaches the swing levels.
The LRO aligns with directional bias (e.g., bearish crossover for sell signals).
Signals are further clarified by ENIGMA's green triangle indicators, showing key buy and sell opportunities.
Visualization and Alerts
Signals are displayed using arrows, labelled horizontal lines, and optional candle colours. Alerts notify traders of key events, such as LRO threshold crossings or swing-level breaches.
How to Use
Choose your Trading Style: Scalping, Intraday, or Swing Trading. The indicator adjusts its default settings automatically.
Fine-tune parameters like LRO thresholds, line lengths, and the number of visible trades to suit your preferences.
Observe the chart for signals:
Green arrows and lines indicate buy opportunities.
Red arrows and lines signal sell opportunities.
Use the alert system to stay informed about LRO thresholds and signal confirmations.
Integrate the indicator with your existing trading strategy for better decision-making.
Acknowledgement
This script was inspired by the Linear Regression Oscillator . While it builds on the core concept, this implementation introduces unique enhancements, such as dynamic signal integration, trading style adaptability, and advanced visualization tools, making it a highly customizable and versatile tool for traders.
Disclaimer
This indicator is intended for educational purposes only and should not be considered financial advice. Always perform due diligence and apply appropriate risk management when trading.
ابحث في النصوص البرمجية عن "Fractal"

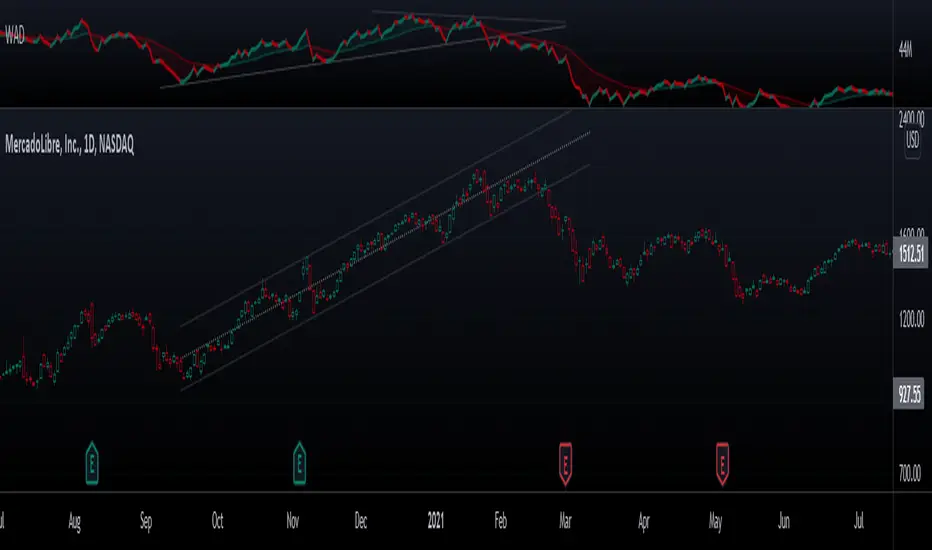
Hidden SMT Divergence ICT 01 [TradingFinder] HSMT SMC Technique🔵 Introduction
Hidden SMT Divergence, an advanced concept within the Smart Money Technique (SMT), identifies discrepancies between correlated assets by focusing on their closing prices.
Unlike the standard SMT Divergence, which uses high and low prices for analysis, Hidden SMT Divergence uncovers subtle signals by examining divergences based on the assets' closing values.
These divergences often highlight potential reversals or trend continuations, making this technique a valuable tool for traders aiming to anticipate market movements.
This approach applies across various markets and asset classes, including :
Commodities : CAPITALCOM:GOLD vs. CAPITALCOM:SILVER or BLACKBULL:BRENT vs. BLACKBULL:WTI .
Indices : NASDAQ:NDX vs. TVC:SPX vs. FX:US30 .
FOREX : FX:EURUSD vs. OANDA:GBPUSD vs. TVC:DXY (US Dollar Index).
Cryptocurrencies : BITSTAMP:BTCUSD vs. COINBASE:ETHUSD vs. KUCOIN:SOLUSDT vs. CRYPTOCAP:TOTAL3 .
Volatility Measures : FOREXCOM:XAUUSD vs. TVC:VIX (Volatility Index).
By identifying divergences within these asset groups, traders can gain actionable insights into potential market reversals or shifts in trend direction. Hidden SMT Divergence is particularly effective for pinpointing subtle market signals that traditional methods may overlook.
Bullish Hidden SMT Divergence : This divergence emerges when one asset forms a higher low, while the correlated asset creates a lower low in terms of their closing prices. It often signals weakening downward momentum and a potential reversal to the upside.
Bearish Hidden SMT Divergence : This occurs when one asset establishes a higher high, while the correlated asset forms a lower high based on their closing prices. It typically reflects declining upward momentum and a probable shift to the downside.
🔵 How to Use
The Hidden SMT Divergence indicator provides traders with a systematic approach to identify market reversals or trend continuations through divergences in closing prices between two correlated assets.
🟣 Bullish Hidden SMT Divergence
Bullish Hidden SMT Divergence occurs when the closing price of the primary asset forms a higher low, while the correlated asset creates a lower low. This pattern indicates weakening downward momentum and signals a potential reversal to the upside.
After identifying the divergence, confirm it using additional tools like support levels, volume trends, or indicators such as RSI and MACD. Enter a buy position as the price shows signs of reversal near support zones, ensuring proper risk management by placing a stop-loss below the support level.
Bearish Hidden SMT Divergence
Bearish Hidden SMT Divergence is identified when the closing price of the primary asset forms a higher high, while the correlated asset creates a lower high. This divergence suggests a weakening uptrend and a likely reversal to the downside.
Validate the signal by examining resistance levels, declining volume, or complementary indicators. Consider entering a sell position as the price starts declining from resistance levels, and set a stop-loss above the resistance zone to limit potential losses.
🔵 Setting
Second Symbol : Select the secondary asset to compare with the primary asset. By default, "XAUUSD" (Gold) is used, but it can be customized to any stock, cryptocurrency, or currency pair.
Divergence Fractal Periods : Defines the number of past candles considered for identifying divergences. The default value is 2, but traders can adjust it for greater precision.
Bullish Divergence Line : Displays a dashed line connecting the points of bullish divergence.
Bearish Divergence Line : Shows a similar line for bearish divergence points.
Bullish Divergence Label : Marks areas of bullish divergence with a "+SMT" label.
Bearish Divergence Label : Highlights bearish divergences with a "-SMT" label.
Chart Type : Choose between Line or Candle charts for enhanced visualization.
🔵 Conclusion
Hidden SMT Divergence offers traders a refined method for identifying market reversals by analyzing closing price discrepancies between correlated assets. Its ability to uncover subtle divergences makes it an essential tool for traders who aim to stay ahead of market trends.
By integrating this technique with other technical analysis tools and sound risk management, traders can enhance their decision-making process and capitalize on market opportunities with greater confidence.
Hidden SMT Divergence’s focus on closing prices ensures more precise signals, helping traders refine their strategies across various markets, including Forex, commodities, indices, and cryptocurrencies.
Its open-source nature allows for customization and verification, providing transparency and flexibility to suit diverse trading needs. Hidden SMT Divergence stands as a powerful addition to the arsenal of any trader seeking to unlock hidden opportunities in dynamic financial markets.

Market Structures SMC [TradingFinder] BOS/CHoCH Major & Minor🟣Introduction
Understanding market structure involves analyzing market behavior. In other words, market structure encompasses how the market forms and evolves within trends.
Market structures are typically fractal and nested, so we categorize them into internal (minor) and external (major) structures. There are various definitions of market structure, with different approaches such as Smart Money and ICT providing their own interpretations.
🟣How to Use
The first step in identifying market structure is to analyze key highs and lows. An uptrend is formed when highs and lows are successively higher than previous ones. Similarly, in a downtrend, lows and highs are successively lower than previous ones.
Market trends consist of two types of movements :
•Impulsive movements
•Corrective movements
Impulsive movements align with the main trend and possess high strength and momentum. Conversely, corrective movements go against the main trend and have lower strength and momentum. The following example illustrates these concepts.
🔵 Identifying Break of Structure (BOS)
In a specific trend, for example in a downtrend, when the price breaks below the previous low and forms a new low (LL), a Break of Structure occurs. In an uptrend, a BOS (Market Structure Break or MSB) happens when the price rises and surpasses the last high.
We need at least one BOS to confirm a trend. Breaking above or below the previous high or low must be confirmed by closing at least one candle after that level.
🔵 Identifying Change of Character (CHOCH)
Change of Character (CHOCH) is a key concept in market structure analysis. A change in structure signals a trend change. In other words, a trend ends with a CHOCH (Market Structure Shift or MSS). For instance, in a downtrend, the price declines with BOS.
BOS indicates the strength of the trend, but when the price increases and surpasses the last high, a CHOCH occurs, signaling a shift from a downtrend to an uptrend.
This does not mean entering a buy trade; instead, we should wait for a BOS in the upward direction to confirm the uptrend. Unlike BOS, confirming a CHOCH does not require a candle to close; simply breaking above or below the previous high or low with the candle's wick is sufficient. The following examples show bearish and bullish CHOCH.
🔵 Range Market Structure
Besides uptrends and downtrends, a third structure often found in the market is the range or sideways structure. In this state, the power of buyers and sellers is almost equal, and the market lacks a clear trend.
Many traders believe that the Forex market ranges 80% of the time. Therefore, it requires a lot of patience to wait for a new trend to start.
🟣 Settings
Through the settings, you can customize the display, visibility, and color of each line as desired.

Super OrderBlock / FVG / BoS Tools by makuchaku & eFeThis super indicator is a Swiss army knife for Smart Money traders for OrderBlocks / FVG / BoS
It provides many options for drawing (non-repainting) boxes for OrderBlocks, Fair Value Gaps (FVG) and Break of Structures. The boxes are extended into the future, until the first retest/mitigation.
Some of the additional options (not explained in the diagrams above)
PPDD OB : An order block which is formed after interacting with Liquidity (old low/high, fractal low/high, etc). Since these OB's are in the most premium or most discount, they are Premium Premium Discount Discount OB's (PPDD OB)
HVB Bars : When the volume of any bar is higher than the average volume of last N bars, it could mean something important (in the right context). Hence, the indicator allows for coloring them differently.
This indicator was built as a collaboration between @makuchaku & eFe
Pro tip : This indicator is a simply a tool to visualize trading concepts on the candle stick chart. It is the job of the trader to sequence these effectively into a profitable trade.
If you come across any bug or have a question on how to effectively use the indicator, please don't hesitate to ask questions.
Good luck & good trading!

3SmmaCrossUp + Fractal + RSIThis script is a combination of 3 smoothed moving averages, and RSI. When moving averages are aligned upward (downward) and RSI is above (below) 50 and a down (up) William fractal appears, it enters long (short) position. Exiting from long and short entries are defined by StopLoss and TargetProfit.


[PX] MTF Fractal Level This script identifies multi-timeframe fractal level, which can be used as support and resistance.
If you are looking for someone to develop your own indicator or trading strategy, don't hesitate to get in touch with me here on TradingView or below.
Contact:
www.pascal-simon.de
info@pascal-simon.de

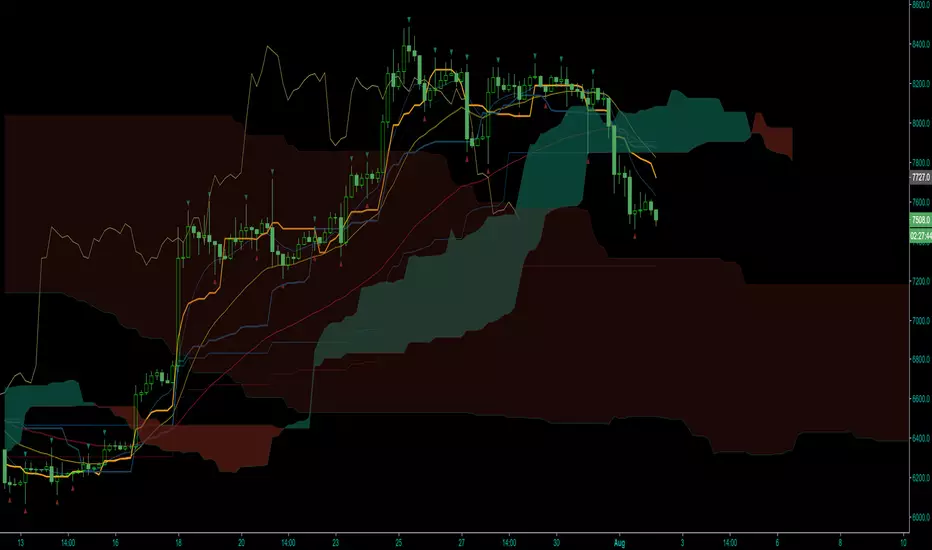
2xIchimoku Cloud + 4xEMA + Williams FractalCopy+Pasted/edited the code from :
Moku
www.tradingview.com
EMA
www.tradingview.com
Fractal
www.tradingview.com
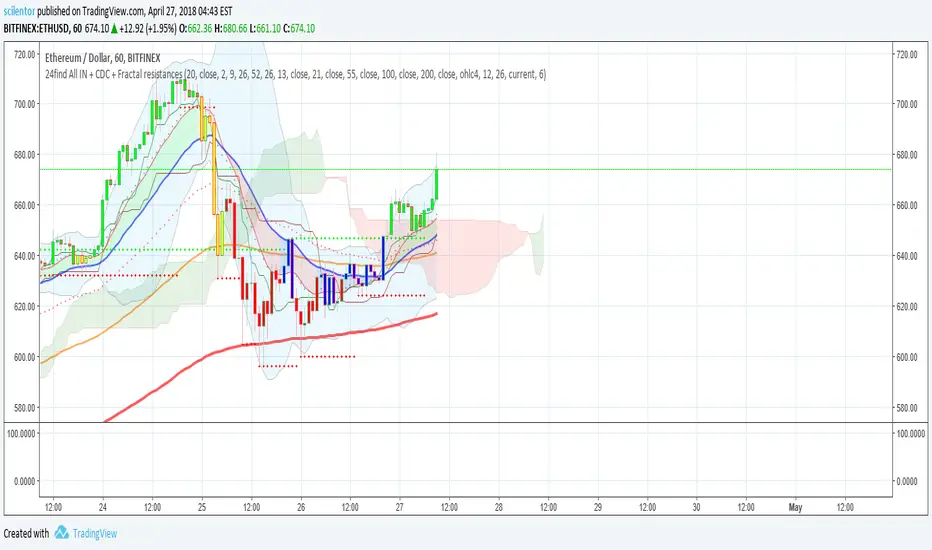
24find All IN + CDC + Fractal resistancesCombined to previous which had only CDC added on top of the original by dimoe with Fractal resistances by synapticEx.
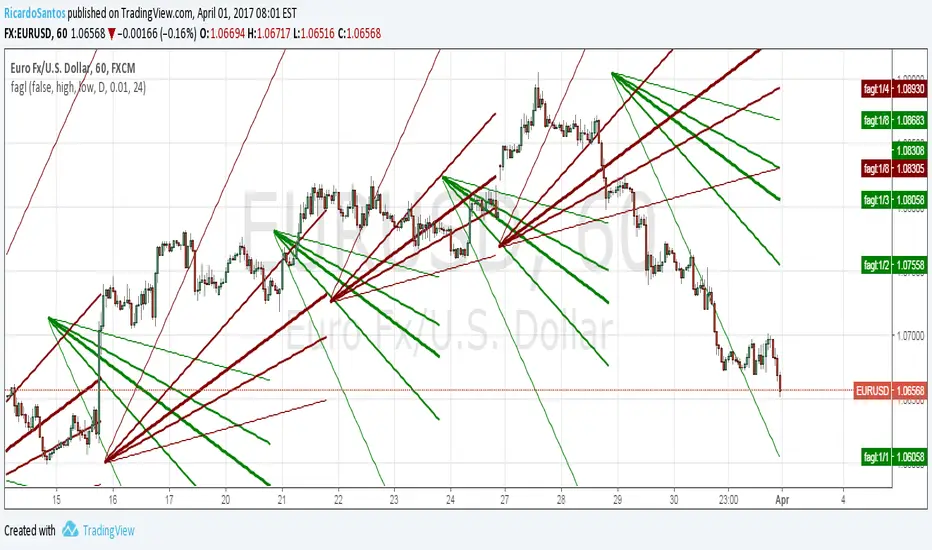
[RS]Fractal Auto Gann LinesEXPERIMENTAL:
GANN lines projection based on zigzag tops/bottoms, use at your own risk.
Chaos 2.0This is pure chaos!
I just wanted 1 thing I can put on a chart to try to get a clearer picture of what is going on (and not take up all the indicator spaces a free user is allowed haha)
Many things going on from so many different users
honestly I'm sorry I cant shout out everyone whose code I have ever read and used in another project just for the sake of learning more about pinescript!
As a way of shouting everyone out! (and giving out my most useful and configurable system)
I give you... CHAOS
I originally got an Alligator, AO, and Fractal script from a user ChaosTrader, then realized I love using averages!
I added the MESA (lazybear?) and the McGinley Dynamic Range (sry idk) and a simple 233 SMA.
I also found about something called the www.prorealcode.com another user had created for Pinescript.
I really liked that script so I adapted it to do the same kind of signal printing for circles and squares (crosses and series)
Check it out tell me what you think and how I can make it better for everyone!
thanks all!
Snoop

ChaosThis script adds a Bill Williams Alligator to your charts and the three wisemen:
1. Wiseman 1 - Bullish or bearish divergent bars shown with a circle (be sure to check angulation manually).
2. Wiseman 2 - Super AO - with a square.
3 Wiseman 3 - Fractal with a triangle.
Be sure to wait until the current bar is closed before using these signals.
Reference: TradingChaos Version 2

[RS]Temporal Fractal Flow Study V1EXPERIMENTAL: Study on Fractal Price Flow.
UPDATE: Cleaned up, added optional time frames(all), will need to go into options for setup, all settings are off by default.

[RS]Fractal Levels V1EXPERIMENTAL: update to previous version, added a average of the fractal levels and the ability to hide the diferent components.

ADXcellenceThis advanced trading indicator, inspired by Dr. Charles B. Schaap's book "ADXcellence: Power Trend Strategies", leverages the principles of the Average Directional Index (ADX) to help traders identify and exploit trending conditions in the market.
The ADXcellence Indicator uses multiple levels of analysis to evaluate the strength and direction of trends.
In addition to the classic ADX+DMI input settings, these features are included:
ADX Slope Signal: This parameter, controls the sensitivity of the ADX slope, which will indicate when the trend strength is increasing or decreasing.
The indicator provides three trend levels: strong trend level, trending level, and low volatility level, which can be customized to suit various trading strategies.
The color gradients for the ADX, DI+, and DI- lines are designed to visually represent the trend strength from the low volatility level to the strong trend level. The indicator also uses a dynamic background color, highlighting the periods when the ADX is rising. The color will vary depending on the dominant DI.
The ADXcellence Indicator also offers a unique feature of dynamically adjusting the fill between DI+ and DI-, with the color and fill intensity changing based on the relative value of the two.
This indicator is a powerful tool for traders who use trend-following strategies and is best used in conjunction with other technical analysis tools to confirm signals and avoid potential false signals.
Remember, no indicator is perfect and every trading strategy should include risk management and proper due diligence.
Enjoy :)

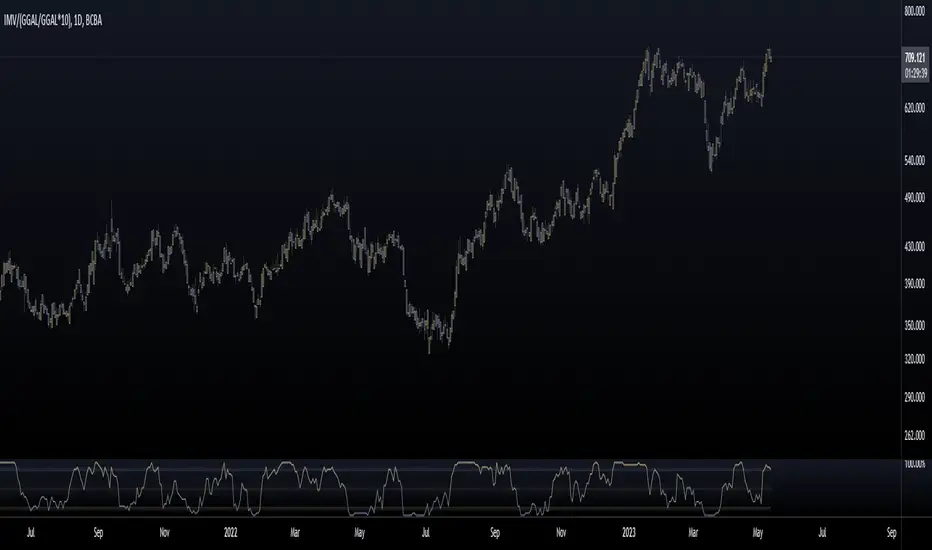
Mervaleta BreadthFellow Merval investors/traders , I'm sharing this script with you that allows you to calculate a breadth indicator using the components of the Merval Index (IMV) from Argentina.
This breadth indicator shows the percentage of stocks that are above a moving average. In this case, you can choose between an EMA or SMA, and you can select the period of the moving average.
The components that make up the index and were used for this script are as follows:
AGRO
ALUA
BBAR
BMA
BYMA
CEPU
COME
CRES
CVH
EDN
GGAL
HARG
LOMA
MIRG
PAMP
SUPV
TECO2
TGNO4
TGSU2
TRAN
TXAR
VALO
YPFD
For all of them, their dollar value in CCL was used, calculated with GGAL.
Enjoy :)
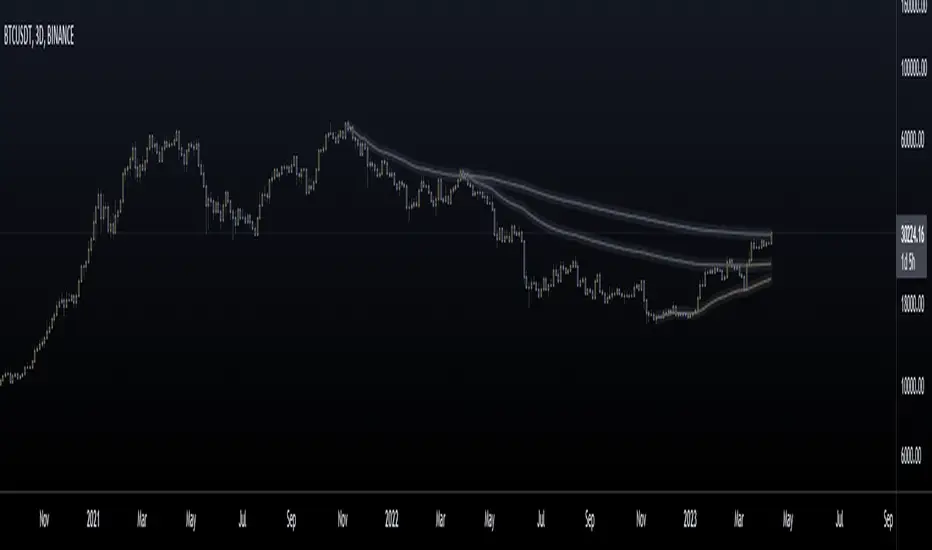
Anchored Moving Averages - InteractiveWhat is an Anchored Moving Average?
An anchored moving average (AMA) is created when you select a point on the chart and start calculating the moving average from there.
Thus the moving average’s denominator is not fixed but cumulative and dynamic. It is similar to an Anchored VWAP, but neglecting the volume data, which may be useful when this data is not reliable and you want to focus just on price.
Main Features
This interactive indicator allows you to select 3 different points in time to plot their respective moving averages. As soon as you add the indicator to your chart you will be asked to click on the 3 different points where you want to start the calculation for each moving average.
Each AMA (Anchored Moving Average) will be colored according to its slope, using a gradient defined by two user chosen colors in the indicator menu.
The default source for the calculation is the pivot price (HLC3) but can also be modified in the menu.
Examples:
Enjoy!
Nadaraya-Watson OscillatorThis indicator is based on the work of @jdehorty and his amazing Nadaraya-Watson Kernel Envelope, which you can see here:
General Description
The Nadaraya-Watson Oscillator (NWO) will give the same information as the Nadaraya-Watson Envelope, but as an oscillator off the main chart, by plotting the relationship between price and the Kernel and its bands. This also means that we can now detect divergences between price and the NWO.
You can see the relationship between the two here:
You can think of this indicator as the kernel envelope version of a Bollinger Band %B. In ranging markets the bands are perfect for mean reversion trades, but in certain situations the break of one of the bands can signal the beggining of a strong trend and price will remain close to the bands for a long period and will only give small pullbacks. As with any indicator, confluence with price and other tools must be taken into account.
Main Features
As with @jdehorty 's Envelope, you can change the following settings:
Lookback Window.
Relative Weighting.
The initial bar for the regression.
ATR period for the bands.
Inner and Outer Multiples for the bands.
I also added the following:
A middle band around the Kernel to filter out false crossovers.
A Hull Moving Average to smoothen out the movements of the oscillator and give extra confirmation of turnover points.
Colors
Some special things to note regarding the coloring:
The zero line features a gradient that changes color every time the Kernel slope changes direction.
The Oscillator plot has a gradient coloring that gets stronger the closer it gets to each of the bands.
Every time the oscillator crosses over/under the outer bands the background will be highlighted.
Happy trading!

Up/Down Volume + DeltaThis simple script is a modification of Tradingview's Up/Down Volume. In this case the delta between the buys and sells is plotted in columns style above the regular up/down volume columns. This gives a better visual of the dominant volume and is useful to spot divergences in tops and bottoms.
The indicators uses data from lower timeframe volumes. By default the lowest timeframe it will use is 1m, but for those that have a premium account you can try using a custom LTF set to seconds when scalping on the 1m chart.
Enjoy :)

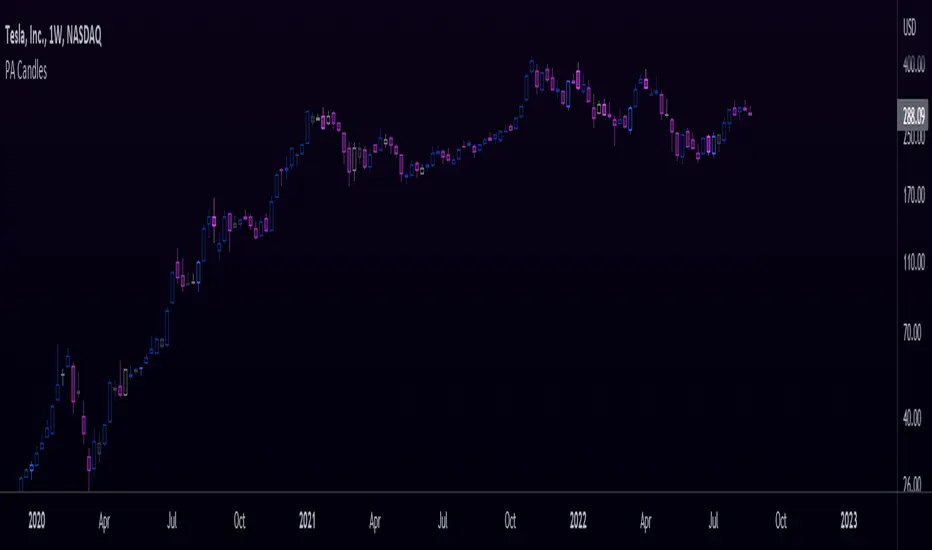
Price Action CandlesThis simple script provides a visual aid for price action traders by coloring outside & inside candles, which in effect leaves the trader with 6 possible candle colors:
-Regular bullish candle
-Outside bullish candle
-Inside bullish candle
-Regular bearish candle
-Outside bearish candle
-Inside bearish candle
These candlesticks may provide powerful signals when used in conjunction with key levels, market structure and chart patterns.
Make sure to disable the regular candlesticks (body, borders and wicks) in the symbol tab inside the configuration menu!
Hope it can help someone!
Hull Volume WavesInspired by the works of David Weis, this indicator is an alternative to his classic Weis Volume Waves.
As the name implies, this indicator uses a Hull Moving Average to detect price swings, and calculates the cumulative volume for each of them, separating the up swings from the down swings.
The chosen length of the HMA determines the size of each swing, meaning lower lengths will detect microswings while higher lengths will only include the main swings.
The length of each swing also determines the color of the upward and downward waves, and you can choose 2 colors each to generate a bullish and bearish gradient.
Extreme values are highlighted in the background. The indicator will compare the current up wave to the last N up volumes, or the current down wave to the last N down volumes. The lookback length can be changed in the menu.
I hope you find it useful!

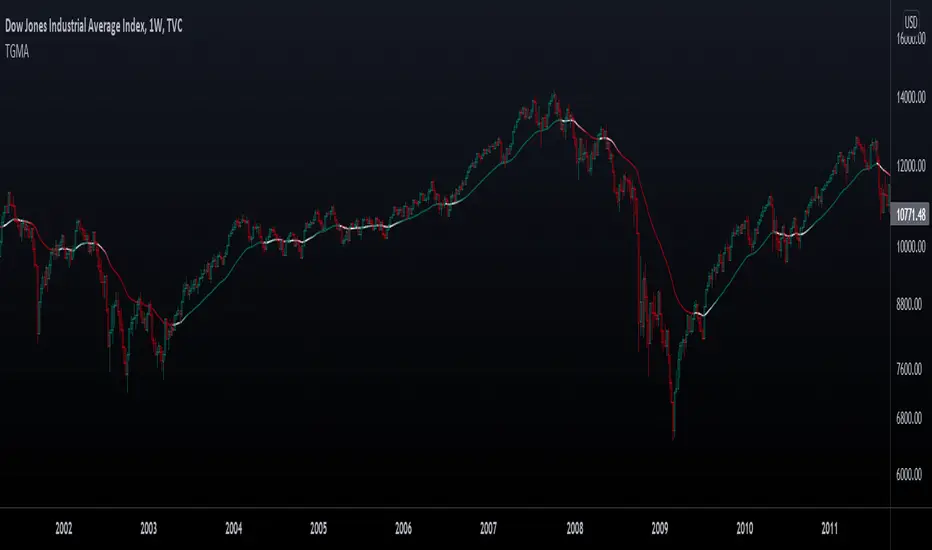
Trend Gradient Moving Average This moving average uses a gradient function which calculates the number of advances/declines of the moving average to change the intensity of the colors, meaning a longer trend in either direction will show a stronger color. You can choose 3 colors to build the gradient: a bullish, bearish & neutral/transition color. The number of steps chosen will change the speed of color change, with a lower number of steps meaning a faster transition and viceversa.
Furthermore, you can choose between many different types of moving averages:
-SMA (Simple Moving Average)
-EMA (Exponential Moving Average)
-RMA (Rolling Moving Average)
-WMA (Weighted Moving Average)
-HMA (Hull Moving Average)
-VWMA (Volume Weighted Moving Average)
-TMA (Triangular Moving Average)
Enjoy!
Williams Accumulation/DistributionThis is an indicator described by Larry Williams in one of his books. Larry won the 1987 World Cup Championship of Futures Trading, where he turned $10,000 to over $1,100,000 in a 12-month competition with real money.
Larry used this indicator to track divergences between price action and volume, which he called patterns of accumulation (bullish divergence) and distribution(bearish divergence). Its logic is similar to On Balance Volume(OBV), where it accumulates up and down volume in a single line, but also takes into account the size of the candle in its calculation, by taking the difference between the open and close, and the high and the low.
Enjoy!