Williams Fractals Tiny IconsA version of Williams Fractals but the script has been altered to make the icons smaller. Use these for trailing stop loss, adding to positions, or entering a position late.
ابحث في النصوص البرمجية عن "Fractal"
FVG / FRACTALS HELPERTG: imjustdanya
Индикатор автоматически находит фракталы/имбалансы на выбранных таймфреймах
Можно настраивать всё,от внешнего вида, до количества отображаемых объектов
Экономит много времени,и очень эффективен при интрадей торговле в стратегии Price Action
The indicator automatically detects fractals and imbalances on selected timeframes.
You can customize everything — from appearance to the number of displayed objects.
It saves a lot of time and is highly effective for intraday trading within a Price Action strategy.

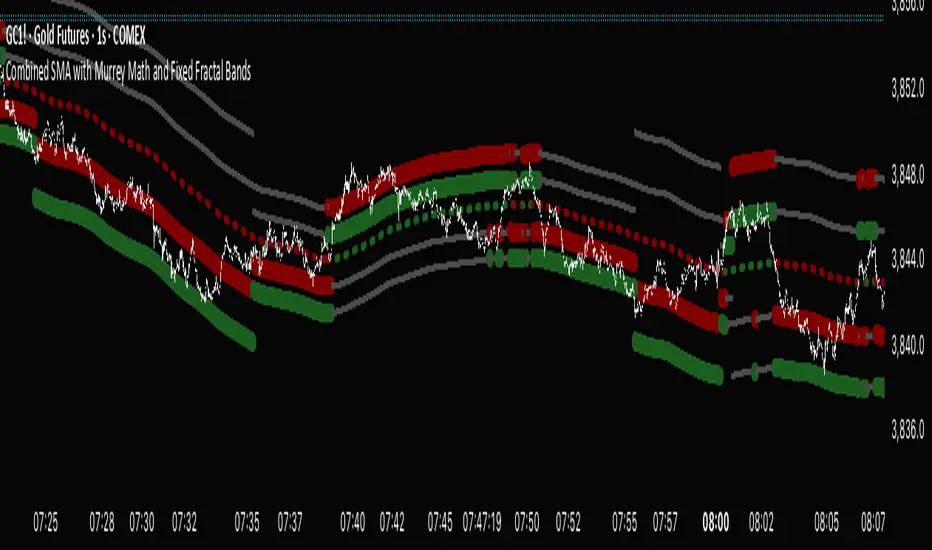
Combined SMA with Murrey Math and Fixed Fractal Bands "Combined SMA with Murrey Math and Fixed Fractal Bands" , overlaying a Simple Moving Average (SMA), Murrey Math (MM) bands, and fixed fractal bands on a price chart. Here's a brief description of its functionality:Inputs:SMA Length: Configurable period for the SMA (default: 180 bars).
Resolution: Optional custom timeframe for data.
Frame Size for MM: Lookback period for Murrey Math calculations (default: 180 bars, adjustable via multiplier).
Ignore Wicks: Option to use open/close prices instead of high/low for MM calculations.
Fixed Fractal Size: Fixed distance in points for fractal bands (default: 1.22).
Shade 3/8-5/8 Overlap: Option to highlight overlapping regions between SMA-centered and absolute MM bands.
Data Source:Uses open, close, high, and low prices from the specified ticker and timeframe.
Optionally ignores wicks (high/low) for MM calculations, using max/min of open/close instead.
SMA Calculation:Computes a Simple Moving Average (SMA) based on the closing price and user-defined length.
Murrey Math Bands:Absolute MM Bands: Calculated using a dynamic range based on the highest/lowest prices over a lookback period, scaled logarithmically to create 13 levels (from -3/8 to +3/8, with 8/8 as the midpoint). These adapt to price action.
SMA-Centered MM Bands: Constructs MM bands relative to the SMA, with levels (0/8 to 8/8) spaced by a calculated increment derived from the absolute MM range.
Colors bands dynamically (green for bullish, red for bearish, gray for neutral) based on changes in the 4/8 level or increment, with labels indicating "Higher," "Lower," or "Same" states.
Fixed Fractal Bands:Plots six fixed-distance bands (±1, ±2, ±3) around the SMA, using a user-defined point value (default: 1.22).
Overlaps and Shading:Detects overlaps between SMA-centered and absolute MM bands at key levels (7/8-8/8, 0/8-1/8, and optionally 3/8-5/8).
Shades overlapping regions with distinct colors (red for 7/8-8/8, green for 0/8-1/8, blue for 3/8-5/8).
Fills specific SMA-centered MM regions (3/8-5/8, 0/8-1/8, 7/8-8/8) for visual emphasis.
Visualization:Plots SMA-centered MM bands, absolute MM bands, and fixed fractal bands as stepped lines with varying colors and transparency.
Displays a table at the bottom-right showing the current MM increment value.
Adds labels when the 4/8 level or increment changes, indicating trend direction.
In summary, this indicator combines a user-defined SMA with Murrey Math bands (both absolute and SMA-centered) and fixed fractal bands to provide a multi-level support/resistance framework. It highlights dynamic price levels, trend direction, and key overlaps, aiding traders in identifying potential reversal or consolidation zones.
Advanced Fractal and Hurst IndicatorAdvanced Fractal and Hurst Indicator (AFHI)
Description:
The Advanced Fractal and Hurst Indicator (AFHI) is a custom technical analysis tool designed to identify market trends and potential reversals by leveraging the concepts of Fractal Dimension and the Hurst Exponent . These advanced mathematical concepts provide insights into the complexity and persistence of price movements, making this indicator a powerful addition to any trader's toolkit.
How It Works:
Fractal Dimension (FD) :
The Fractal Dimension measures the complexity of price movements. A higher Fractal Dimension indicates a more complex, choppy market, while a lower value suggests smoother trends.
The FD is calculated using the log difference of price movements over a specified length.
Hurst Exponent (HE) :
The Hurst Exponent indicates the tendency of a time series to either regress to the mean or cluster in a direction. Values below 0.5 indicate a tendency to revert to the mean (mean-reverting), while values above 0.5 suggest a trending market.
The HE is calculated using the rescaled range method, comparing the range of price movements to the standard deviation.
Composite Indicator :
The Composite Indicator combines the smoothed Fractal Dimension and Hurst Exponent to provide a single value indicating market conditions. This is done by normalizing the FD and HE values and combining them into one metric.
A positive Composite Indicator suggests an uptrend, while a negative value indicates a downtrend.
Smoothing :
Both FD and HE values are smoothed using a simple moving average to reduce noise and provide clearer signals.
Trend Confirmation :
A 50-period moving average (MA) is used to confirm the trend direction. The price being above the MA indicates an uptrend, while below the MA indicates a downtrend.
Background Shading :
The indicator pane is shaded green during uptrend conditions (positive Composite Indicator and price above MA) and red during downtrend conditions (negative Composite Indicator and price below MA).
How Traders Can Use It:
Identifying Trends :
Traders can use the AFHI to identify current market trends. The background shading in the indicator pane provides a visual cue for trend direction, with green indicating an uptrend and red indicating a downtrend.
Trend Confirmation :
The Composite Indicator line, plotted in purple, helps confirm the trend. Positive values suggest a strong uptrend, while negative values indicate a strong downtrend.
Entry and Exit Signals :
Traders can use the transitions of the Composite Indicator and the background shading to time their entry and exit points. For instance, a shift from red to green shading suggests a potential buy opportunity, while a shift from green to red suggests a potential sell opportunity.
Alerts :
The script includes alert conditions that can notify traders when the Composite Indicator signals a new trend direction. Alerts can be set up for both uptrends and downtrends, helping traders stay informed of key market changes.
Strategy Development :
By integrating AFHI into their trading strategies, traders can develop more robust systems that account for market complexity and persistence. The indicator can be used alongside other technical tools to enhance decision-making and improve trade accuracy.

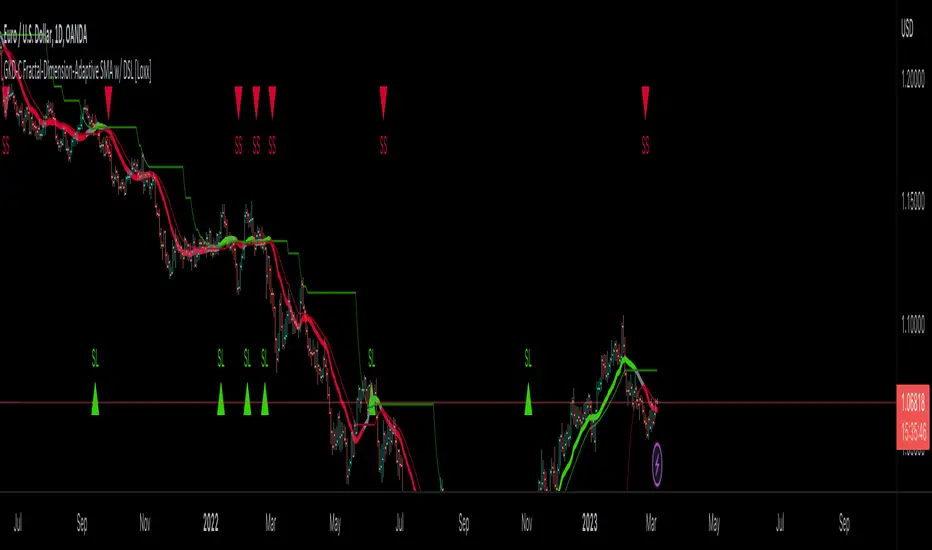
GKD-C Fractal-Dimension-Adaptive SMA w/ DSL [Loxx]Giga Kaleidoscope GKD-C Fractal-Dimension-Adaptive SMA w/ DSL is a Confirmation module included in Loxx's "Giga Kaleidoscope Modularized Trading System".
█ Giga Kaleidoscope Modularized Trading System
What is Loxx's "Giga Kaleidoscope Modularized Trading System"?
The Giga Kaleidoscope Modularized Trading System is a trading system built on the philosophy of the NNFX (No Nonsense Forex) algorithmic trading.
What is the NNFX algorithmic trading strategy?
The NNFX (No-Nonsense Forex) trading system is a comprehensive approach to Forex trading that is designed to simplify the process and remove the confusion and complexity that often surrounds trading. The system was developed by a Forex trader who goes by the pseudonym "VP" and has gained a significant following in the Forex community.
The NNFX trading system is based on a set of rules and guidelines that help traders make objective and informed decisions. These rules cover all aspects of trading, including market analysis, trade entry, stop loss placement, and trade management.
Here are the main components of the NNFX trading system:
1. Trading Philosophy: The NNFX trading system is based on the idea that successful trading requires a comprehensive understanding of the market, objective analysis, and strict risk management. The system aims to remove subjective elements from trading and focuses on objective rules and guidelines.
2. Technical Analysis: The NNFX trading system relies heavily on technical analysis and uses a range of indicators to identify high-probability trading opportunities. The system uses a combination of trend-following and mean-reverting strategies to identify trades.
3. Market Structure: The NNFX trading system emphasizes the importance of understanding the market structure, including price action, support and resistance levels, and market cycles. The system uses a range of tools to identify the market structure, including trend lines, channels, and moving averages.
4. Trade Entry: The NNFX trading system has strict rules for trade entry. The system uses a combination of technical indicators to identify high-probability trades, and traders must meet specific criteria to enter a trade.
5. Stop Loss Placement: The NNFX trading system places a significant emphasis on risk management and requires traders to place a stop loss order on every trade. The system uses a combination of technical analysis and market structure to determine the appropriate stop loss level.
6. Trade Management: The NNFX trading system has specific rules for managing open trades. The system aims to minimize risk and maximize profit by using a combination of trailing stops, take profit levels, and position sizing.
Overall, the NNFX trading system is designed to be a straightforward and easy-to-follow approach to Forex trading that can be applied by traders of all skill levels.
Core components of an NNFX algorithmic trading strategy
The NNFX algorithm is built on the principles of trend, momentum, and volatility. There are six core components in the NNFX trading algorithm:
1. Volatility - price volatility; e.g., Average True Range, True Range Double, Close-to-Close, etc.
2. Baseline - a moving average to identify price trend
3. Confirmation 1 - a technical indicator used to identify trends
4. Confirmation 2 - a technical indicator used to identify trends
5. Continuation - a technical indicator used to identify trends
6. Volatility/Volume - a technical indicator used to identify volatility/volume breakouts/breakdown
7. Exit - a technical indicator used to determine when a trend is exhausted
What is Volatility in the NNFX trading system?
In the NNFX (No Nonsense Forex) trading system, ATR (Average True Range) is typically used to measure the volatility of an asset. It is used as a part of the system to help determine the appropriate stop loss and take profit levels for a trade. ATR is calculated by taking the average of the true range values over a specified period.
True range is calculated as the maximum of the following values:
-Current high minus the current low
-Absolute value of the current high minus the previous close
-Absolute value of the current low minus the previous close
ATR is a dynamic indicator that changes with changes in volatility. As volatility increases, the value of ATR increases, and as volatility decreases, the value of ATR decreases. By using ATR in NNFX system, traders can adjust their stop loss and take profit levels according to the volatility of the asset being traded. This helps to ensure that the trade is given enough room to move, while also minimizing potential losses.
Other types of volatility include True Range Double (TRD), Close-to-Close, and Garman-Klass
What is a Baseline indicator?
The baseline is essentially a moving average, and is used to determine the overall direction of the market.
The baseline in the NNFX system is used to filter out trades that are not in line with the long-term trend of the market. The baseline is plotted on the chart along with other indicators, such as the Moving Average (MA), the Relative Strength Index (RSI), and the Average True Range (ATR).
Trades are only taken when the price is in the same direction as the baseline. For example, if the baseline is sloping upwards, only long trades are taken, and if the baseline is sloping downwards, only short trades are taken. This approach helps to ensure that trades are in line with the overall trend of the market, and reduces the risk of entering trades that are likely to fail.
By using a baseline in the NNFX system, traders can have a clear reference point for determining the overall trend of the market, and can make more informed trading decisions. The baseline helps to filter out noise and false signals, and ensures that trades are taken in the direction of the long-term trend.
What is a Confirmation indicator?
Confirmation indicators are technical indicators that are used to confirm the signals generated by primary indicators. Primary indicators are the core indicators used in the NNFX system, such as the Average True Range (ATR), the Moving Average (MA), and the Relative Strength Index (RSI).
The purpose of the confirmation indicators is to reduce false signals and improve the accuracy of the trading system. They are designed to confirm the signals generated by the primary indicators by providing additional information about the strength and direction of the trend.
Some examples of confirmation indicators that may be used in the NNFX system include the Bollinger Bands, the MACD (Moving Average Convergence Divergence), and the Stochastic Oscillator. These indicators can provide information about the volatility, momentum, and trend strength of the market, and can be used to confirm the signals generated by the primary indicators.
In the NNFX system, confirmation indicators are used in combination with primary indicators and other filters to create a trading system that is robust and reliable. By using multiple indicators to confirm trading signals, the system aims to reduce the risk of false signals and improve the overall profitability of the trades.
What is a Continuation indicator?
In the NNFX (No Nonsense Forex) trading system, a continuation indicator is a technical indicator that is used to confirm a current trend and predict that the trend is likely to continue in the same direction. A continuation indicator is typically used in conjunction with other indicators in the system, such as a baseline indicator, to provide a comprehensive trading strategy.
What is a Volatility/Volume indicator?
Volume indicators, such as the On Balance Volume (OBV), the Chaikin Money Flow (CMF), or the Volume Price Trend (VPT), are used to measure the amount of buying and selling activity in a market. They are based on the trading volume of the market, and can provide information about the strength of the trend. In the NNFX system, volume indicators are used to confirm trading signals generated by the Moving Average and the Relative Strength Index. Volatility indicators include Average Direction Index, Waddah Attar, and Volatility Ratio. In the NNFX trading system, volatility is a proxy for volume and vice versa.
By using volume indicators as confirmation tools, the NNFX trading system aims to reduce the risk of false signals and improve the overall profitability of trades. These indicators can provide additional information about the market that is not captured by the primary indicators, and can help traders to make more informed trading decisions. In addition, volume indicators can be used to identify potential changes in market trends and to confirm the strength of price movements.
What is an Exit indicator?
The exit indicator is used in conjunction with other indicators in the system, such as the Moving Average (MA), the Relative Strength Index (RSI), and the Average True Range (ATR), to provide a comprehensive trading strategy.
The exit indicator in the NNFX system can be any technical indicator that is deemed effective at identifying optimal exit points. Examples of exit indicators that are commonly used include the Parabolic SAR, the Average Directional Index (ADX), and the Chandelier Exit.
The purpose of the exit indicator is to identify when a trend is likely to reverse or when the market conditions have changed, signaling the need to exit a trade. By using an exit indicator, traders can manage their risk and prevent significant losses.
In the NNFX system, the exit indicator is used in conjunction with a stop loss and a take profit order to maximize profits and minimize losses. The stop loss order is used to limit the amount of loss that can be incurred if the trade goes against the trader, while the take profit order is used to lock in profits when the trade is moving in the trader's favor.
Overall, the use of an exit indicator in the NNFX trading system is an important component of a comprehensive trading strategy. It allows traders to manage their risk effectively and improve the profitability of their trades by exiting at the right time.
How does Loxx's GKD (Giga Kaleidoscope Modularized Trading System) implement the NNFX algorithm outlined above?
Loxx's GKD v1.0 system has five types of modules (indicators/strategies). These modules are:
1. GKD-BT - Backtesting module (Volatility, Number 1 in the NNFX algorithm)
2. GKD-B - Baseline module (Baseline and Volatility/Volume, Numbers 1 and 2 in the NNFX algorithm)
3. GKD-C - Confirmation 1/2 and Continuation module (Confirmation 1/2 and Continuation, Numbers 3, 4, and 5 in the NNFX algorithm)
4. GKD-V - Volatility/Volume module (Confirmation 1/2, Number 6 in the NNFX algorithm)
5. GKD-E - Exit module (Exit, Number 7 in the NNFX algorithm)
(additional module types will added in future releases)
Each module interacts with every module by passing data between modules. Data is passed between each module as described below:
GKD-B => GKD-V => GKD-C(1) => GKD-C(2) => GKD-C(Continuation) => GKD-E => GKD-BT
That is, the Baseline indicator passes its data to Volatility/Volume. The Volatility/Volume indicator passes its values to the Confirmation 1 indicator. The Confirmation 1 indicator passes its values to the Confirmation 2 indicator. The Confirmation 2 indicator passes its values to the Continuation indicator. The Continuation indicator passes its values to the Exit indicator, and finally, the Exit indicator passes its values to the Backtest strategy.
This chaining of indicators requires that each module conform to Loxx's GKD protocol, therefore allowing for the testing of every possible combination of technical indicators that make up the six components of the NNFX algorithm.
What does the application of the GKD trading system look like?
Example trading system:
Backtest: Strategy with 1-3 take profits, trailing stop loss, multiple types of PnL volatility, and 2 backtesting styles
Baseline: Hull Moving Average
Volatility/Volume: Jurik DMX
Confirmation 1: GKD-V Fractal-Dimension-Adaptive SMA w/ DSL as shown on the chart above
Confirmation 2: Williams Percent Range
Continuation: Fisher Transform
Exit: Rex Oscillator
Each GKD indicator is denoted with a module identifier of either: GKD-BT, GKD-B, GKD-C, GKD-V, or GKD-E. This allows traders to understand to which module each indicator belongs and where each indicator fits into the GKD protocol chain.
Giga Kaleidoscope Modularized Trading System Signals (based on the NNFX algorithm)
Standard Entry
1. GKD-C Confirmation 1 Signal
2. GKD-B Baseline agrees
3. Price is within a range of 0.2x Volatility and 1.0x Volatility of the Goldie Locks Mean
4. GKD-C Confirmation 2 agrees
5. GKD-V Volatility/Volume agrees
Baseline Entry
1. GKD-B Baseline signal
2. GKD-C Confirmation 1 agrees
3. Price is within a range of 0.2x Volatility and 1.0x Volatility of the Goldie Locks Mean
4. GKD-C Confirmation 2 agrees
5. GKD-V Volatility/Volume agrees
6. GKD-C Confirmation 1 signal was less than 7 candles prior
Continuation Entry
1. Standard Entry, Baseline Entry, or Pullback; entry triggered previously
2. GKD-B Baseline hasn't crossed since entry signal trigger
3. GKD-C Confirmation Continuation Indicator signals
4. GKD-C Confirmation 1 agrees
5. GKD-B Baseline agrees
6. GKD-C Confirmation 2 agrees
1-Candle Rule Standard Entry
1. GKD-C Confirmation 1 signal
2. GKD-B Baseline agrees
3. Price is within a range of 0.2x Volatility and 1.0x Volatility of the Goldie Locks Mean
Next Candle:
1. Price retraced (Long: close < close or Short: close > close )
2. GKD-B Baseline agrees
3. GKD-C Confirmation 1 agrees
4. GKD-C Confirmation 2 agrees
5. GKD-V Volatility/Volume agrees
1-Candle Rule Baseline Entry
1. GKD-B Baseline signal
2. GKD-C Confirmation 1 agrees
3. Price is within a range of 0.2x Volatility and 1.0x Volatility of the Goldie Locks Mean
4. GKD-C Confirmation 1 signal was less than 7 candles prior
Next Candle:
1. Price retraced (Long: close < close or Short: close > close )
2. GKD-B Baseline agrees
3. GKD-C Confirmation 1 agrees
4. GKD-C Confirmation 2 agrees
5. GKD-V Volatility/Volume Agrees
PullBack Entry
1. GKD-B Baseline signal
2. GKD-C Confirmation 1 agrees
3. Price is beyond 1.0x Volatility of Baseline
Next Candle:
1. Price is within a range of 0.2x Volatility and 1.0x Volatility of the Goldie Locks Mean
3. GKD-C Confirmation 1 agrees
4. GKD-C Confirmation 2 agrees
5. GKD-V Volatility/Volume Agrees
█ GKD-V Fractal-Dimension-Adaptive SMA w/ DSL
Fractal-Dimension-Adaptive SMA (FDASMA) w/ DSL is a fractal-dimension-index-adaptive SMA . The SMA is accelerated during a trend and slowed down during a sideways market, so as to avoid false signals. This indicator uses the fractal dimension to compute an ingest period length into the SMA to output the FDASMA.
What is the Fractal Dimension Index?
The goal of the fractal dimension index is to determine whether the market is trending or in a trading range. It does not measure the direction of the trend. A value less than 1.5 indicates that the price series is persistent or that the market is trending. Lower values of the FDI indicate a stronger trend. A value greater than 1.5 indicates that the market is in a trading range and is acting in a more random fashion.
What are DSL Discontinued Signal Line?
A lot of indicators are using signal lines in order to determine the trend (or some desired state of the indicator) easier. The idea of the signal line is easy : comparing the value to it's smoothed (slightly lagging) state, the idea of current momentum/state is made.
Discontinued signal line is inheriting that simple signal line idea and it is extending it : instead of having one signal line, more lines depending on the current value of the indicator.
"Signal" line is calculated the following way :
When a certain level is crossed into the desired direction, the EMA of that value is calculated for the desired signal line
When that level is crossed into the opposite direction, the previous "signal" line value is simply "inherited" and it becomes a kind of a level
This way it becomes a combination of signal lines and levels that are trying to combine both the good from both methods.
In simple terms, DSL uses the concept of a signal line and betters it by inheriting the previous signal line's value & makes it a level.
Requirements
Inputs
Confirmation 1 and Solo Confirmation: GKD-V Volatility / Volume indicator
Confirmation 2: GKD-C Confirmation indicator
Outputs
Confirmation 2 and Solo Confirmation Complex: GKD-E Exit indicator
Confirmation 1: GKD-C Confirmation indicator
Continuation: GKD-E Exit indicator
Solo Confirmation Simple: GKD-BT Backtest strategy
Additional features will be added in future releases.
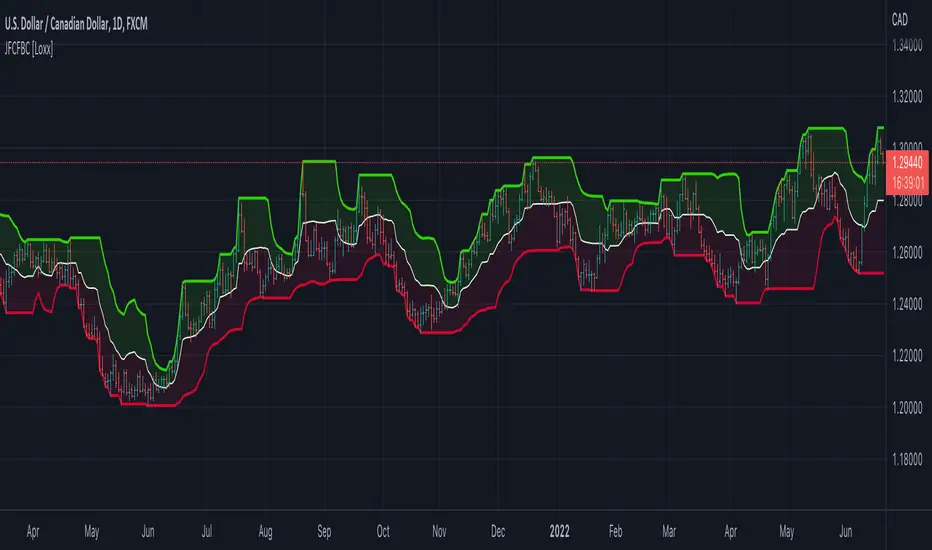
Jurik Filtered, Composite Fractal Behavior (CFB) Channels [Loxx]Double Jurik-Filtered Composite Fractal Behavior (CFB) Channels is a channel indicator that acts as both a baseline, similar to Donchian, and as support and resistance levels. This indicator is price time adaptive meaning it flexes to price volatility waves. The indicators adaptive nature is calculated using the Composite Fractal Behavior (CFB) algorithm. The result of this adaptive calculation is then smoothed using Jurik Filtering, and then it's normalized to conform to a range of values. This helps better identify trends.
What is Composite Fractal Behavior (CFB)?
All around you mechanisms adjust themselves to their environment. From simple thermostats that react to air temperature to computer chips in modern cars that respond to changes in engine temperature, r.p.m.'s, torque, and throttle position. It was only a matter of time before fast desktop computers applied the mathematics of self-adjustment to systems that trade the financial markets.
Unlike basic systems with fixed formulas, an adaptive system adjusts its own equations. For example, start with a basic channel breakout system that uses the highest closing price of the last N bars as a threshold for detecting breakouts on the up side. An adaptive and improved version of this system would adjust N according to market conditions, such as momentum, price volatility or acceleration.
Since many systems are based directly or indirectly on cycles, another useful measure of market condition is the periodic length of a price chart's dominant cycle, (DC), that cycle with the greatest influence on price action.
The utility of this new DC measure was noted by author Murray Ruggiero in the January '96 issue of Futures Magazine. In it. Mr. Ruggiero used it to adaptive adjust the value of N in a channel breakout system. He then simulated trading 15 years of D-Mark futures in order to compare its performance to a similar system that had a fixed optimal value of N. The adaptive version produced 20% more profit!
This DC index utilized the popular MESA algorithm (a formulation by John Ehlers adapted from Burg's maximum entropy algorithm, MEM). Unfortunately, the DC approach is problematic when the market has no real dominant cycle momentum, because the mathematics will produce a value whether or not one actually exists! Therefore, we developed a proprietary indicator that does not presuppose the presence of market cycles. It's called CFB (Composite Fractal Behavior) and it works well whether or not the market is cyclic.
CFB examines price action for a particular fractal pattern, categorizes them by size, and then outputs a composite fractal size index. This index is smooth, timely and accurate
Essentially, CFB reveals the length of the market's trending action time frame. Long trending activity produces a large CFB index and short choppy action produces a small index value. Investors have found many applications for CFB which involve scaling other existing technical indicators adaptively, on a bar-to-bar basis.
What is Jurik Volty used in the Juirk Filter?
One of the lesser known qualities of Juirk smoothing is that the Jurik smoothing process is adaptive. "Jurik Volty" (a sort of market volatility ) is what makes Jurik smoothing adaptive. The Jurik Volty calculation can be used as both a standalone indicator and to smooth other indicators that you wish to make adaptive.
What is the Jurik Moving Average?
Have you noticed how moving averages add some lag (delay) to your signals? ... especially when price gaps up or down in a big move, and you are waiting for your moving average to catch up? Wait no more! JMA eliminates this problem forever and gives you the best of both worlds: low lag and smooth lines.
Ideally, you would like a filtered signal to be both smooth and lag-free. Lag causes delays in your trades, and increasing lag in your indicators typically result in lower profits. In other words, late comers get what's left on the table after the feast has already begun.
Jurik Composite Fractal Behavior (CFB) on EMA [Loxx]Jurik Composite Fractal Behavior (CFB) on EMA is an exponential moving average with adaptive price trend duration inputs. This purpose of this indicator is to introduce the formulas for the calculation Composite Fractal Behavior. As you can see from the chart above, price reacts wildly to shifts in volatility--smoothing out substantially while riding a volatility wave and cutting sharp corners when volatility drops. Notice the chop zone on BTC around August 2021, this was a time of extremely low relative volatility.
This indicator uses three previous indicators from my public scripts. These are:
JCFBaux Volatility
Jurik Filter
Jurik Volty
The CFB is also related to the following indicator
Jurik Velocity ("smoother moment")
Now let's dive in...
What is Composite Fractal Behavior (CFB)?
All around you mechanisms adjust themselves to their environment. From simple thermostats that react to air temperature to computer chips in modern cars that respond to changes in engine temperature, r.p.m.'s, torque, and throttle position. It was only a matter of time before fast desktop computers applied the mathematics of self-adjustment to systems that trade the financial markets.
Unlike basic systems with fixed formulas, an adaptive system adjusts its own equations. For example, start with a basic channel breakout system that uses the highest closing price of the last N bars as a threshold for detecting breakouts on the up side. An adaptive and improved version of this system would adjust N according to market conditions, such as momentum, price volatility or acceleration.
Since many systems are based directly or indirectly on cycles, another useful measure of market condition is the periodic length of a price chart's dominant cycle, (DC), that cycle with the greatest influence on price action.
The utility of this new DC measure was noted by author Murray Ruggiero in the January '96 issue of Futures Magazine. In it. Mr. Ruggiero used it to adaptive adjust the value of N in a channel breakout system. He then simulated trading 15 years of D-Mark futures in order to compare its performance to a similar system that had a fixed optimal value of N. The adaptive version produced 20% more profit!
This DC index utilized the popular MESA algorithm (a formulation by John Ehlers adapted from Burg's maximum entropy algorithm, MEM). Unfortunately, the DC approach is problematic when the market has no real dominant cycle momentum, because the mathematics will produce a value whether or not one actually exists! Therefore, we developed a proprietary indicator that does not presuppose the presence of market cycles. It's called CFB (Composite Fractal Behavior) and it works well whether or not the market is cyclic.
CFB examines price action for a particular fractal pattern, categorizes them by size, and then outputs a composite fractal size index. This index is smooth, timely and accurate
Essentially, CFB reveals the length of the market's trending action time frame. Long trending activity produces a large CFB index and short choppy action produces a small index value. Investors have found many applications for CFB which involve scaling other existing technical indicators adaptively, on a bar-to-bar basis.
What is Jurik Volty used in the Juirk Filter?
One of the lesser known qualities of Juirk smoothing is that the Jurik smoothing process is adaptive. "Jurik Volty" (a sort of market volatility ) is what makes Jurik smoothing adaptive. The Jurik Volty calculation can be used as both a standalone indicator and to smooth other indicators that you wish to make adaptive.
What is the Jurik Moving Average?
Have you noticed how moving averages add some lag (delay) to your signals? ... especially when price gaps up or down in a big move, and you are waiting for your moving average to catch up? Wait no more! JMA eliminates this problem forever and gives you the best of both worlds: low lag and smooth lines.
Ideally, you would like a filtered signal to be both smooth and lag-free. Lag causes delays in your trades, and increasing lag in your indicators typically result in lower profits. In other words, late comers get what's left on the table after the feast has already begun.
Modifications and improvements
1. Jurik's original calculation for CFB only allowed for depth lengths of 24, 48, 96, and 192. For theoretical purposes, this indicator allows for up to 20 different depth inputs to sample volatility. These depth lengths are
2, 3, 4, 6, 8, 12, 16, 24, 32, 48, 64, 96, 128, 192, 256, 384, 512, 768, 1024, 1536
Including these additional length inputs is arguable useless, but they are are included for completeness of the algorithm.
2. The result of the CFB calculation is forced to be an integer greater than or equal to 1.
3. The result of the CFB calculation is double filtered using an advanced, (and adaptive itself) filtering algorithm called the Jurik Filter. This filter and accompanying internal algorithm are discussed above.

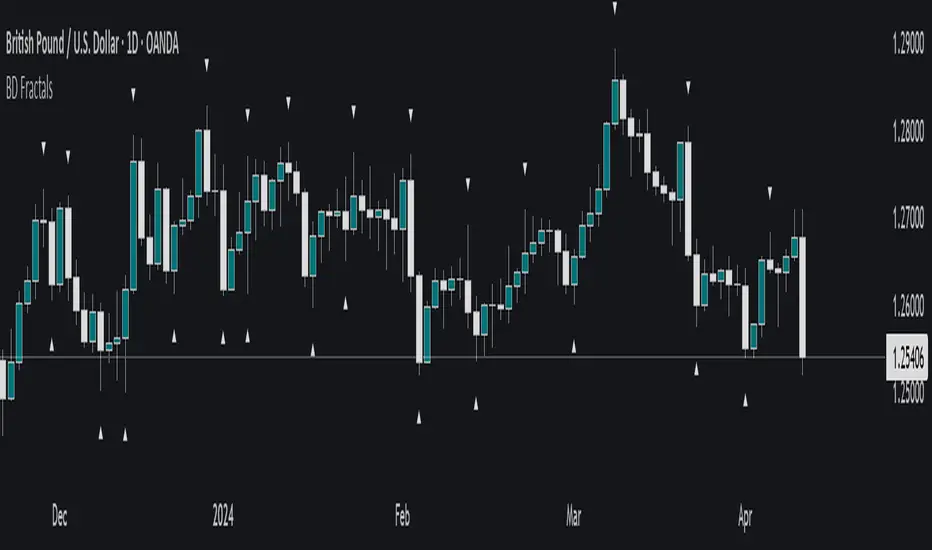
Williams Fractals - LH/HLSame of original Williams Fractals, but with the following changes
- changed arrow directions
- added option to show Lower Highs and Higher Lows
- added alerts for Lower High and Higher Low
Enjoy~~

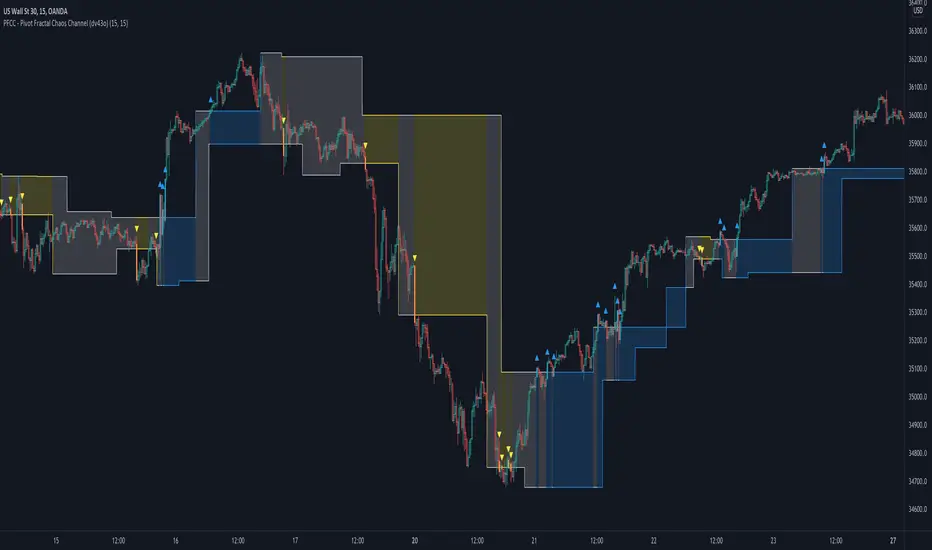
PFCC - Pivot Fractal Chaos Channel [Open Source]With the release of my indicator "TOTC - Trade outside the Channel" , the Pivot Fractal Chaos Channel used there has attracted significant interest.
Due to requests from some users, I am happy to publish the source code of the PFCC - although it is not "new" and has been implemented in many other scripts in one way or another. Some Examples:
Support and Resistance Levels with Breaks:
Support Resistance MTF:
Pivot Points High Low (HH/HL/LH/LL):
The code is briefly commented. Please feel free to use or further customize it ... And, of course, I would be happy to be named and/or linked. If you're satisfied, maybe buy me a coffee ;-)
I'm curious to see how this indicator will develop with more ideas - Please keep me updated by commenting below or by sending me a message.
Let's take a quick look at the function and idea
PFCC - "Pivot Fractal Chaos Channel" or also known as "Fractal Chaos Band" can serve as a baseline trend indicator for your strategy.
Essentially, the "Fractal Chaos Channel" shows an overall panorama of price action. As they filter out the insignificant price fluctuations. The upper level is created by drawing price highs and the lower level is created by drawing price lows.
Two Ideas, how this indicator can be used
Trend indicator: If the price breaks the upper line, it could be taken as a buy signal. If the price breaks the lower line, it could be taken as a sell signal.
Trailing Stop Loss: You can track the stop loss with the rising line in case of a buy trade. On the other hand, you can track the stop loss with the falling fractal line in case of a sell trade.
What do I need to consider?
It may be advisable to add further indicators and an analysis of the market structure in order to confirm the signals issued by the indicator. Please note that when you make adjustments to any strategy, you always carry out particularly detailed tests.
You would like to use this indicator, but you have adjustment requests, you want to have additional filters or features implemented, ...?
I am happy to create individual indicators based on "PFCC - Pivot Fractal Chaos Channel" or your ideas. Write me a message and we will discuss the details and conditions.
Combo Strategy 123 Reversal & Fractal Chaos Bands This is combo strategies for get a cumulative signal.
First strategy
This System was created from the Book "How I Tripled My Money In The
Futures Market" by Ulf Jensen, Page 183. This is reverse type of strategies.
The strategy buys at market, if close price is higher than the previous close
during 2 days and the meaning of 9-days Stochastic Slow Oscillator is lower than 50.
The strategy sells at market, if close price is lower than the previous close price
during 2 days and the meaning of 9-days Stochastic Fast Oscillator is higher than 50.
Second strategy
Stock market moves in a highly chaotic way, but at a larger scale, the movements
follow a certain pattern that can be applied to shorter or longer periods of time
and we can use Fractal Chaos Bands Indicator to identify those patterns. Basically,
the Fractal Chaos Bands Indicator helps us to identify whether the stock market is
trending or not. When a market is trending, the bands will have a slope and if market
is not trending the bands will flatten out. As the slope of the bands decreases, it
signifies that the market is choppy, insecure and variable. As the graph becomes more
and more abrupt, be it going up or down, the significance is that the market becomes
trendy, or stable. Fractal Chaos Bands Indicator is used similarly to other bands-indicator
(Bollinger bands for instance), offering trading opportunities when price moves above or
under the fractal lines.
The FCB indicator looks back in time depending on the number of time periods trader selected
to plot the indicator. The upper fractal line is made by plotting stock price highs and the
lower fractal line is made by plotting stock price lows. Essentially, the Fractal Chaos Bands
show an overall panorama of the price movement, as they filter out the insignificant fluctuations
of the stock price.
WARNING:
- For purpose educate only
- This script to change bars colors.

Williams Fractals, A simpler scriptA simpler script to filter fractals and support large range parameter.

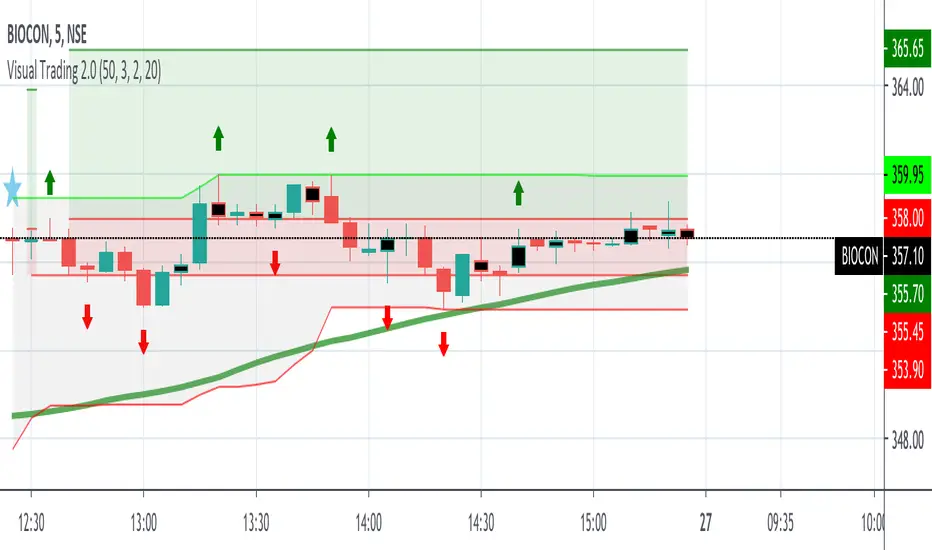
VT SMA 50 DC with FractalsBuying or Selling levels are identified with SMA 50 along with Fractals for breakouts and reversals.
SMA will be green when the trend is Bullish
SMA will be red when the trend is Bearish
The color is set GREEN and RED for Bullish and Bearish trend

Super trend fractalsThanks to just uncle for his script
So I took the super trend VPT and hybrid it with just uncle fractals system of RSI , seems nice

Hakimi - Multiple Time-Price Fractals This indicator displays the time-price fractals in four layers. In this indicator:
• The intersection of lines is important.
• The time of color change is important.
• Start points of new bubbles indicate the start of a new price cycle.
How to use:
1- Select the arbitrary chart (Candles, Heikin Ashi, Line and Renko) and time frame.
2. Set the “Depth”, “Offset” and “Time Coefficients 1 to 3” values. Default values for 1H time frame are 4, 8, and 24 respectively.

STPatterns fractalsModified fractals using 1 candle on both side as mentioned by the strategies from stpatterns.com

Pretty Williams FractalsThis script adds Williams Fractals that are more visually pleasing than TradingView's built-in version.

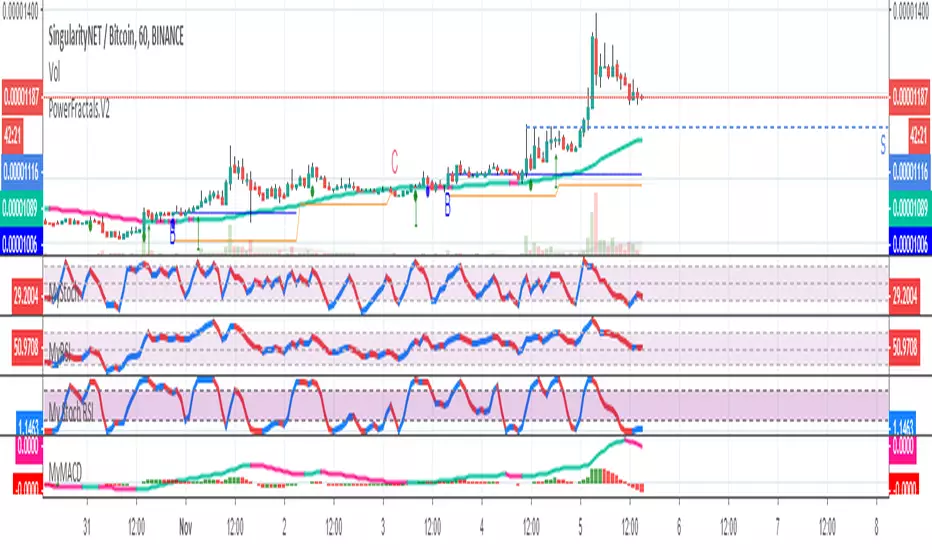
Power FractalsThis script is using fractals and other indicators/formulas to find long entries and exits.
It works best for volatile markets but I found it can work sometimes in ranging markets as well.
Don't take signals against the major trend as it also prints buy entries in bear markets (that are invalidated afterwards)

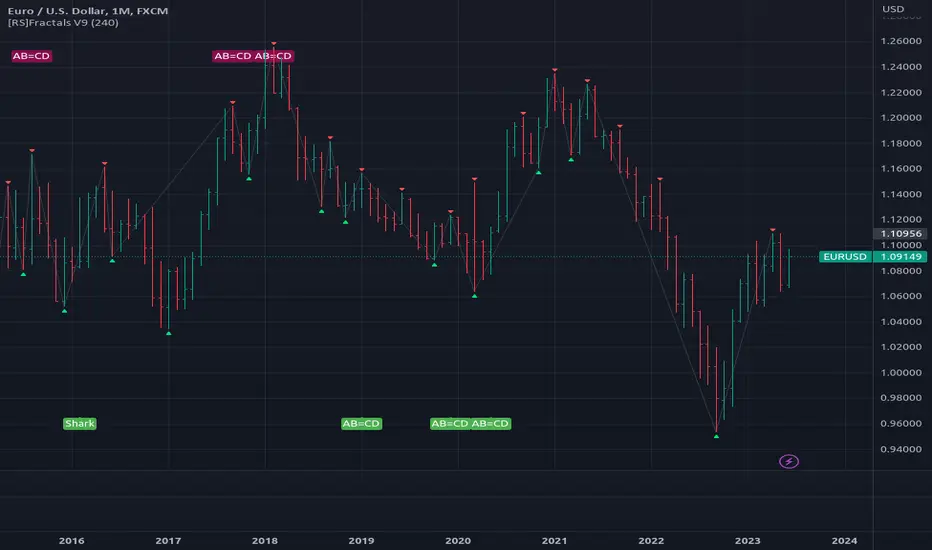
[RS]Fractals V9update: added optional option for marking the fractals with bgcolor (request for: faizal.mansor.908)
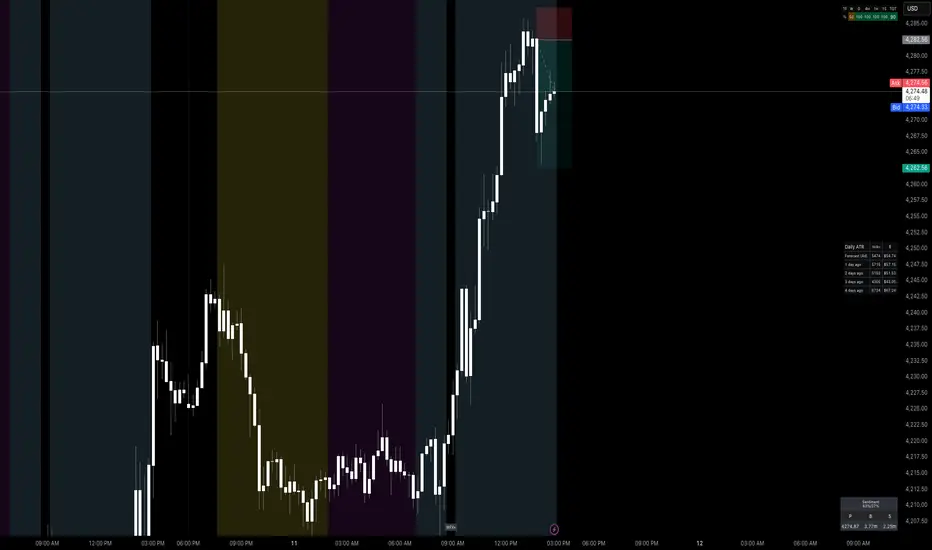
Worstfx Fractal Sessions 🧩 Worstfx Fractal Sessions Public — Features & Purpose
✔️ Includes clean session structure • Simple confluence • Built-in guardrails for your psychology
Worstfx Fractal Sessions Public is a stripped-back, clean version of the full Worstfx framework.
It’s designed to give every trader the core advantages of the fractal system:
• clear session structure
• simple trend/confluence read
• context from Daily ATR
• basic order-flow sentiment
• an on-chart help panel so nobody gets lost
All without overwhelming settings or “indicator soup.”
Use it to see the day as a story: Asia range → London expansion → Pre-NY setup → NY confirmation or reversal.
⸻
⚙️ Main Features
1️⃣ Session Shading (Asia / London / Pre NY / NY)
What it does
• Colors each session with soft, transparent shading:
• Asia – yellow tone
• London – purple tone
• Pre NY – light blue
• NY – light blue (separate time block)
• You can customize the session times and colors.
• Includes a 6:00 pm ET divider line to mark the start of a new “trading day” in your framework.
Why it matters (psychology)
• Your brain stops seeing random candles and starts seeing chapters:
• Asia = range / setup
• London = expansion / fakeouts
• NY = continuation / reversal
• This reduces FOMO and impulsive entries because you naturally ask:
“Which session am I in?”
“What is this session supposed to be doing?”
• The 6pm divider helps you mentally reset each day instead of carrying emotional baggage from yesterday into today.
⸻
2️⃣ Time-Frame Confluence Panel (Weekly → 15m)
What it does
• Checks a simple model on multiple timeframes (W, D, 4H, 1H, 15m):
• Above or below the 50 EMA
• RSI above or below 50
• Converts that into a 0–100% confluence score per TF.
• Gives a %TOTAL score that blends all TFs into a single number.
• Two display modes:
• Strip — horizontal bar with W/D/4H/1H/15m + %TOTAL
• Table — vertical list showing bull% / bear% per TF
• Mobile mode shrinks everything for smaller screens.
Why it matters (psychology)
• Instead of arguing with yourself about “trend,” you get a simple question:
“Are the higher timeframes mostly aligned or mixed?”
• Green/high %TOTAL = “permission” to press your bias, not to over-trade.
• Red/low %TOTAL = natural brake: “This is not the clean trend day. Size down or stay out.”
• It pulls you away from 1-minute tunnel vision and forces you to respect bigger structure.
⸻
3️⃣ Daily ATR Panel (Last 4–12 days + Forecast)
What it does
• Tracks true daily range (High–Low) over recent days.
• Shows:
• Last few days’ range in ticks and $
• Optional 4-day average forecast (projected typical daily move)
• Option to show just last 4 days, or full 12-day history.
• Two modes:
• Table – labeled rows with “ticks / $” columns
• Macro – compact text summary like “FC: 2000t | $20.00”
Why it matters (psychology)
• You stop expecting 5000-tick moves on a 600-tick average day.
• When the forecast is small, you naturally:
• avoid chasing huge targets
• respect partials
• recognize “maybe today just isn’t the big runner”
• On big ATR days, you recognize that volatility is here, so:
• you give your targets breathing room
• you’re less likely to panic when price swings
• This keeps your expectations in line with reality, which reduces tilt, frustration, and revenge trades.
⸻
4️⃣ Order-Flow Sentiment Panel (Compact OF Read)
What it does
• Estimates buy vs sell volume on the current and previous candles.
• Shows:
• Sentiment row with Buy% / Sell%
• Buy/Sell volumes (with “k/m” formatting if enabled)
• Optional extra rows for prior candles.
• Highlights imbalances when one side hits your imbalance threshold (e.g., 70%).
Why it matters (psychology)
• Gives you a quick “who’s in control right now” view without staring at raw volume.
• Imbalance flashes create micro-alerts:
• “This might be a stop run or strong continuation, pay attention.”
• Prevents you from blindly shorting into heavy buy pressure or buying into stacked sell pressure just because of greed or fear.
• Makes your entries feel more validated, which calms you during the trade.
⸻
🧠 Overall Psychological Goal
Worstfx Fractal Sessions Public is not just a visual skin for your charts.
It’s a behavior framework.
It tries to quietly enforce:
• Patience → by tying you to sessions and key time behavior.
• Selectivity → by checking multi-TF trend alignment.
• Realistic expectations → via ATR context.
• Non-impulsive entries → via order-flow imbalance checks.
• Accountability → via clear explanations and structure, not vibes.
Instead of chasing every move, you’re guided into a loop:
“What session am I in? What is ATR saying? Are TFs aligned? Is order-flow confirming? If not, I wait.”
🔋 The risk is minimized by structure & The reward is maximized by timing🔋