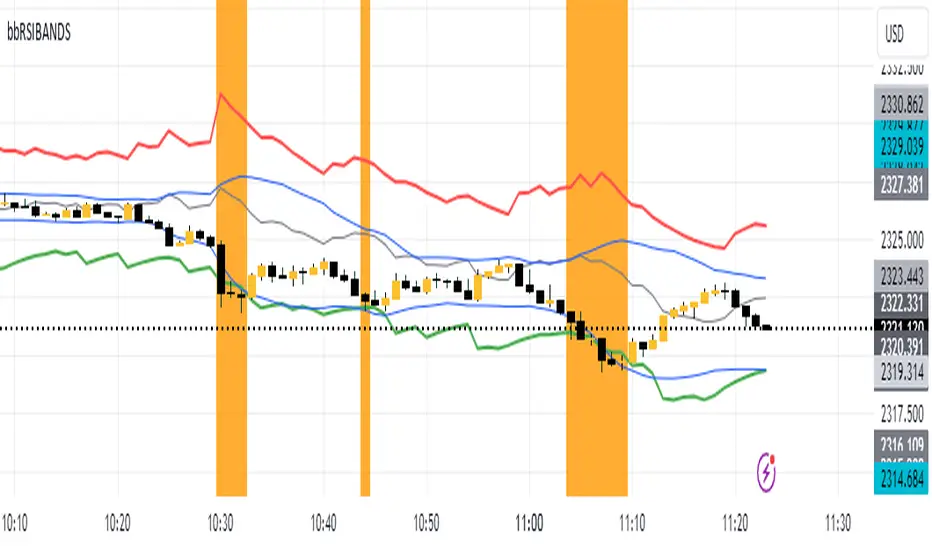
RSIBands with BBThis indicator combines three popular technical analysis tools:
RSI Bands: These bands are based on the Relative Strength Index (RSI) and visually represent overbought and oversold zones. The indicator plots upper and lower bands calculated using a user-defined RSI level and highlights potential buying and selling opportunities near these zones.
Bollinger Bands: These bands depict volatility with a moving average (basis line) and upper and lower bands at a user-defined standard deviation away from the basis line. Narrowing bands suggest potential breakouts, while widening bands indicate increased volatility.
Williams Fractals (with Confirmation): This custom function identifies potential reversal points based on price action patterns. The indicator highlights buy/sell signals when a confirmed fractal forms (previous fractal and price crossing a Bollinger Band).
Key Features:
User-defined parameters: You can adjust the RSI level, Bollinger Band standard deviation, and fractal period according to your trading strategy.
Visual confirmation: The indicator highlights confirmed buy/sell signals based on fractal patterns and price crossing Bollinger Bands.
Flexibility: This indicator provides a combination of trend, volatility, and reversal identification tools, allowing for a multi-faceted approach to technical analysis.
How to Use:
Add the indicator to your chart.
Adjust the RSI level, Bollinger Band standard deviation, and fractal period based on your preference.
Look for buy signals when a green background appears and there's a confirmed up fractal (upward triangle) with the price crossing above the upper Bollinger Band.
Look for sell signals when a red background appears and there's a confirmed down fractal (downward triangle) with the price crossing below the lower Bollinger Band.
Disclaimer:
This indicator is for informational purposes only and should not be considered financial advice. Always conduct your own research and due diligence before making any trading decisions.
ابحث في النصوص البرمجية عن "Fractal"
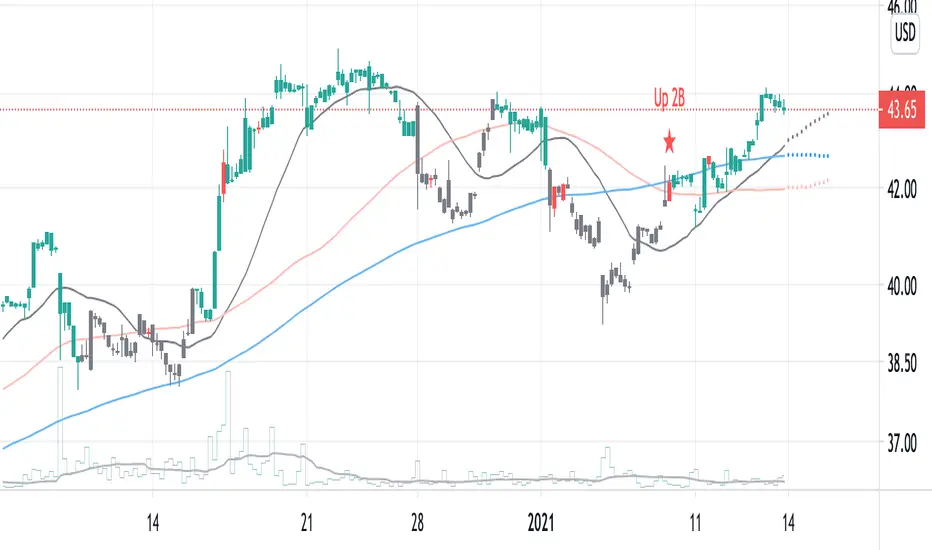
2B detector betaIdentifying a trend reversal is practically tricky, given that price movement is somewhat unpredictable and mostly obeys a power law. In which the price difference is primarily out of normal distribution. According to Benoit Mandelbrot, the price distribution follows an alpha-stable distribution with α equal to 1.7.
Real data observation suggests that stock prices do not follow the Random Walk Hypothesis or Brownian motion. Instead, they follow a fractal pattern. Fractals exhibit similar patterns at different scales called self-similarity. Using this character, one can develop fractal patterns to identify local highs and local lows.
This indicator identifies the reversal signal so-called 2B base on the following logic:
1. Identify local highs and local lows with fractals
2. Define relative positions of those local highs and lows (ABC and 2B)
3. Define the local range of ABC and B
Disclaimer: This indicator is only for research purposes. Please do not take it as investing or trading advice.
Scalping Swing Trading Tool R1-4 by JustUncleLDescription:
This study project is a "Scalping Swing trading Tool" and is an alternative to the "Scalping Pullback Tool R1". It is designed for a two pane TradingView chart layout :
the first pane set to 15min Time Frame;
the second pane set to 1min Time Frame(TF).
The tools incorporates the majority of the indicators needed to analyse and scalp Trends for Swings, PullBacks and reversals on 15min charts and 1min charts.
Incorporated within this tool are the following indicators:
1. The following EMAs are drawn automatically:
Green = EMA89 (15min TF) = EMA75 (1min TF)
Blue = EMA200 (15min TF) = EMA180 (1min TF)
Black = EMA633 (15min TF) = EMA540 (1min TF)
2. The 10EMA (default) High/Low+Close Price Action Channel (PAC), the PAC channel
display is disabled by default.
3. Optionally display Fractals and optional Fractal levels
4. Optional HH, LH, LL, HL finder.
5. Coloured coded Bar high lighting based on the PAC:
blue = bar closed above PAC
red = bar closed below PAC
gray = bar closed inside PAC
lime Line = EMA10 of bar close
6. Pivot points (disables Fractals automatically when selected) with optional labels.
7. EMA5-12 Channel is displayed by default.
8. EMA12-36 Ribbon is displayed by default
9. Optionally display EMA36 and PAC instead of EMA12-36 Ribbon.
Set up and hints:
I am unable to provide a full description here, as Pullback Trading incorporates a full trading Methodology, there are a number of articles and books written on the subject.
Set to two pane TradingView chart, set first pane to 15Min and second to 1min.
Set the chart to Heikin Ashi Candles (optional).
I also add a "Sweetspot Gold2" indicator to the chart as well to help with support and resistance finding and shows where the important "00" lines are.
Use the EMA200 on the 15min pane as the anchor. So when prices above EMA200 we only trade long (buy) and when prices below the EMA200 we only trade short (sell).
On the 15min chart draw any obvious Vertical Trend Lines (VTL), use Pivots point as a guide.
On the 15min chart what we’re looking for price to Pullback into the EMA5-12 Channel or EMA12-36 ribbon, we draw Trendlines uitilising the Pivot points or Fractals to guide your TL drawing.
On the 15min chart look for the trend to resume and break through the drawn TL. The bar color needs to change back to the trend direction colour to confirm as a break.
Now this break can be traded as a 15min trade or now look to the 1min chart.
On the 1min chart draw any Pullback into any of the EMAs.
On the 1min chart look for the trend to resume and break through the drawn TL. The bar color needs to change back to the trend direction colour to confirm as a break.
Now this break can be traded as a 1min trade.
There is also an option to select Pristine (ie Ideal) filtered Fractals, which look like tents or V shape 5-candle patterns. These are actually used to calculate the Pivot points as well.
Other than the "SweetSpot Gold2" indicator, you should not need any other indicator to successfully trade trends for Pullbacks and reversals. If you really want another indicator use the AO (Awesome Oscillator) as it is momentum based.

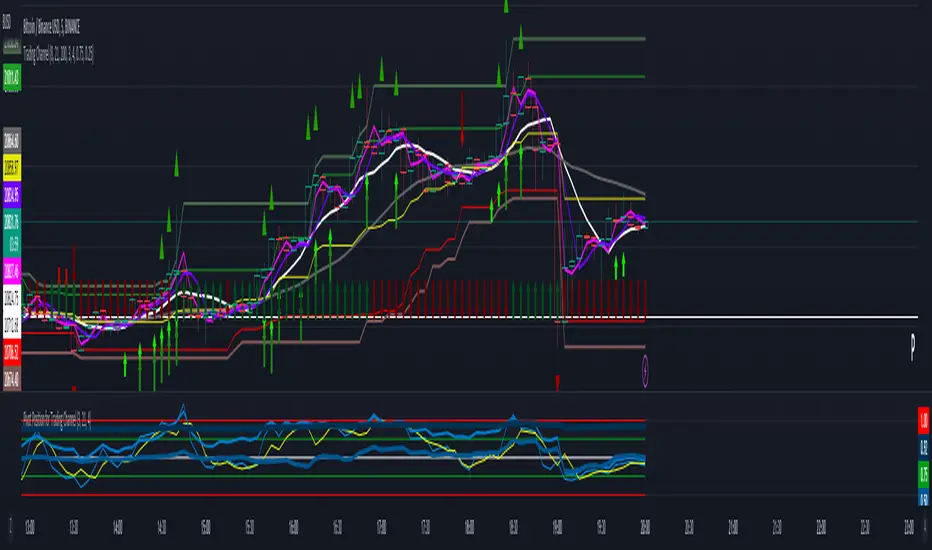
Trading ChannelTrading Channel aims to be a canvas on which to develop any strategy that the user feels comfortable with.
The greatest utility of the script lies in the fact that it plots a channel over the price action, as a support and resistance pivot, within which the price action develops.
It is a script of maximum simplicity in concept and development, but at the same time presents robust support to the price action and a quick visual aid complementary to any indicators that the user works with, feels comfortable with, and uses as a basis for their strategies.
The script includes the following features (most of them disabled by default, available for potential use without the need to add additional indicators):
Fast SMA
Medium SMA
Slow SMA (disabled)
Fast EMA (disabled)
Medium EMA (disabled)
Slow EMA (disabled)
Pivot
Pivot SMA
P Multiplier
Set of resistance and support pivots according to the studies of John L. Person (R3, R2, R1, S1, S2, S3 and midpoints) (disabled by default)
Channel for the current time period in use
Channels for extended time periods (disabled by default)
Various trend, momentum, and overbought/oversold indicating labels (note that the calculations for their representation are based on SMA's even though EMA's are visualized).
SMA's/EMA's
Both are available as both are used as basic indicators for different types of strategies. The default selection of SMA's in this case is based on the fact that the script development is largely based on the studies shared by John L. Person in the area of pivots and by Bill Williams in the area of fractals. Note also that for that same reason the various trend, momentum, and overbought/oversold indicating labels are calculated based on them.
Set of resistance and support pivots
They are included as a consultation tool especially for the higher time periods. They can be used to mark the most interesting supports/resistances and not lose sight of them while operating in lower time periods. Marking monthly, weekly, and daily pivots can be very useful. Additionally, marking S1 and R2 for bullish trends, S1 and R1 for ranges, and S2 and R1 for bearish trends can provide an even more precise framework to work on.
P Multiplier
It is set by default at 4, and is the basis for being able to consider during the use of a specific time frame, the price action with respect to higher time frames. It is the multiplier used for the generation of channels for extended time periods.
Channel for the current time period in use
It is a channel formed by the maximum and minimum closing of the last 21 periods. This value is modifiable and its adjustment depends on the asset under study. 24/7 markets show good results with this adjustment (in the case of BTC really good).
This channel represents a pivot in the form of a yellow middle line, with its support and resistance extremes on the upper green and lower red lines. The same green and red lines, referenced this time to the maximum, are added and serve as possible stop-loss marks.
Channels for extended time periods
Enabling the maximum and minimum channels for extended periods can provide a better idea of the price situation (it is recommended to disable the channel in use and enable the upper one for consultation, it provides a better vision).
Identifying labels:
Following a summary explanation for possible long entries, the same but opposite should be considered for possible short entries:
Small green arrow under candle: indicates possible upward trend (pivot above pivot SMA)
Large green arrow under candle: indicates upward trend (pivot above pivot SMA and above fast SMA)
Green triangle over candle: indicates channel breakout, possible upward momentum (represented as a fractal as its concept is the same)
Green/red arrows at the bottom of the chart: intended to confirm the validity of a signal (should doubt green indications with red lower arrow and vice versa)
Green/red dots at the bottom of the chart: red represents areas of strong resistance and green signals of strong support (with red dots, proceed with caution despite green signals, and vice versa)
Comments
It is emphasized that the basic and most useful functionality of this script is to provide a reliable base on which to develop any strategy, as a framework for working.
If the identifying labels are used, it should be taken into account that the earliest will always be the most reliable and valuable, but their confirmation will always depend on the user's strategy.
Its use in conjunction with the "Pivot Position for Trading Channel" indicator can serve as a base for the development of different strategies, by providing indication of the relative position of the price within the channel.
This script is just a consultation tool with didactic goals, it should not be used as an investment recommendation and the information provided should not be relied upon as such.
------------------------
Trading Channel pretende ser un lienzo sobre el que desarrollar cualquiera que sea la estrategia con la que el usuario se sienta más cómodo.
La mayor utilidad del script radica en que se traza sobre la acción del precio un canal, a modo de pivotes de soporte y resistencia, dentro del cual se desarrolla la acción del precio.
Se trata de un script de máxima sencillez en concepto y desarrollo, pero que a la vez presenta un soporte robusto a la acción del precio y una ayuda rápida visual complementaria a cualquieras que sean los indicadores con los que el usuario trabaje, se sienta más cómodo y utilice como base de sus estrategias.
El script incluye las siguientes funcionalidades (la mayoría desactivadas por defecto, disponibles para su potencial uso sin necesidad de añadir indicadores adicionales):
- SMA rápida
- SMA media
- SMA lenta (desactivada)
- EMA rápida (desactivada)
- EMA media (desactivada)
- EMA lenta (desactivada)
- Pivote
- SMA de pivote
- Multiplicador de P
- Conjunto de pivotes resistencia y soporte de acuerdo a los estudios de John L. Person (R3, R2, R1, S1, S2, S3 y puntos medios) (desactivados por defecto)
- Canal para el periodo temporal en uso
- Canales para periodos temporales extendidos (desactivados por defecto)
- Diversas etiquetas indicativas de cambios de tendencia, de impulso y de sobrecompra y sobreventa (nótese que los cálculos para su representación están basados en SMA's aunque se visualicen EMA's).
SMA's/EMA's
Ambas disponibles pues tanto unas como otras son utilizadas como indicadores básicos para diferentes tipos de estrategias. La selección de SMA's por defecto en este caso se basa en que las bases para desarrollo del script son en gran medida los estudios compartidos por John L. Person en el área de pivotes y de Bill Williams en el área de los fractales. Nótese también que por esa misma razón las diversas etiquetas indicativas de cambios de tendencia, impulso y sobrecompra/sobreventa se calculan en base a ellas.
Conjunto de pivotes resistencia y soporte
Se incluyen como herramienta de consulta sobre todo para los periodos temporales más altos. Pueden utilizarse para marcar los soportes/resistencias de más interés y no perderlos de vista mientras se opera en periodos de tiempo más bajos. De acuerdo a los estudios de John L. Person, marcarse los pivotes mensuales, semanales y diarios puede resultar de mucha utilidad. Adicionalmente, marcar S1 y R2 para tendencias alcistas, S1 y R1 para rangos, y S2 y R1 para tendencias bajistas puede proporcionar un marco aún más preciso sobre el que trabajar.
Multiplicador de p
Está fijado por defecto en 4, y es la base para poder considerar durante el uso de una franja temporal concreta, la acción del precio respecto a franjas temporales superiores. Es el multiplicador utilizado para la generación de los canales para periodos temporales extendidos.
Canal para el periodo temporal en uso
Se trata de un canal conformado por los cierres máximos y mínimos de los últimos 21 periodos. Este valor es modificable y su ajuste depende del activo en estudio. Mercados 24/7 muestran buenos resultados con este ajuste (en el caso de BTC realmente buenos).
Este canal representa en cierta manera un pivote en forma de línea intermedia amarilla, con sus extremos de soporte y resistencia en las líneas verdes superior y roja inferior. Se añaden las mismas líneas verdes y rojas, referenciadas esta vez a los máximos, que sirven como posibles marcas de stop-loss.
Canales para periodos temporales extendidos
Habilitar los máximos y mínimos de canales de periodos extendidos puede proporcionar una mejor idea de la situación del precio (se recomienda deshabilitar el canal en uso y habilitar el superior para consulta, proporciona una mejor visión).
Etiquetas identificativas:
A continuación explicación resumida para posibles entradas en largo, lo mismo pero de modo opuesto debería considerarse para posibles entradas en corto:
Flecha verde pequeña bajo vela: indica inicio de tendencia en alza (pivote por encima de SMA de pivote y ambos por encima de SMA rápida)
Flecha verde grande bajo vela: indica tendencia en alza (pivote por encima de SMA de pivote y ambos por encima de SMA rápida y media)
Triángulo verde sobre vela: indica rotura de canal, posible impulso al alza (representado a modo de fractal pues su concepto es el mismo)
Flechas verdes/rojas a pie de gráfico: pretenden confirmar la validez de una señal (debería dudarse de las indicaciones verdes con flecha inferior roja y viceversa)
Puntos verdes/rojos a pie de gráfico: los rojos representan áreas de fuerte resistencia y los verdes de fuerte soporte (con puntos rojos, proceder con cautela pese a señales verdes, y viceversa)
Comentarios
Se insiste en que la funcionalidad básica y de mayor utilidad de este script es proporcionar una base confiable sobre la que desarrollar cualquier estrategia, a modo de marco de trabajo.
Si se hace uso de las etiquetas identificativas, debe tenerse en cuenta que las más prematuras siempre serán las más confiables y valiosas, pero que su confirmación siempre dependerá de la estrategia por parte del usuario.
Su uso en conjunción al indicador "Pivot Position for Trading Channel" puede servir de base para el desarrollo de diferentes estrategias, al proporcionar indicación de la posición relativa del precio dentro del canal.
Este script es solo una herramienta de consulta con objetivos didácticos, no debe ser utilizado como recomendación de inversión y no se debe confiar en ella como tal.
NormalizedOscillatorsLibrary "NormalizedOscillators"
Collection of some common Oscillators. All are zero-mean and normalized to fit in the -1..1 range. Some are modified, so that the internal smoothing function could be configurable (for example, to enable Hann Windowing, that John F. Ehlers uses frequently). Some are modified for other reasons (see comments in the code), but never without a reason. This collection is neither encyclopaedic, nor reference, however I try to find the most correct implementation. Suggestions are welcome.
rsi2(upper, lower) RSI - second step
Parameters:
upper : Upwards momentum
lower : Downwards momentum
Returns: Oscillator value
Modified by Ehlers from Wilder's implementation to have a zero mean (oscillator from -1 to +1)
Originally: 100.0 - (100.0 / (1.0 + upper / lower))
Ignoring the 100 scale factor, we get: upper / (upper + lower)
Multiplying by two and subtracting 1, we get: (2 * upper) / (upper + lower) - 1 = (upper - lower) / (upper + lower)
rms(src, len) Root mean square (RMS)
Parameters:
src : Source series
len : Lookback period
Based on by John F. Ehlers implementation
ift(src) Inverse Fisher Transform
Parameters:
src : Source series
Returns: Normalized series
Based on by John F. Ehlers implementation
The input values have been multiplied by 2 (was "2*src", now "4*src") to force expansion - not compression
The inputs may be further modified, if needed
stoch(src, len) Stochastic
Parameters:
src : Source series
len : Lookback period
Returns: Oscillator series
ssstoch(src, len) Super Smooth Stochastic (part of MESA Stochastic) by John F. Ehlers
Parameters:
src : Source series
len : Lookback period
Returns: Oscillator series
Introduced in the January 2014 issue of Stocks and Commodities
This is not an implementation of MESA Stochastic, as it is based on Highpass filter not present in the function (but you can construct it)
This implementation is scaled by 0.95, so that Super Smoother does not exceed 1/-1
I do not know, if this the right way to fix this issue, but it works for now
netKendall(src, len) Noise Elimination Technology by John F. Ehlers
Parameters:
src : Source series
len : Lookback period
Returns: Oscillator series
Introduced in the December 2020 issue of Stocks and Commodities
Uses simplified Kendall correlation algorithm
Implementation by @QuantTherapy:
rsi(src, len, smooth) RSI
Parameters:
src : Source series
len : Lookback period
smooth : Internal smoothing algorithm
Returns: Oscillator series
vrsi(src, len, smooth) Volume-scaled RSI
Parameters:
src : Source series
len : Lookback period
smooth : Internal smoothing algorithm
Returns: Oscillator series
This is my own version of RSI. It scales price movements by the proportion of RMS of volume
mrsi(src, len, smooth) Momentum RSI
Parameters:
src : Source series
len : Lookback period
smooth : Internal smoothing algorithm
Returns: Oscillator series
Inspired by RocketRSI by John F. Ehlers (Stocks and Commodities, May 2018)
rrsi(src, len, smooth) Rocket RSI
Parameters:
src : Source series
len : Lookback period
smooth : Internal smoothing algorithm
Returns: Oscillator series
Inspired by RocketRSI by John F. Ehlers (Stocks and Commodities, May 2018)
Does not include Fisher Transform of the original implementation, as the output must be normalized
Does not include momentum smoothing length configuration, so always assumes half the lookback length
mfi(src, len, smooth) Money Flow Index
Parameters:
src : Source series
len : Lookback period
smooth : Internal smoothing algorithm
Returns: Oscillator series
lrsi(src, in_gamma, len) Laguerre RSI by John F. Ehlers
Parameters:
src : Source series
in_gamma : Damping factor (default is -1 to generate from len)
len : Lookback period (alternatively, if gamma is not set)
Returns: Oscillator series
The original implementation is with gamma. As it is impossible to collect gamma in my system, where the only user input is length,
an alternative calculation is included, where gamma is set by dividing len by 30. Maybe different calculation would be better?
fe(len) Choppiness Index or Fractal Energy
Parameters:
len : Lookback period
Returns: Oscillator series
The Choppiness Index (CHOP) was created by E. W. Dreiss
This indicator is sometimes called Fractal Energy
er(src, len) Efficiency ratio
Parameters:
src : Source series
len : Lookback period
Returns: Oscillator series
Based on Kaufman Adaptive Moving Average calculation
This is the correct Efficiency ratio calculation, and most other implementations are wrong:
the number of bar differences is 1 less than the length, otherwise we are adding the change outside of the measured range!
For reference, see Stocks and Commodities June 1995
dmi(len, smooth) Directional Movement Index
Parameters:
len : Lookback period
smooth : Internal smoothing algorithm
Returns: Oscillator series
Based on the original Tradingview algorithm
Modified with inspiration from John F. Ehlers DMH (but not implementing the DMH algorithm!)
Only ADX is returned
Rescaled to fit -1 to +1
Unlike most oscillators, there is no src parameter as DMI works directly with high and low values
fdmi(len, smooth) Fast Directional Movement Index
Parameters:
len : Lookback period
smooth : Internal smoothing algorithm
Returns: Oscillator series
Same as DMI, but without secondary smoothing. Can be smoothed later. Instead, +DM and -DM smoothing can be configured
doOsc(type, src, len, smooth) Execute a particular Oscillator from the list
Parameters:
type : Oscillator type to use
src : Source series
len : Lookback period
smooth : Internal smoothing algorithm
Returns: Oscillator series
Chande Momentum Oscillator (CMO) is RSI without smoothing. No idea, why some authors use different calculations
LRSI with Fractal Energy is a combo oscillator that uses Fractal Energy to tune LRSI gamma, as seen here: www.prorealcode.com
doPostfilter(type, src, len) Execute a particular Oscillator Postfilter from the list
Parameters:
type : Oscillator type to use
src : Source series
len : Lookback period
Returns: Oscillator series

Nubia - Auto Midas Anchored VWAP [xdecow]This indicator looks for the highs and lows using the highest / lowest of 4 different periods. The default values are 17, 72, 305 and 1292 inspired by BO Williams phicube fractals.
The indicator will show anchored vwaps from those 8 dynamic points (4 tops and 4 bottoms).
A true trend is defined when 4 fractals line up without much opposite resistance (only the two smallest opposing vwaps).
When the price is between several vwaps it is a sign of consolidation or pullback. You can use larger timeframes to check for possible targets in large consolidations and pullbacks.

Pullback Trading Tool R5-65 by JustUncleLBy request this is an updated version of the "PullBack Trading Tool": removes experimental "OCC" channel, added option to display ribbons or just single moving average lines, added alert arrows for "PB" exits, added alertcondition for TV alarm subsystem, added some extract options for Pivot points and general cleanup of code.
Description:
This project incorporates the majority of the indicators needed to analyse and trade Trends for Pullbacks, swings and reversals.
Incorporated within this tool are the following indicators:
1. Major industry (Banks) recognised important EMAs in an EMA Ribbon:
Lime = EMA5 (Optional Display)
DodgerBlue = EMA12 (Optional Display)
Red = EMA36 (Optional display)
Green = EMA89
Blue = EMA200
Black = EMA633
2. The 5 EMA (default) High/Low/Close Price Action Channel (PAC), the PAC channel display is disabled by default.
3. Optionally display Fractals and optional Fractal levels
4. Optional HH, LH, LL, HL finder.
5. Optional Buy/Sell "PB" exit Alerts with Optional 200EMA filter.
6. Coloured coded Bar high lighting based on the PAC:
blue = bar closed above PAC
red = bar closed below PAC
gray = bar closed inside PAC
7. Alert condition sent to TradingView's Alarm subsystem for PB exits.
8. Pivot points with optional labels.
9. EMA5-12 Ribbon is displayed by default.
10.EMA12-36 Ribbon is displayed by default
Set up and hints:
I am unable to provide a full description here, as Pullback Trading incorporates a full trading Methodology, there are a number of articles and books written on the subject.
Set the chart to Heikin Ashi Candles (optional).
I also add a "Sweetspot Gold R3" indicator to the chart as well to help with support and resistance finding and shows where the important "00" lines are.
First on a weekly basis say Sunday night or Monday morning, analyse the Daily and Weekly charts to establish overall trends, and support/resistant levels. Draw significant mini trend lines (2/3 TL), vertical trend lines (VTL) and S/R levels. Can use the Pivots points to guide VTL drawing and Fractals to help guide 2/3 TL drawing.
Once the trend direction and any potential major reversals highlighted, drop down to lower timeframe chart and draw appropriate mini Trend line (2/3 TL) matching the established momentum direction. Take note of potential pull backs from and of the EMAs, in particular the EMA5-12 ribbon, EMA12-36 Ribbon and the 200EMA. Can use the Pivots and/or Fractals points to guide your 2/3 TL drawing.
Set a TradingView alarm on the "PBTOOL alert", with the default settings this normally occurs before or during the Break of the manually drawn TL lines.
Once alerted check to see if the TL is broken and is returning to trend away from the EMA lines, this is indicated by bar colour change to trend directional colour.
You can trade that alert or drop down to even lower time frames and perform the same TL analysis there to find trades at the lower TF. Trading at lower TF you will allow tighter Stop loss settings.
Other than the "SweetSpot Gold R3" indicator, you should not need any other indicator to successfully trade trends for Pullbacks and reversals. If you really want another indicator I suggest a momentum one for example: AO ( Awesome Oscillator ), MACD or Squeeze Momentum.

Echo Chamber [theUltimator5]The Echo Chamber - When history repeats, maybe you should listen.
Ever had that eerie feeling you've seen this exact price action before? The Echo Chamber doesn't just give you déjà vu—it mathematically proves it, scales it, and projects what happened next.
📖 WHAT IT DOES
The Echo Chamber is an advanced pattern recognition tool that scans your chart's history to find segments that closely match your current price action. But here's where it gets interesting: it doesn't just find similar patterns - It expands and contracts the time window to create a uniquely scaled fractal. Patterns don't always follow the same timeframe, but they do follow similar patterns.
Using a custom correlation analysis algorithm combined with flexible time-scaling, this indicator:
Finds historical price segments that mirror your current market structure
Scales and overlays them perfectly onto your current chart
Projects forward what happened AFTER that historical match
Gives you a visual "echo" from the past with a glimpse into potential futures
══════════════════════════════
HOW TO USE IT
This indicator starts off in manual mode, which means that YOU, the user, can select the point in time that you want to project from. Simply click on a point in time to set the starting value.
Once you select your point in time, the indicator will automatically plot the chosen historical chart pattern and correlation over the current chart and project the price forwards based on how the chart looked in the past. If you want to change the point in time, you can update it from the settings, or drag the point on the chart over to a new position.
You can manually select any point in time, and the chart will quickly update with the new pattern. A correlation will be shown in a table alongside the date/timestamp of the selected point in time.
You can switch to auto mode, which will automatically search out the best-fit pattern over a defined lookback range and plot the past/future projection for you without having to manually select a point in time at all. It simply finds the best fit for you.
You can change the scale factor by adjusting multiplication and division variables to find time-scaled fractal patterns.
══════════════════════════════
🎯 KEY FEATURES
Two Operating Modes:
🔧 MANUAL MODE - Select any historical point and see how it correlates with current price action in real-time. Perfect for:
• Analyzing specific past events (crashes, rallies, consolidations)
• Testing historical patterns against current conditions
• Educational analysis of market structure repetition
🤖 AUTO MODE - It automatically scans through your lookback period to find the single best-correlated historical match. Ideal for:
• Quick pattern discovery
• Systematic trading approach
• Unbiased pattern recognition
Time Warp Technology:
The time warp feature expands and compresses the correlation window to provide a custom fractal so you can analyze windows of time that don't necessarily match the current chart.
💡 *Example: Multiplier=3, Divisor=2 gives you a 1.5x time stretch—perfect for finding patterns that played out 50% slower than current price action.*
Drawing Modes:
Scale Only : Pure vertical scaling—matches price range while maintaining temporal alignment at bar 0
Rotate & Scale : Advanced geometric transformation that anchors both the start AND end points, creating a rotated fit that matches your current segment's slope and range
Visual Components:
🟠 Orange Overlay : The historical match, perfectly scaled to your current price action
🟣 Purple Projection : What happened NEXT after that historical pattern (dotted line into the future)
📦 Highlight Boxes : Shows you exactly where in history these patterns came from
📊 Live Correlation Table : Real-time correlation coefficient with color-coded strength indicator
══════════════════════════════
⚙️ PARAMETERS EXPLAINED
Correlation Window Length (20) : How many bars to match. Smaller = more precise matches but noisier. Larger = broader patterns but fewer matches.
Note: if this value is too high in auto mode, the script may time out from computational overload.
Multiplication Factor : Historical time multiplier. 2 = sample every 2nd bar from history. Higher values find slower historical patterns.
Division Factor : Historical time divisor applied after multiplication. Final sample rate = (Length × Factor) ÷ Divisor, rounded down.
Lookback Range : How far back to search for patterns. More history = better chance of finding matches but slower performance.
Note: if this value is too high in auto mode, the script may time out from computational overload.
Future Projection Length : How many bars forward to project from the historical match. Your crystal ball's focal length.
══════════════════════════════
💼 TRADING APPLICATIONS
Trend Continuation/Reversal :
If the purple projection continues the current trend, that's your historical confirmation. If it reverses, you've found a potential turning point that's happened before under similar conditions.
Support/Resistance Validation :
Does the projection respect your S/R levels? History suggests those levels matter. Does it break through? You've found historical precedent for a breakout.
Time-Based Exits :
The projection shows not just WHERE price might go, but WHEN. Use it to anticipate timing of moves.
Multi-Timeframe Analysis :
Use time compression to overlay higher timeframe patterns onto lower timeframes. See daily patterns on hourly charts, weekly on daily, etc.
Pattern Education :
In Manual Mode, study how specific historical events correlate with current conditions. Build your pattern recognition library.
══════════════════════════════
📊 CORRELATION TABLE
The table shows your correlation coefficient as a percentage:
80-100%: Extremely strong correlation—history is practically repeating
60-80%: Strong correlation—significant similarity
40-60%: Moderate correlation—some structural similarity
20-40%: Weak correlation—limited similarity
0-20%: Very weak correlation—essentially random match
-20-40%: Weak inverse correlation
-40-60%: Moderate inverse correlation
-60-80%: Strong inverse correlation
-80-100%: Extremely strong inverse correlation—history is practically inverting
**Important**: The correlation measures SHAPE similarity, not price level. An 85% correlation means the price movements follow a very similar pattern, regardless of whether prices are higher or lower.
══════════════════════════════
⚠️ IMPORTANT DISCLAIMERS
- Past performance does NOT guarantee future results (but it sure is interesting to study)
- High correlation doesn't mean causation—markets are complex adaptive systems
- Use this as ONE tool in your analytical toolkit, not a standalone trading system
- The projection is what HAPPENED after a similar pattern in the past, not a prediction
- Always use proper risk management regardless of what the Echo Chamber suggests
══════════════════════════════
🎓 PRO TIPS
1. Start with Auto Mode to find high-correlation matches, then switch to Manual Mode to study why that period was similar
2. Experiment with time warping on different timeframes—a 2x factor on a daily chart lets you see weekly patterns
3. Watch for correlation decay —if correlation drops sharply after the match, current conditions are diverging from history
4. Combine with volume —check if volume patterns also match
5. Use "Rotate & Scale" mode when the current trend angle differs from the historical match
6. Increase lookback range to 500-1000+ on daily/weekly charts for finding rare historical parallels
══════════════════════════════
🔧 TECHNICAL NOTES
- Uses Pearson correlation coefficient for pattern matching
- Implements range-based scaling to normalize different price levels
- Rotation mode uses linear interpolation for geometric transformation
- All calculations are performed on close prices
- Boxes highlight actual historical bar ranges (high/low)
- Maximum of 500 lines and 500 boxes for performance optimization

reversalLibrary "reversals"
psar(af_start, af_increment, af_max)
Calculates Parabolic Stop And Reverse (SAR)
Parameters:
af_start (simple float) : Initial acceleration factor (Wilder's original: 0.02)
af_increment (simple float) : Acceleration factor increment per new extreme (Wilder's original: 0.02)
af_max (simple float) : Maximum acceleration factor (Wilder's original: 0.20)
Returns: SAR value (stop level for current trend)
fractals()
Detects Williams Fractal patterns (5-bar pattern)
Returns: Tuple with fractal values (na if no fractal)
swings(lookback, source_high, source_low)
Detects swing highs and swing lows using lookback period
Parameters:
lookback (simple int) : Number of bars on each side to confirm swing point
source_high (float) : Price series for swing high detection (typically high)
source_low (float) : Price series for swing low detection (typically low)
Returns: Tuple with swing point values (na if no swing)
pivot(tf)
Calculates classic/standard/floor pivot points
Parameters:
tf (simple string) : Timeframe for pivot calculation ("D", "W", "M")
Returns: Tuple with pivot levels
pivotcam(tf)
Calculates Camarilla pivot points with 8 levels for short-term trading
Parameters:
tf (simple string) : Timeframe for pivot calculation ("D", "W", "M")
Returns: Tuple with pivot levels
pivotdem(tf)
Calculates d-mark pivot points with conditional open/close logic
Parameters:
tf (simple string) : Timeframe for pivot calculation ("D", "W", "M")
Returns: Tuple with pivot levels (only 3 levels)
pivotext(tf)
Calculates extended traditional pivot points with R4-R5 and S4-S5 levels
Parameters:
tf (simple string) : Timeframe for pivot calculation ("D", "W", "M")
Returns: Tuple with pivot levels
pivotfib(tf)
Calculates Fibonacci pivot points using Fibonacci ratios
Parameters:
tf (simple string) : Timeframe for pivot calculation ("D", "W", "M")
Returns: Tuple with pivot levels
pivotwood(tf)
Calculates Woodie's pivot points with weighted closing price
Parameters:
tf (simple string) : Timeframe for pivot calculation ("D", "W", "M")
Returns: Tuple with pivot levels

Pivot Candle PatternsPivot Candle Patterns Indicator
Overview
The PivotCandlePatterns indicator is a sophisticated trading tool that identifies high-probability candlestick patterns at market pivot points. By combining Williams fractals pivot detection with advanced candlestick pattern recognition, this indicator targets the specific patterns that statistically show the highest likelihood of signaling reversals at market tops and bottoms.
Scientific Foundation
The indicator is built on extensive statistical analysis of historical price data using a 42-period Williams fractal lookback period. Our research analyzed which candlestick patterns most frequently appear at genuine market reversal points, quantifying their occurrence rates and subsequent success in predicting reversals.
Key Research Findings:
At Market Tops (Pivot Highs):
- Three White Soldiers: 28.3% occurrence rate
- Spinning Tops: 13.9% occurrence rate
- Inverted Hammers: 11.7% occurrence rate
At Market Bottoms (Pivot Lows):
- Three Black Crows: 28.4% occurrence rate
- Hammers: 13.3% occurrence rate
- Spinning Tops: 13.1% occurrence rate
How It Works
1. Pivot Point Detection
The indicator uses a non-repainting implementation of Williams fractals to identify potential market turning points:
- A pivot high is confirmed when the middle candle's high is higher than surrounding candles within the lookback period
- A pivot low is confirmed when the middle candle's low is lower than surrounding candles within the lookback period
- The default lookback period is 2 candles (user adjustable from 1-10)
2. Candlestick Pattern Recognition
At identified pivot points, the indicator analyzes candle properties using these parameters:
- Body percentage threshold for Spinning Tops: 40% (adjustable from 10-60%)
- Shadow percentage threshold for Hammer patterns: 60% (adjustable from 40-80%)
- Maximum upper shadow for Hammer: 10% (adjustable from 5-20%)
- Maximum lower shadow for Inverted Hammer: 10% (adjustable from 5-20%)
3. Pattern Definitions
The indicator recognizes these specific patterns:
Single-Candle Patterns:
- Spinning Top : Small body (< 40% of total range) with significant upper and lower shadows (> 25% each)
- Hammer : Small body (< 40%), very long lower shadow (> 60%), minimal upper shadow (< 10%), closing price above opening price
- Inverted Hammer : Small body (< 40%), very long upper shadow (> 60%), minimal lower shadow (< 10%)
Multi-Candle Patterns:
- Three White Soldiers : Three consecutive bullish candles, each closing higher than the previous, with each open within the previous candle's body
- Three Black Crows : Three consecutive bearish candles, each closing lower than the previous, with each open within the previous candle's body
4. Visual Representation
The indicator provides multiple visualization options:
- Highlighted candle backgrounds for pattern identification
- Text or dot labels showing pattern names and success rates
- Customizable colors for different pattern types
- Real-time alert functionality on pattern detection
- Information dashboard displaying pattern statistics
Why It Works
1. Statistical Edge
Unlike traditional candlestick pattern indicators that simply identify patterns regardless of context, PivotCandlePatterns focuses exclusively on patterns occurring at statistical pivot points, dramatically increasing signal quality.
2. Non-Repainting Design
The pivot detection algorithm only uses confirmed data, ensuring the indicator doesn't repaint or provide false signals that disappear on subsequent candles.
3. Complementary Pattern Selection
The selected patterns have both:
- Statistical significance (high frequency at pivots)
- Logical market psychology (reflecting institutional supply/demand changes)
For example, Three White Soldiers at a pivot high suggests excessive bullish sentiment reaching exhaustion, while Hammers at pivot lows indicate rejection of lower prices and potential buying pressure.
Practical Applications
1. Reversal Trading
The primary use is identifying potential market reversals with statistical probability metrics. Higher percentage patterns (like Three White Soldiers at 28.3%) warrant more attention than lower probability patterns.
2. Confirmation Tool
The indicator works well when combined with other technical analysis methods:
- Support/resistance levels
- Trend line breaks
- Divergences on oscillators
- Volume analysis
3. Risk Management
The built-in success rate metrics help traders properly size positions based on historical pattern reliability. The displayed percentages reflect the probability of the pattern successfully predicting a reversal.
Optimized Settings
Based on extensive testing, the default parameters (Body: 40%, Shadow: 60%, Shadow Maximums: 10%, Lookback: 2) provide the optimal balance between:
- Signal frequency
- False positive reduction
- Early entry opportunities
- Pattern clarity
Users can adjust these parameters based on their timeframe and trading style, but the defaults represent the statistically optimal configuration.
Complementary Research: Reclaim Analysis
Additional research on "reclaim" scenarios (where price briefly breaks a level before returning) showed:
- Fast reclaims (1-2 candles) have 70-90% success rates
- Reclaims with increasing volume have 53.1% success rate vs. decreasing volume at 22.6%
This complementary research reinforces the importance of candle patterns and timing at critical market levels.

Quarterly Cycle Theory with DST time AdjustedThe Quarterly Theory removes ambiguity, as it gives specific time-based reference points to look for when entering trades. Before being able to apply this theory to trading, one must first understand that time is fractal:
Yearly Quarters = 4 quarters of three months each.
Monthly Quarters = 4 quarters of one week each.
Weekly Quarters = 4 quarters of one day each (Monday - Thursday). Friday has its own specific function.
Daily Quarters = 4 quarters of 6 hours each = 4 trading sessions of a trading day.
Sessions Quarters = 4 quarters of 90 minutes each.
90 Minute Quarters = 4 quarters of 22.5 minutes each.
Yearly Cycle: Analogously to financial quarters, the year is divided in four sections of three months each:
Q1 - January, February, March.
Q2 - April, May, June (True Open, April Open).
Q3 - July, August, September.
Q4 - October, November, December.
S&P 500 E-mini Futures (daily candles) — Monthly Cycle.
Monthly Cycle: Considering that we have four weeks in a month, we start the cycle on the first month’s Monday (regardless of the calendar Day):
Q1 - Week 1: first Monday of the month.
Q2 - Week 2: second Monday of the month (True Open, Daily Candle Open Price).
Q3 - Week 3: third Monday of the month.
Q4 - Week 4: fourth Monday of the month.
S&P 500 E-mini Futures (4 hour candles) — Weekly Cycle.
Weekly Cycle: Daye determined that although the trading week is composed by 5 trading days, we should ignore Friday, and the small portion of Sunday’s price action:
Q1 - Monday.
Q2 - Tuesday (True Open, Daily Candle Open Price).
Q3 - Wednesday.
Q4 - Thursday.
S&P 500 E-mini Futures (1 hour candles) — Daily Cycle.
Daily Cycle: The Day can be broken down into 6 hour quarters. These times roughly define the sessions of the trading day, reinforcing the theory’s validity:
Q1 - 18:00 - 00:00 Asia.
Q2 - 00:00 - 06:00 London (True Open).
Q3 - 06:00 - 12:00 NY AM.
Q4 - 12:00 - 18:00 NY PM.
S&P 500 E-mini Futures (15 minute candles) — 6 Hour Cycle.
6 Hour Quarters or 90 Minute Cycle / Sessions divided into four sections of 90 minutes each (EST/EDT):
Asian Session
Q1 - 18:00 - 19:30
Q2 - 19:30 - 21:00 (True Open)
Q3 - 21:00 - 22:30
Q4 - 22:30 - 00:00
London Session
Q1 - 00:00 - 01:30
Q2 - 01:30 - 03:00 (True Open)
Q3 - 03:00 - 04:30
Q4 - 04:30 - 06:00
NY AM Session
Q1 - 06:00 - 07:30
Q2 - 07:30 - 09:00 (True Open)
Q3 - 09:00 - 10:30
Q4 - 10:30 - 12:00
NY PM Session
Q1 - 12:00 - 13:30
Q2 - 13:30 - 15:00 (True Open)
Q3 - 15:00 - 16:30
Q4 - 16:30 - 18:00
S&P 500 E-mini Futures (5 minute candles) — 90 Minute Cycle.
Micro Cycles: Dividing the 90 Minute Cycle yields 22.5 Minute Quarters, also known as Micro Sessions or Micro Quarters:
Asian Session
Q1/1 18:00:00 - 18:22:30
Q2 18:22:30 - 18:45:00
Q3 18:45:00 - 19:07:30
Q4 19:07:30 - 19:30:00
Q2/1 19:30:00 - 19:52:30 (True Session Open)
Q2/2 19:52:30 - 20:15:00
Q2/3 20:15:00 - 20:37:30
Q2/4 20:37:30 - 21:00:00
Q3/1 21:00:00 - 21:23:30
etc. 21:23:30 - 21:45:00
London Session
00:00:00 - 00:22:30 (True Daily Open)
00:22:30 - 00:45:00
00:45:00 - 01:07:30
01:07:30 - 01:30:00
01:30:00 - 01:52:30 (True Session Open)
01:52:30 - 02:15:00
02:15:00 - 02:37:30
02:37:30 - 03:00:00
03:00:00 - 03:22:30
03:22:30 - 03:45:00
03:45:00 - 04:07:30
04:07:30 - 04:30:00
04:30:00 - 04:52:30
04:52:30 - 05:15:00
05:15:00 - 05:37:30
05:37:30 - 06:00:00
New York AM Session
06:00:00 - 06:22:30
06:22:30 - 06:45:00
06:45:00 - 07:07:30
07:07:30 - 07:30:00
07:30:00 - 07:52:30 (True Session Open)
07:52:30 - 08:15:00
08:15:00 - 08:37:30
08:37:30 - 09:00:00
09:00:00 - 09:22:30
09:22:30 - 09:45:00
09:45:00 - 10:07:30
10:07:30 - 10:30:00
10:30:00 - 10:52:30
10:52:30 - 11:15:00
11:15:00 - 11:37:30
11:37:30 - 12:00:00
New York PM Session
12:00:00 - 12:22:30
12:22:30 - 12:45:00
12:45:00 - 13:07:30
13:07:30 - 13:30:00
13:30:00 - 13:52:30 (True Session Open)
13:52:30 - 14:15:00
14:15:00 - 14:37:30
14:37:30 - 15:00:00
15:00:00 - 15:22:30
15:22:30 - 15:45:00
15:45:00 - 15:37:30
15:37:30 - 16:00:00
16:00:00 - 16:22:30
16:22:30 - 16:45:00
16:45:00 - 17:07:30
17:07:30 - 18:00:00
S&P 500 E-mini Futures (30 second candles) — 22.5 Minute Cycle.

EneX SignalEneX is signal that give recommendation signals for entry and exit on spot market. This indicators not suitable for leverage trading in futures market.
EneX signal consider several indicators and has entry and exit rules.
EneX signal is suitable for investors who believe in trend following strategy (disclaimer on).
This script composed by Yohan Naftali for educational purpose only. Reader who will use this signal must do own research.
Indicator and Plot Involved
1. Williams Fractals with default periods = 2
2. William Alligator Indicators with default simple moving average 8, 13, and 21
3. Exponential Moving Averages with default value EMA 50, 100, and 200
4. Relative Strength Index with default overbought level = 80 and oversold level = 20
5. Williams Fractals are joined to create support and resistance line and fill area between support and resistance lines.
Entry signal conditions
1. Entry on Weakness when bullish fractal appear on n/2 period
2. Entry when price break resistance line
All entry condition must above EMA and alligator signal and not in overbought RSI
Exit signal conditions
1. Lowest price is below Exponential Moving Average
2. Lowest price is below William alligator lines
You can easily find entry and exit points by using Entry (E), Exit(X) signals
How to use
1. Monitor chart and wait until E or X signals
2. Entry if Entry Signal (E) appear (green colored label)
3. Exit if Exit Signal (X) appear (red colored label)
4. Change indicators setting when necessary
Best Practice
1. Entry only when entry signal (E) appear
2. Never entry when price below William alligator signal
3. Exit when exit signal (X) appear
4. Not exit when exit signal appear when you believe or you have information that price will be rebound
5. Exit if you believe that current price meet your target price
6. Always wise when use EneX signals
Disclaimer
Do your own research and consider fundamental price of asset.
The indicators provided on this script is for educational purposes only.
Author does not offer advisory or brokerage services, nor does it recommend or advise users to buy or sell particular stocks or securities.
Please examined script and give feedback for further improvement.

Deep_Fractal_Signals_and_Rubber_Band_TradesThis indicator is based on Williams Fractals and the TopDog Trading "Rubber Band Trade"
The Deep Fractal Signals are triangles that indicate the price is forming a pattern of decreasing lows in a down trend (orange) or, increasing highs in an up trend (green).
The triangles are placed above or below the last bar of the pattern, unlike Fractals which are drawn 2 candles prior to the current candle, and are re-painted on the chart.
When the triangle is indicated above the moving average in a down trend (blue), or below the moving average in an up trend (yellow), this is a Rubber Band Trade.
When the slope of the moving average is less than the Gain set by the user, or are counter-trend, the triangles are plotted in silver.
When used in conjunction with the Power Analyzer indicator, a signal to the long side should be taken when the Power Analyzer momentum indicator is at a cycle low. Similarly, a signal to the short side should be taken when the indicator is at a cycle high.
The first, second or third signal in a new trend have the highest probability of a follow through.
The indicator sometimes gives a false signal at the very end of the trend, just before the market reverses. This is an attempt by the Market Makers to persuade traders that the trend will continue.
Please leave a comment and "Like" this indicator if you find it useful.
FX Engineering

Phicube EMASAR ( EMA Support and Resistance )Indicator based on the Concept created by Bo Williams. But unlike the original that uses MIMAs, EMAs are used here.
Exponential moving averages will be shown according to fractal alignment, in order to show the important support and resistance levels ( SAR ).
When the fractals are aligned to become support,
we will have the EMA in the graph with a bright color.
When the fractals are aligned to become resistance, we will have EMA in the graph with a matte color.
Available exponential moving averages: 17,34,72,144,305,610,1292 and 2584
____________________________________________________//_____________________________________________________________________
Indicador baseado no Conceito criado pelo Bo Williams. Mas diferente do original que utiliza MIMAs, aqui é utilizado EMAs.
As médias móveis exponenciais serão mostradas de acordo com o alinhamento dos fractais, com objetivo de mostrar os níveis importantes
de suporte e resistência( SAR ).
Quando estiver com os fractais alinhados virando suporte, teremos no gráfico a EMA com uma cor em tom brilhante.
Quando estiver com os fractais alinhados virando resistência, teremos no gráfico a EMA com uma cor em tom fosco.
Médias móveis exponenciais disponíveis: 17,34,72,144,305,610,1292 e 2584

[PX] Level & TrendlinesThe indicator identifies the intermediate fractal pattern, where neighboring fractals are either higher or lower. It plots horizontal level and trendlines based on those fractals and comes with a variety of settings.
If you are looking for someone to develop your on indicator or trading strategy, don't hesitate to get in touch with me here on TradingView or below.
Contact:
www.pascal-simon.de
info@pascal-simon.de

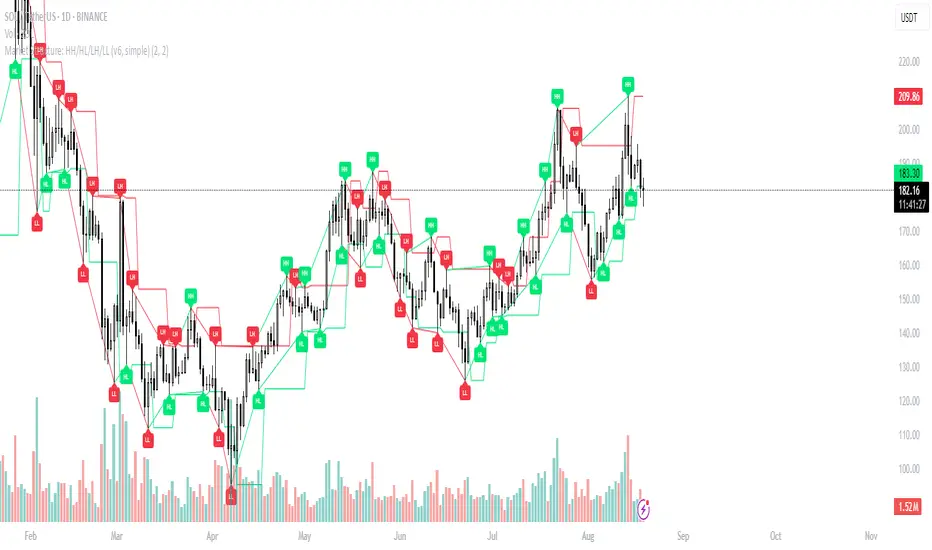
Market Structure: HH/HL/LH/LL (v6, simple)What it does
Labels swing High/Low and classifies structure as HH / HL / LH / LL after confirmation.
Uses confirmed fractals (pivothigh/pivotlow) → no repaint after confirmation (there is a right-bar confirmation delay).
Optional swing connectors (lines), optional plain H/L when structure label is not applicable.
Plots last confirmed High/Low levels as reference.
Alerts when a new HH/HL/LH/LL is formed.
How it works
Swings are detected with ta.pivothigh() / ta.pivotlow() using user-defined left and right.
A pivot is confirmed only after right bars on the right—this is the only delay. Once confirmed, the label does not repaint.
Inputs
Left bars & Right bars – fractal sensitivity.
Connect swings with lines – draw lines between consecutive swings.
Show bullish (HH/HL) / Show bearish (LH/LL) – filter what to display.
Show plain H/L – draw H/L when classification is not HH/HL/LH/LL yet.
Recommended settings
1H–4H: left=2, right=2 (responsive).
1D+: left=3, right=3 (cleaner swing map).
Alerts provided
HH formed – new Higher High confirmed.
HL formed – new Higher Low confirmed.
LH formed – new Lower High confirmed.
LL formed – new Lower Low confirmed.
Use them to automate structure tracking or feed your strategy rules.
Tips
Trend up: a sequence of HH + HL; Trend down: LH + LL.
Combine with VWAP/EMA, liquidity zones, or volume/CVD to avoid chasing late signals.
The script is intentionally simple and lightweight; BOS/CHoCH can be added in a future update.
Limitations / Notes
Because the tool relies on confirmed pivots, signals are delayed by right bars.
This is not financial advice and not a buy/sell system on its own.
Changelog
v1.0 – Initial public release (Pine v6). Structure labels, swing connectors, last levels, and alert set.
Keywords
market structure, hh hl lh ll, swing, fractal, pivothigh, pivotlow, trend, structure labels, price action
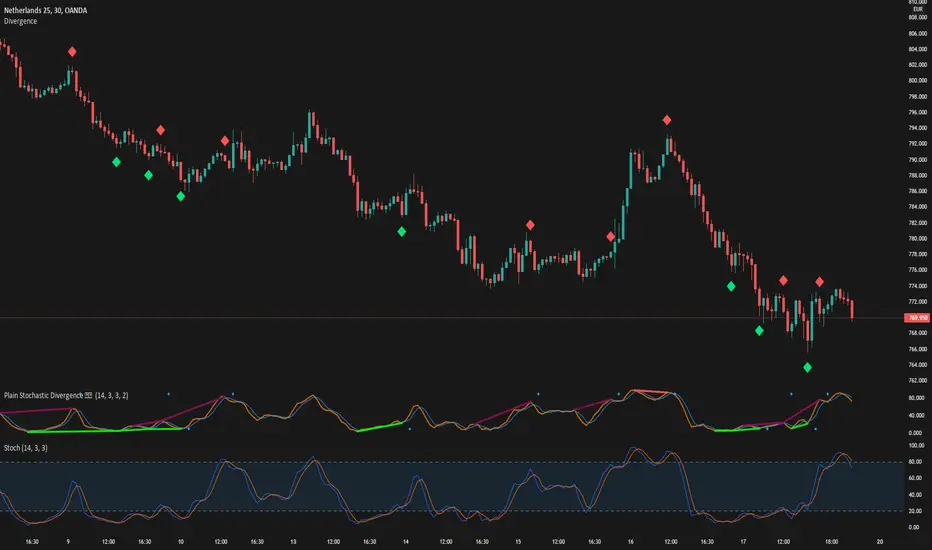
Stoch_RSI_ChartEnhanced Stochastic RSI Divergence Indicator with VWAP Filter for Charts
This custom indicator builds upon the classic Stochastic RSI to automatically detect both regular and hidden divergences. It’s designed to help traders spot potential market reversals or continuations using two methods for divergence detection (fractal‑ and pivot‑based) while offering optional VWAP filtering for confirmation.
Key Features
Stoch RSI Calculation
The indicator computes a smoothed Stoch RSI using configurable parameters for RSI length, stochastic length, and smoothing periods. An option to average the K and D lines provides a cleaner momentum view.
Divergence Detection via Fractals & Pivots
Fractal-Based Divergences:
Looks for 4-candle patterns to identify higher-highs or lower-lows in the price that are not confirmed by the oscillator, signaling potential reversals.
Pivot-Based Divergences:
Utilizes TradingView’s built-in pivot functions to find divergence conditions over adjustable pivot ranges.
Regular vs. Hidden Divergences:
Regular Divergence: Occurs when price makes a new extreme (higher high or lower low) while the Stoch RSI fails to follow suit.
Hidden Divergence: Indicates potential trend continuations when the oscillator diverges against the established price trend.
Optional VWAP Filtering
The script includes two optional VWAP filters that work as follows:
VWAP Filter on Regular Divergences:
Only confirms regular divergence signals if the current price satisfies the VWAP condition (e.g., price is above VWAP for bullish signals, below VWAP for bearish signals).
VWAP Filter on Hidden Divergences:
Similarly, hidden divergence signals are validated only when the price meets specific VWAP conditions, adding an extra layer of trend confirmation.
Customizable Alerts and Visual Labels
Easily configure divergence labels (“B” for bullish, “S” for bearish) and enable up to four alert conditions for real‑time notifications when a divergence occurs.
Credits & History:
Log RSI by @fskrypt
Divergence Detection originally by @RicardoSantos (with edits from @JustUncleL)
Further Edits by @NeoButane on August 8, 2018
Latest Edits by @FYMD on June 1, 2024

Rally Base Drop SND Pivots Strategy [LuxAlgo X PineIndicators]This strategy is based on the Rally Base Drop (RBD) SND Pivots indicator developed by LuxAlgo. Full credit for the concept and original indicator goes to LuxAlgo.
The Rally Base Drop SND Pivots Strategy is a non-repainting supply and demand trading system that detects pivot points based on Rally, Base, and Drop (RBD) candles. This strategy automatically identifies key market structure levels, allowing traders to:
Identify pivot-based supply and demand (SND) zones.
Use fixed criteria for trend continuation or reversals.
Filter out market noise by requiring structured price formations.
Enter trades based on breakouts of key SND pivot levels.
How the Rally Base Drop SND Pivots Strategy Works
1. Pivot Point Detection Using RBD Candles
The strategy follows a rigid market structure methodology, where pivots are detected only when:
A Rally (R) consists of multiple consecutive bullish candles.
A Drop (D) consists of multiple consecutive bearish candles.
A Base (B) is identified as a transition between Rallies and Drops, acting as a pivot point.
The pivot level is confirmed when the formation is complete.
Unlike traditional fractal-based pivots, RBD Pivots enforce stricter structural rules, ensuring that each pivot:
Has a well-defined bullish or bearish price movement.
Reduces false signals caused by single-bar fluctuations.
Provides clear supply and demand levels based on structured price movements.
These pivot levels are drawn on the chart using color-coded boxes:
Green zones represent bullish pivot levels (Rally Base formations).
Red zones represent bearish pivot levels (Drop Base formations).
Once a pivot is confirmed, the high or low of the base candle is used as the reference level for future trades.
2. Trade Entry Conditions
The strategy allows traders to select from three trading modes:
Long Only – Only takes long trades when bullish pivot breakouts occur.
Short Only – Only takes short trades when bearish pivot breakouts occur.
Long & Short – Trades in both directions based on pivot breakouts.
Trade entry signals are triggered when price breaks through a confirmed pivot level:
Long Entry:
A bullish pivot level is formed.
Price breaks above the bullish pivot level.
The strategy enters a long position.
Short Entry:
A bearish pivot level is formed.
Price breaks below the bearish pivot level.
The strategy enters a short position.
The strategy includes an optional mode to reverse long and short conditions, allowing traders to experiment with contrarian entries.
3. Exit Conditions Using ATR-Based Risk Management
This strategy uses the Average True Range (ATR) to calculate dynamic stop-loss and take-profit levels:
Stop-Loss (SL): Placed 1 ATR below entry for long trades and 1 ATR above entry for short trades.
Take-Profit (TP): Set using a Risk-Reward Ratio (RR) multiplier (default = 6x ATR).
When a trade is opened:
The entry price is recorded.
ATR is calculated at the time of entry to determine stop-loss and take-profit levels.
Trades exit automatically when either SL or TP is reached.
If reverse conditions mode is enabled, stop-loss and take-profit placements are flipped.
Visualization & Dynamic Support/Resistance Levels
1. Pivot Boxes for Market Structure
Each pivot is marked with a colored box:
Green boxes indicate bullish demand zones.
Red boxes indicate bearish supply zones.
These boxes remain on the chart to act as dynamic support and resistance levels, helping traders identify key price reaction zones.
2. Horizontal Entry, Stop-Loss, and Take-Profit Lines
When a trade is active, the strategy plots:
White line → Entry price.
Red line → Stop-loss level.
Green line → Take-profit level.
Labels display the exact entry, SL, and TP values, updating dynamically as price moves.
Customization Options
This strategy offers multiple adjustable settings to optimize performance for different market conditions:
Trade Mode Selection → Choose between Long Only, Short Only, or Long & Short.
Pivot Length → Defines the number of required Rally & Drop candles for a pivot.
ATR Exit Multiplier → Adjusts stop-loss distance based on ATR.
Risk-Reward Ratio (RR) → Modifies take-profit level relative to risk.
Historical Lookback → Limits how far back pivot zones are displayed.
Color Settings → Customize pivot box colors for bullish and bearish setups.
Considerations & Limitations
Pivot Breakouts Do Not Guarantee Reversals. Some pivot breaks may lead to continuation moves instead of trend reversals.
Not Optimized for Low Volatility Conditions. This strategy works best in trending markets with strong momentum.
ATR-Based Stop-Loss & Take-Profit May Require Optimization. Different assets may require different ATR multipliers and RR settings.
Market Noise May Still Influence Pivots. While this method filters some noise, fake breakouts can still occur.
Conclusion
The Rally Base Drop SND Pivots Strategy is a non-repainting supply and demand system that combines:
Pivot-based market structure analysis (using Rally, Base, and Drop candles).
Breakout-based trade entries at confirmed SND levels.
ATR-based dynamic risk management for stop-loss and take-profit calculation.
This strategy helps traders:
Identify high-probability supply and demand levels.
Trade based on structured market pivots.
Use a systematic approach to price action analysis.
Automatically manage risk with ATR-based exits.
The strict pivot detection rules and built-in breakout validation make this strategy ideal for traders looking to:
Trade based on market structure.
Use defined support & resistance levels.
Reduce noise compared to traditional fractals.
Implement a structured supply & demand trading model.
This strategy is fully customizable, allowing traders to adjust parameters to fit their market and trading style.
Full credit for the original concept and indicator goes to LuxAlgo.

MMXM ICT [TradingFinder] Market Maker Model PO3 CHoCH/CSID + FVG🔵 Introduction
The MMXM Smart Money Reversal leverages key metrics such as SMT Divergence, Liquidity Sweep, HTF PD Array, Market Structure Shift (MSS) or (ChoCh), CISD, and Fair Value Gap (FVG) to identify critical turning points in the market. Designed for traders aiming to analyze the behavior of major market participants, this setup pinpoints strategic areas for making informed trading decisions.
The document introduces the MMXM model, a trading strategy that identifies market maker activity to predict price movements. The model operates across five distinct stages: original consolidation, price run, smart money reversal, accumulation/distribution, and completion. This systematic approach allows traders to differentiate between buyside and sellside curves, offering a structured framework for interpreting price action.
Market makers play a pivotal role in facilitating these movements by bridging liquidity gaps. They continuously quote bid (buy) and ask (sell) prices for assets, ensuring smooth trading conditions.
By maintaining liquidity, market makers prevent scenarios where buyers are left without sellers and vice versa, making their activity a cornerstone of the MMXM strategy.
SMT Divergence serves as the first signal of a potential trend reversal, arising from discrepancies between the movements of related assets or indices. This divergence is detected when two or more highly correlated assets or indices move in opposite directions, signaling a likely shift in market trends.
Liquidity Sweep occurs when the market targets liquidity in specific zones through false price movements. This process allows major market participants to execute their orders efficiently by collecting the necessary liquidity to enter or exit positions.
The HTF PD Array refers to premium and discount zones on higher timeframes. These zones highlight price levels where the market is in a premium (ideal for selling) or discount (ideal for buying). These areas are identified based on higher timeframe market behavior and guide traders toward lucrative opportunities.
Market Structure Shift (MSS), also referred to as ChoCh, indicates a change in market structure, often marked by breaking key support or resistance levels. This shift confirms the directional movement of the market, signaling the start of a new trend.
CISD (Change in State of Delivery) reflects a transition in price delivery mechanisms. Typically occurring after MSS, CISD confirms the continuation of price movement in the new direction.
Fair Value Gap (FVG) represents zones where price imbalance exists between buyers and sellers. These gaps often act as price targets for filling, offering traders opportunities for entry or exit.
By combining all these metrics, the Smart Money Reversal provides a comprehensive tool for analyzing market behavior and identifying key trading opportunities. It enables traders to anticipate the actions of major players and align their strategies accordingly.
MMBM :
MMSM :
🔵 How to Use
The Smart Money Reversal operates in two primary states: MMBM (Market Maker Buy Model) and MMSM (Market Maker Sell Model). Each state highlights critical structural changes in market trends, focusing on liquidity behavior and price reactions at key levels to offer precise and effective trading opportunities.
The MMXM model expands on this by identifying five distinct stages of market behavior: original consolidation, price run, smart money reversal, accumulation/distribution, and completion. These stages provide traders with a detailed roadmap for interpreting price action and anticipating market maker activity.
🟣 Market Maker Buy Model
In the MMBM state, the market transitions from a bearish trend to a bullish trend. Initially, SMT Divergence between related assets or indices reveals weaknesses in the bearish trend. Subsequently, a Liquidity Sweep collects liquidity from lower levels through false breakouts.
After this, the price reacts to discount zones identified in the HTF PD Array, where major market participants often execute buy orders. The market confirms the bullish trend with a Market Structure Shift (MSS) and a change in price delivery state (CISD). During this phase, an FVG emerges as a key trading opportunity. Traders can open long positions upon a pullback to this FVG zone, capitalizing on the bullish continuation.
🟣 Market Maker Sell Model
In the MMSM state, the market shifts from a bullish trend to a bearish trend. Here, SMT Divergence highlights weaknesses in the bullish trend. A Liquidity Sweep then gathers liquidity from higher levels.
The price reacts to premium zones identified in the HTF PD Array, where major sellers enter the market and reverse the price direction. A Market Structure Shift (MSS) and a change in delivery state (CISD) confirm the bearish trend. The FVG then acts as a target for the price. Traders can initiate short positions upon a pullback to this FVG zone, profiting from the bearish continuation.
Market makers actively bridge liquidity gaps throughout these stages, quoting continuous bid and ask prices for assets. This ensures that trades are executed seamlessly, even during periods of low market participation, and supports the structured progression of the MMXM model.
The price’s reaction to FVG zones in both states provides traders with opportunities to reduce risk and enhance precision. These pullbacks to FVG zones not only represent optimal entry points but also create avenues for maximizing returns with minimal risk.
🔵 Settings
Higher TimeFrame PD Array : Selects the timeframe for identifying premium/discount arrays on higher timeframes.
PD Array Period : Specifies the number of candles for identifying key swing points.
ATR Coefficient Threshold : Defines the threshold for acceptable volatility based on ATR.
Max Swing Back Method : Choose between analyzing all swings ("All") or a fixed number ("Custom").
Max Swing Back : Sets the maximum number of candles to consider for swing analysis (if "Custom" is selected).
Second Symbol for SMT : Specifies the second asset or index for detecting SMT divergence.
SMT Fractal Periods : Sets the number of candles required to identify SMT fractals.
FVG Validity Period : Defines the validity duration for FVG zones.
MSS Validity Period : Sets the validity duration for MSS zones.
FVG Filter : Activates filtering for FVG zones based on width.
FVG Filter Type : Selects the filtering level from "Very Aggressive" to "Very Defensive."
Mitigation Level FVG : Determines the level within the FVG zone (proximal, 50%, or distal) that price reacts to.
Demand FVG : Enables the display of demand FVG zones.
Supply FVG : Enables the display of supply FVG zones.
Zone Colors : Allows customization of colors for demand and supply FVG zones.
Bottom Line & Label : Enables or disables the SMT divergence line and label from the bottom.
Top Line & Label : Enables or disables the SMT divergence line and label from the top.
Show All HTF Levels : Displays all premium/discount levels on higher timeframes.
High/Low Levels : Activates the display of high/low levels.
Color Options : Customizes the colors for high/low lines and labels.
Show All MSS Levels : Enables display of all MSS zones.
High/Low MSS Levels : Activates the display of high/low MSS levels.
Color Options : Customizes the colors for MSS lines and labels.
🔵 Conclusion
The Smart Money Reversal model represents one of the most advanced tools for technical analysis, enabling traders to identify critical market turning points. By leveraging metrics such as SMT Divergence, Liquidity Sweep, HTF PD Array, MSS, CISD, and FVG, traders can predict future price movements with precision.
The price’s interaction with key zones such as PD Array and FVG, combined with pullbacks to imbalance areas, offers exceptional opportunities with favorable risk-to-reward ratios. This approach empowers traders to analyze the behavior of major market participants and adopt professional strategies for entry and exit.
By employing this analytical framework, traders can reduce errors, make more informed decisions, and capitalize on profitable opportunities. The Smart Money Reversal focuses on liquidity behavior and structural changes, making it an indispensable tool for financial market success.

Time Based 3 Candle Model CRT FrameworkThe 3 Candle Model Overview:
The 3 Candle Model serves as a sophisticated framework for traders to navigate the complexities of financial markets, particularly within futures and forex trading. This guide not only elaborates on the model's key features but also emphasizes its originality and practical usefulness in the TradingView community. The core principle of the 3 Candle Model revolves around understanding how candle patterns can represent significant price ranges, offering valuable insights into potential market movements. By integrating the model with other critical trading concepts such as the Power of Three (PO3), Open-High-Low-Close (OHLC), and Turtle Soup setups, traders can enhance their ability to identify high-probability trades and achieve better trading outcomes.
Indicator includes:
3 Customizable Timeframe choices to fractally frame 3 candle models for precision
Live Timers for each timeframe to always be aware of the models timing
Parent Candle tracking on every preffered timeframe until new models parent candle is printed
Key Features of the 3 Candle Model
The 3 Candle Model primarily utilizes a three-candle structure, where the first candle establishes a price range, the second candle may act as a confirmation (often termed a "turtle soup"), and the third candle provides the breakout or continuation. This structure is pivotal in determining entry and exit points for trades, ensuring that each trading decision is backed by solid price action analysis.
OHLC Principle:
The Open-High-Low-Close (OHLC) concept is integral to the 3 Candle Model, allowing traders to analyze price action more effectively. Understanding the relationship between these four price points helps traders gauge market sentiment and potential reversals. By incorporating OHLC into the model, traders can develop a deeper understanding of market structure and its implications for future price movements.
Delivery States:
The 3 Candle Model emphasizes the importance of delivery states, which refer to the market's phase during specific time frames. Recognizing these states aids traders in determining the appropriate conditions for entering trades, particularly when combined with the power of three and candle range patterns. This understanding is crucial for positioning trades in alignment with market momentum.
High Probability Setups:
By aligning the 3 Candle Model with inside bar setups, traders can optimize their strategies for high-probability outcomes. This approach capitalizes on the inherent fractal nature of price movements, where previous patterns repeat at different scales. The combination of the model and inside bar setups enhances the trader's toolkit, allowing for more strategic trade placements.
Turtle Soup Formation:
The 3 Candle Model intricately connects with the Turtle Soup concept, which focuses on false breakouts. Identifying these formations at critical levels enhances the trader's ability to anticipate reversals or continuation patterns. The timing of these setups, particularly during specified times like 3:00 AM, 6:00 AM, 9:00 AM, and 1:00 PM, is crucial for maximizing trade success.
Using the 3 Candle Model in Trading
Integration with PO3:
The Power of Three (PO3) is a fundamental aspect of the 3 Candle Model that emphasizes the significance of three distinct stages of price delivery. Traders can leverage this principle by observing the initial range, confirming patterns, and executing trades during the third phase, leading to higher risk-to-reward ratios. This three-stage approach enhances a trader's ability to make informed decisions based on market behavior.
Targeting Midpoints:
Successful application of the 3 Candle Model involves targeting the midpoints of identified ranges. This practice not only provides strategic entry points but also enhances the probability of reaching desired profit levels. By targeting these midpoints, traders can refine their exit strategies and manage risk more effectively.
Aligning with Market Timing:
Timing is everything in trading. By synchronizing the 3 Candle Model setups with the aforementioned key timeframes, traders can better position themselves to exploit market dynamics. This alignment also facilitates the identification of high-quality trades that exhibit strong potential for profitability.
Prioritizing A+ Setups:
By focusing on the 3 Candle Model and its associated concepts, traders can prioritize A+ setups that exhibit a strong alignment of factors. This methodical approach enhances the quality of trades taken, leading to improved overall performance. By cultivating a strategy centered on high-probability setups, traders can maximize their return on investment.
Ensuring Originality and Usefulness
To meet the TradingView community guidelines, it is essential that this script is both original and useful. The 3 Candle Model, in its essence, is designed to provide traders with a unique perspective on market movements, free from generic or rehashed strategies. This tool integrates unique interpretations of the three-candle model and the associated strategies that are distinctly articulated and innovative.
Practical Applications: there are many practical applications of the 3 Candle Model in various trading contexts. This model in conjunction with other strategies to cultivate high-probability trade setups that can enhance performance across diverse market conditions.
Educational Value: This script is crafted with educational value in mind, providing insights that extend beyond mere trading signals. It encourages users to develop a deeper understanding of market mechanics and the interplay between price action, time, and trader psychology.
Conclusion
The 3 Candle Model provides a comprehensive framework for traders to enhance their trading strategies in the futures and forex markets. By understanding and applying the principles of this model alongside the Power of Three, OHLC concepts, and Turtle Soup formations, traders can significantly improve their ability to identify high-probability trades. The emphasis on timing, delivery states, and alignment of ranges ensures that traders are well-equipped to navigate the complexities of market movements, ultimately leading to more consistent and rewarding trading outcomes.
As trading involves risk, it is essential for traders to utilize these principles judiciously and maintain a disciplined approach to their trading strategies. By adhering to the TradingView community guidelines and emphasizing originality, usefulness, and detailed descriptions, this 3 Candle Model script stands as a valuable resource for traders seeking to refine their skills and achieve greater success in the financial markets.
Through this detailed exploration of the 3 Candle Model, traders will not only learn to recognize and exploit key patterns in price action but also appreciate the interconnectedness of various trading strategies that can significantly enhance their performance and profitability.
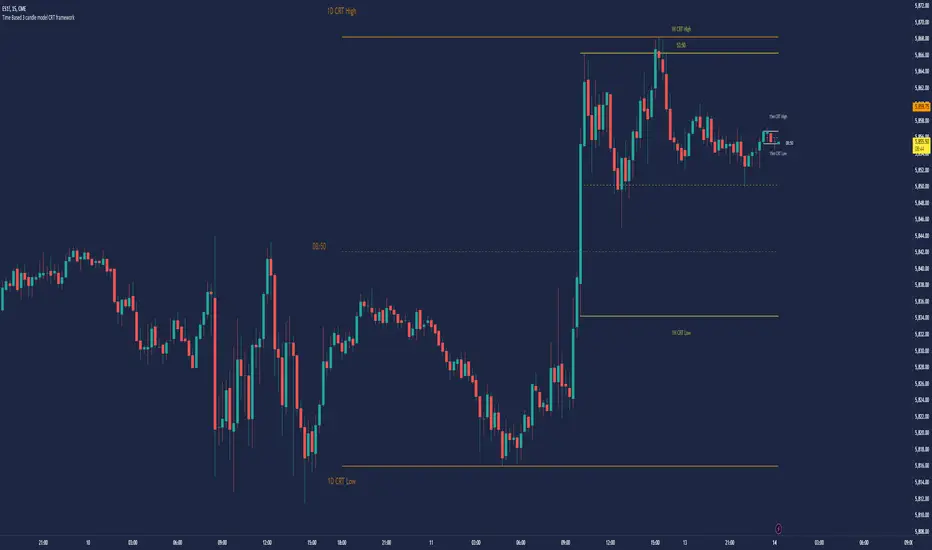
Divergence Signal [TradingFinder] RSI & MACD Reversal On Swing🔵 Introduction
Sometimes in analyzing price charts using indicators, you may observe a discrepancy. For instance, while the price of stocks, currencies, or commodities is increasing, the indicator shows a decrease. Such a phenomenon in technical analysis is termed "divergence." Divergences are categorized into three types based on their formation and the prediction they make about the continuation of the price trend: "Regular Divergence," "Hidden Divergence," and "Time Divergence."
🟣 Important :
• This indicator exclusively identifies regular divergences since its primary function is to detect reversal points.
• This indicator identifies divergences using three indicators: "Moving Average Convergence Divergence" (MACD), "Relative Strength Index" (RSI), and "Awesome Oscillator" (AO). The user can choose each of these indicators in the settings using the "Divergence Detection Method" dropdown menu for identifying divergences. These settings are by default set to the MACD mode.
🔵Types of Divergence
Divergences, as mentioned, offer different predictions about the continuation of price trends. Hence, they have various types. We will focus on explaining regular divergences based on this indicator.
🟣 Regular Divergence(RD) :
Regular divergence is a situation arising from contradictory behavior between the indicator and the price chart at the end of a trend. By identifying regular divergences, we anticipate a change in trend direction resembling a reversal pattern.
Regular divergence has two types based on the trend and prediction:
Negative Regular Divergence (RD-) :
This type occurs between two price peaks at the end of an uptrend. Despite forming a new high, the indicator fails to recognize it, indicating a negative regular divergence. The likelihood of a subsequent downtrend is high. Negative divergence suggests strong selling pressure and weak buying power, portraying an unfavorable future for the stock.
Positive Regular Divergence (RD+) :
In contrast, positive regular divergence happens at the end of a downtrend and between two price troughs. As depicted in the chart, although the price forms a new low, the indicator doesn't acknowledge it. Positive regular divergence indicates robust buying pressure and weak selling power. Upon identifying positive divergence in the chart, we expect a price increase for the stock under review
🔵 How to Use
Information from the indicator is displayed in two ways: Table and Label.
🟣 Table : The table displays information about the latest divergence. This includes the type of divergence, existence or absence of divergence, consecutive divergences, divergence quality, and change in indicator phase.
Type Divergence : Indicates the type of divergence, which can be either "Bullish Divergence" or "Bearish Divergence."
Exist : Indicates the presence of divergence with a "+" sign and absence with a "-" sign. A green color is used for bullish divergence and red for bearish divergence.
Consecutive : Shows the number of consecutive divergences. For example, if there are 3 consecutive divergences, the number 3 is displayed.
Divergence Quality : Displays the quality of the divergence based on the number of consecutive divergences. If there is 1 divergence, the quality is "Normal"; for 2 divergences, it's "Good"; and for 3 or more divergences, it's "Strong."
Change Phase Indicator : Indicates whether a phase change in the indicator has occurred with "+" for yes and "-" for no.
🟣 Label : Unlike the table, which only shows information about the latest divergence, labels display information about each divergence at the point where it occurs. The information includes the type of divergence, detection method, divergence quality, consecutive divergences, and change in phase indicator. The selected method of detection is also displayed. For example, if the chosen method is the "AO" indicator, the label will show "Method: AO."
🔵 Settings
Fractal Period : Determines the period of swings. The minimum and default value is 2.
Divergence Detect Method : Selects the indicator (MACD, RSI, or AO) used for detecting divergences. The default indicator is MACD.
Show Fractal : Chooses whether to display fractals or not. The default is "No."
Show Table : Determines whether to display the table or not. The default is "Yes."
Show Label : Chooses whether to display labels or not. The default is "Yes."
Label Size : Adjusts the size of the labels from "Tiny" to "Large."

Synthetic Price Action GeneratorNOTICE:
First thing you need to know, it "DOES NOT" reflect the price of the ticker you will load it on. THIS IS NOT AN INDICATOR FOR TRADING! It's a developer tool solely generating random values that look exactly like the fractals we observe every single day. This script's generated candles are as fake as the never ending garbage news cycles we are often force fed and expected to believe by using carefully scripted narratives peddled as hypnotic truth to psychologically and emotionally influence you to the point of control by coercion and subjugation. I wanted to make the script's synthetic nature very clear using that analogy, it's dynamically artificial. Do not accidentally become disillusioned by this scripts values, make trading decisions from it, and lastly don't become victim to predatory media magic ministry parrots with pretty, handsome smiles, compelling you to board their ferris wheel of fear. Now, on to the good stuff...
BACKSTORY:
Occasionally I find myself in situations where I have to build analyzers in Pine to actually build novel quantitative analytic indicators and tools worthy of future use. These analyzers certainly don't exist on this platform, but usually are required to engineer and tweak algorithms of the highest quality with the finest computational caliber. I have numerous other synthesizers to publish besides this one.
For many reasons, I needed a synthetic environment to utilize the analyzers I built in Pine, to even pursue building some exotic indicators and algorithms. Pine doesn't allow sourcing of tuples. Not to mention, I required numerous Pine advancements to make long held dreams into tangible realities. Many Pine upgrades have arrived and MANY, MANY more are in need of implementation for all. Now that I have this, intending to use it in the future often when in need, you can now use it too. I do anticipate some skilled Pine poets will employ this intended handy utility to design and/or improved indicators for trading.
ORIGIN:
This was inspired by the brilliance from the world renowned ALGOmist John F. Ehlers, but it's taken on a completely alien form from its original DNA. Browsing on the internet for something else, I came across an article with a small code snippet, and I remembered an old wish of mine. I have long known that by flipping back and forth on specific tickers and timeframes in my Watchlist is not the most efficient way to evaluate indicators in multiple theatres of price action. I realized, I always wanted to possess and use this sort of tool, so... I put it into Pine form, but now have decided to inject it with Pine Script steroids. The outcome is highly mutable candle formations in a reusable mutagenic package, observable above and masquerading as genuine looking price candles.
OVERVIEW:
I guess you could call it a price action synthesizer, but I entitled it "Synthetic Price Action Generator" for those who may be searching for such a thing. You may find this more useful on the All or 5Y charts initially to witness indication from beginning (barstate.isfirst === barindex==0) to end (last_bar_index), but you may also use keyboard shortcuts + + to view the earliest plottable bars on any timeframe. I often use that keyboard shortcut to qualify an indicator through the entirety of it's runtime.
A lot can go wrong unexpectedly with indicator initialization, and you will never know it if you don't inspect it. Many recursively endowed Infinite Impulse Response (IIR) Filters can initialize with unintended results that minutely ring in slightly erroneous fashion for the entire runtime, beginning to end, causing deviations from "what should of been..." values with false signals. Looking closely at spg(), you will recognize that 3 EMAs are employed to manage and maintain randomness of CLOSE, HIGH, and LOW. In fact, any indicator's barindex==0 initialization can be inspected with the keyboard shortcuts above. If you see anything obviously strange in an authors indicator, please contact the developer if possible and respectfully notify them.
PURPOSE:
The primary intended application of this script, is to offer developers from advanced to even novice skill levels assistance with building next generation indicators. Mostly, it's purpose is for testing and troubleshooting indicators AND evaluating how they perform in a "manageable" randomized environment. Some times indicators flake out on rare but problematic price fluctuations, and this may help you with finding your issues/errata sooner than later. While the candles upon initial loading look pristine, by tweaking it to the minval/maxval parameters limits OR beyond with a few code modifications, you can generate unusual volatility, for instance... huge wicks. Limits of minval= and maxval= of are by default set to a comfort zone of operation. Massive wicks or candle bodies will undoubtedly affect your indication and often render them useless on tickers that exhibit that behavior, like WGMCF intraday currently.
Copy/paste boundaries are provided for relevant insertion into another script. Paste placement should happen at the very top of a script. Note that by overwriting the close, open, high, etc... values, your compiler will give you generous warnings of "variable shadowing" in abundance, but this is an expected part of applying it to your novel script, no worries. plotcandle() can be copied over too and enabled/disabled in Settings->Style. Always remember to fully remove this scripts' code and those assignments properly before actual trading use of your script occurs, AND specifically when publishing. The entirety of this provided code should never, never exist in a published indicator.
OTHER INTENTIONS:
Even though these are 100% synthetic generated price points, you will notice ALL of the fractal pseudo-patterns that commonly exist in the markets, are naturally occurring with this generator too. You can also swiftly immerse yourself in pattern recognition exercises with increased efficiency in real time by clicking any SPAG Setting in focus and then using the up/down arrow keys. I hope I explained potential uses adequately...
On a personal note, the existence of fractal symmetry often makes me wonder, do we truly live in a totality chaotic universe or is it ordered mathematically for some outcomes to a certain extent. I think both. My observations, it's a pre-deterministic reality completely influenced by infinitesimal amounts of sentient free will with unimaginable existing and emerging quantities. Some how an unknown mysterious mechanism governing the totality of universal physics and mathematics counts this 100.0% flawlessly and perpetually. Anyways, you can't change the past that long existed before your birth or even yesterday, but you can choose to dream, create, and forge the future into your desires and hopes. As always, shite always happens when your not looking for it. What you choose to do after stepping in it unintentionally... is totally up to you. :) Maybe this tool and tips provided will aid you in not stepping in an algo cachucha up to your ankles somehow.
SCRIPTING LESSONS PORTRAYED IN THIS SCRIPT:
Pine etiquette and code cleanliness
Overwrite capabilities of built-in Pine variables for testing indicators
Various techniques to organize Settings panel while providing ease of adjustment utility
Use of tooltip= to provide users adequate valuable information. Most people want to trade with indicators, not blindly make adjustments to them without any knowledge of their intended operation/effects
When available time provides itself, I will consider your inquiries, thoughts, and concepts presented below in the comments section, should you have any questions or comments regarding this indicator. When my indicators achieve more prevalent use by TV members , I may implement more ideas when they present themselves as worthy additions. Have a profitable future everyone!

DivergenceLibrary "Divergence"
Calculates a divergence between 2 series
bullish(_src, _low, depth) Calculates bullish divergence
Parameters:
_src : Main series
_low : Comparison series (`low` is used if no argument is supplied)
depth : Fractal Depth (`2` is used if no argument is supplied)
Returns: 2 boolean values for regular and hidden divergence
bearish(_src, _high, depth) Calculates bearish divergence
Parameters:
_src : Main series
_high : Comparison series (`high` is used if no argument is supplied)
depth : Fractal Depth (`2` is used if no argument is supplied)
Returns: 2 boolean values for regular and hidden divergence
I created this library to plug and play divergences in any code.
You can create a divergence indicator from any series you like.
Fractals are used to pinpoint the edge of the series. The higher the depth, the slower the divergence updates get.
My Plain Stochastic Divergence uses the same calculation. Watch it in action.