TideMasterThe TideMaster is an alternative to the classic moving average, providing a volatility channel around its centerline. The idea of such envelope has been popularized by many technicians such as Jake Bernstein and Jeffrey Kennedy.
The channel creates a virtual S/R zone which is ideal trend following and pullback entries after impulsive movements. It also acts as a tool to avoid price whipsaws and to provide a simple heuristic for entry and stop loss placement within a moving average system.
This indicator has the following unique features:
- Gradient Color Centerline to track the moving average slope/direction.
- Gradient Color Volatility Channel with adjustable width.
- 5 Moving Average Types: EMA,SMA,HMA,WMA & VWMA.
Enjoy!
ابحث في النصوص البرمجية عن "Fractal"

Up/Down Volume + DeltaThis simple script is a modification of Tradingview's Up/Down Volume. In this case the delta between the buys and sells is plotted in columns style above the regular up/down volume columns. This gives a better visual of the dominant volume and is useful to spot divergences in tops and bottoms.
The indicators uses data from lower timeframe volumes. By default the lowest timeframe it will use is 1m, but for those that have a premium account you can try using a custom LTF set to seconds when scalping on the 1m chart.
Enjoy :)

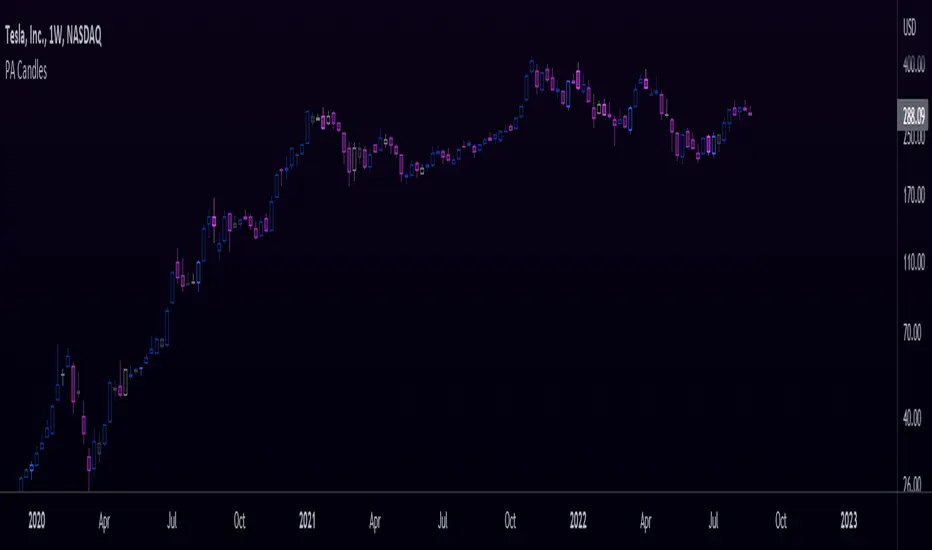
Price Action CandlesThis simple script provides a visual aid for price action traders by coloring outside & inside candles, which in effect leaves the trader with 6 possible candle colors:
-Regular bullish candle
-Outside bullish candle
-Inside bullish candle
-Regular bearish candle
-Outside bearish candle
-Inside bearish candle
These candlesticks may provide powerful signals when used in conjunction with key levels, market structure and chart patterns.
Make sure to disable the regular candlesticks (body, borders and wicks) in the symbol tab inside the configuration menu!
Hope it can help someone!
Hull Volume WavesInspired by the works of David Weis, this indicator is an alternative to his classic Weis Volume Waves.
As the name implies, this indicator uses a Hull Moving Average to detect price swings, and calculates the cumulative volume for each of them, separating the up swings from the down swings.
The chosen length of the HMA determines the size of each swing, meaning lower lengths will detect microswings while higher lengths will only include the main swings.
The length of each swing also determines the color of the upward and downward waves, and you can choose 2 colors each to generate a bullish and bearish gradient.
Extreme values are highlighted in the background. The indicator will compare the current up wave to the last N up volumes, or the current down wave to the last N down volumes. The lookback length can be changed in the menu.
I hope you find it useful!

Trade Manager Pro - Quick Position Sizing This script allows the user to select directly on the chart the entry time/candle for a trade, its entry price, stop loss price and take profit price, and will quickly calculate the position size for the trade.
Some of the parameters that can be established by the trader in the indicator settings include the following:
-Account Size
-Leverage Multiple
-Risk % per trade
-% Trading Fee
A table with the outputs will be shown to the right of the chart, showing the following information:
-Margin used for the trade
-Leverage
-Total position size (Margin*Leverage)
-Position Type (Long or Short)
-Trading Fee $
-Stop Loss %
-Stop Loss $
-Take Profit %
-Take Profit $
-Risk/Reward Ratio
Note on its usage: When changing timeframes or tickers its better to exit the indicator and add it again to the chart, since TV doesnt reset its input functions when changing these.
Happy trading!!

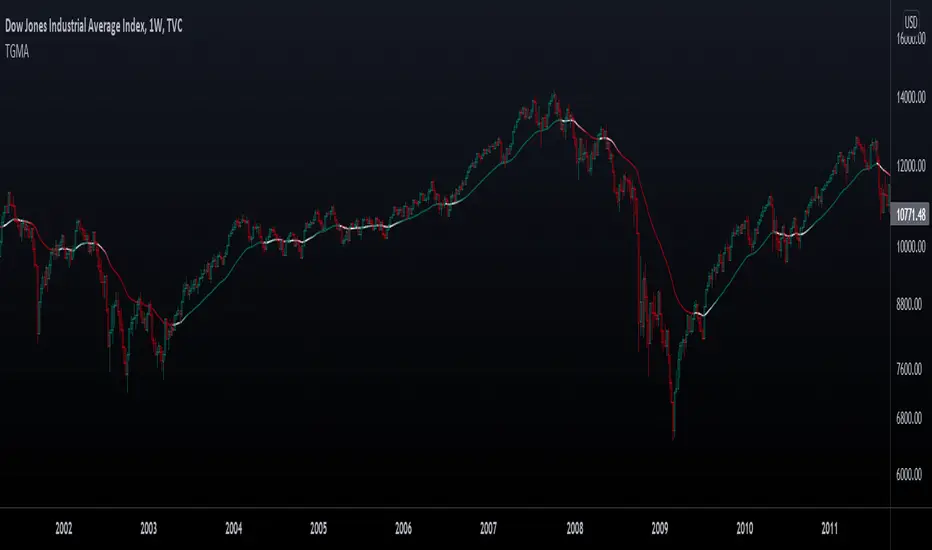
Trend Gradient Moving Average This moving average uses a gradient function which calculates the number of advances/declines of the moving average to change the intensity of the colors, meaning a longer trend in either direction will show a stronger color. You can choose 3 colors to build the gradient: a bullish, bearish & neutral/transition color. The number of steps chosen will change the speed of color change, with a lower number of steps meaning a faster transition and viceversa.
Furthermore, you can choose between many different types of moving averages:
-SMA (Simple Moving Average)
-EMA (Exponential Moving Average)
-RMA (Rolling Moving Average)
-WMA (Weighted Moving Average)
-HMA (Hull Moving Average)
-VWMA (Volume Weighted Moving Average)
-TMA (Triangular Moving Average)
Enjoy!
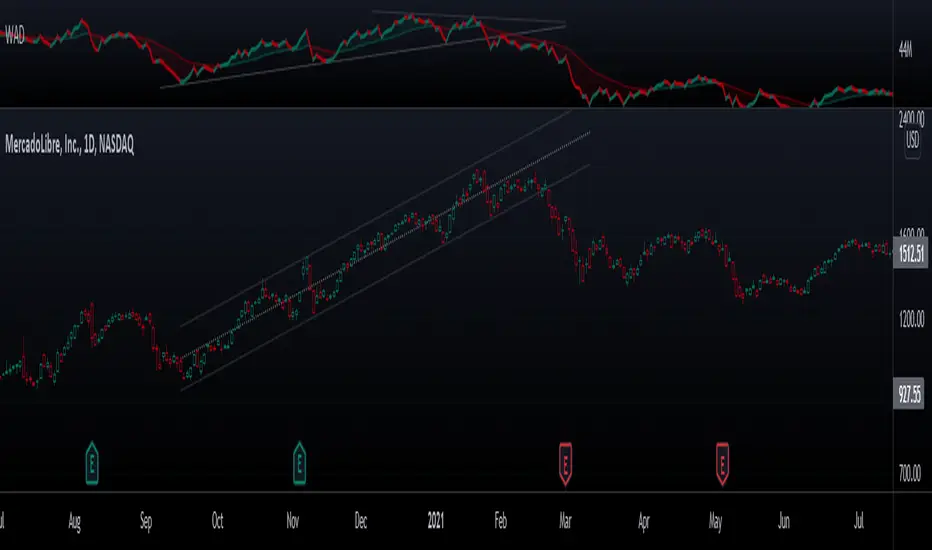
Williams Accumulation/DistributionThis is an indicator described by Larry Williams in one of his books. Larry won the 1987 World Cup Championship of Futures Trading, where he turned $10,000 to over $1,100,000 in a 12-month competition with real money.
Larry used this indicator to track divergences between price action and volume, which he called patterns of accumulation (bullish divergence) and distribution(bearish divergence). Its logic is similar to On Balance Volume(OBV), where it accumulates up and down volume in a single line, but also takes into account the size of the candle in its calculation, by taking the difference between the open and close, and the high and the low.
Enjoy!
Advanced VolumeThis simple indicator improves upon the built in volume indicator by adding the following:
-Option to use an EMA instead of SMA
-Advanced Coloring: Lighter bars show growing volume, darker bars show falling volume. Gray bars show very low relative volume (less than or equal to 50% of the moving average), while bars which have a highlighted background have a high relative volume( you can choose the threshold level, default is 2 times the RVOL).
Enjoy!

FiboDonchianDonchian channels were developed by Richard Donchian, the father of trend following. The two outer bands are plotted as the highest high and lowest low for a set period of time.
In the FiboDonchian, the channel is divided into 3 zones according to Fibonacci levels:
0-0.382 (Bullish Zone)
0.382-0.618 (Neutral Zone)
0.618-1(Bearish Zone)
These levels will usually act as support and resistance during trends, and will reverse depending on the direction of the trend (e.g. in an uptrend the .382 is above the .5 and during a downtrend it is below).
An option to color candles according to the trend is given, with the following logic:
-During uptrends, candles will turn bullish when a new high is made and will remain in this state as long as price closes in the upper zone. Below this zone price turns neutral until a new high or low is made.
-During downtrends, candles will turn bearish when a new low is made and will remain like this provided that price closes in the lower zone. Above this zone price turns neutral until a new low or high is made.
Enjoy!!

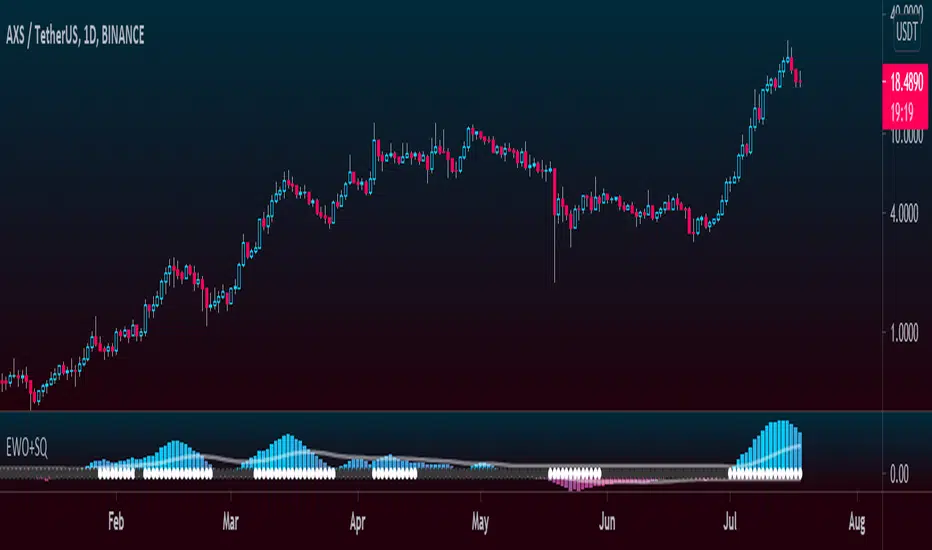
Elliott Wave Oscillator + TTM SqueezeThe Elliott Wave Oscillator enables traders to track Elliott Wave counts and divergences. It allows traders to observe when an existing wave ends and when a new one begins. It works on the basis of a simple calculation: The difference between a 5-period simple moving average and a 34-period simple moving average.
Included with the EWO are the breakout bands that help identify strong impulses.
To further aid in the detection of explosive movements I've included the TTM Squeeze indicator which shows the relationship between Keltner Channels & Bollinger Bands, wich highlight situations of compression/low volatility, and expansion/high volatility. The dark dots indicate a squeeze, and white dots indicates the end of such squeeze and therefore the start of an expansion.
Enjoy!
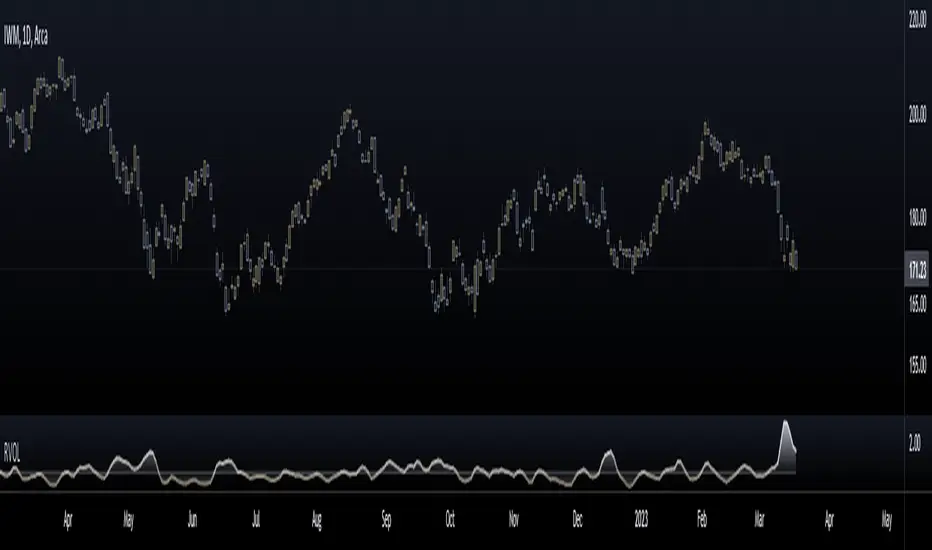
Relative Volume (RVOL)Relative Volume is calculated by taking the ratio of current volume relative to a moving average of your choice. It gives you a quick way to see how much volume is involved in the current movement relative to a recent period.
Features:
-Customizable Moving Average: You can choose the period (default is 21) and type (SMA or EMA)
-Customizable base level: Default setting is 1.
-Smoothing option: Uses a Hull moving average to smooth out the RVOL area plot, by default its turned off.
Enjoy!
Keltner TrendThis indicator takes the concept of Keltner Channels and uses them as a trend following system by using a deviation band of 1 ATR, such that when the price closes above the upper band a bull trend is predicted to follow, and when the price closes below the lower band the start of a bear trend is assumed.
Only 1 band is plotted at all times depending on the bias of the trend.
Default settings are a 21 EMA as a centerline with a 13 period ATR.
Enjoy!

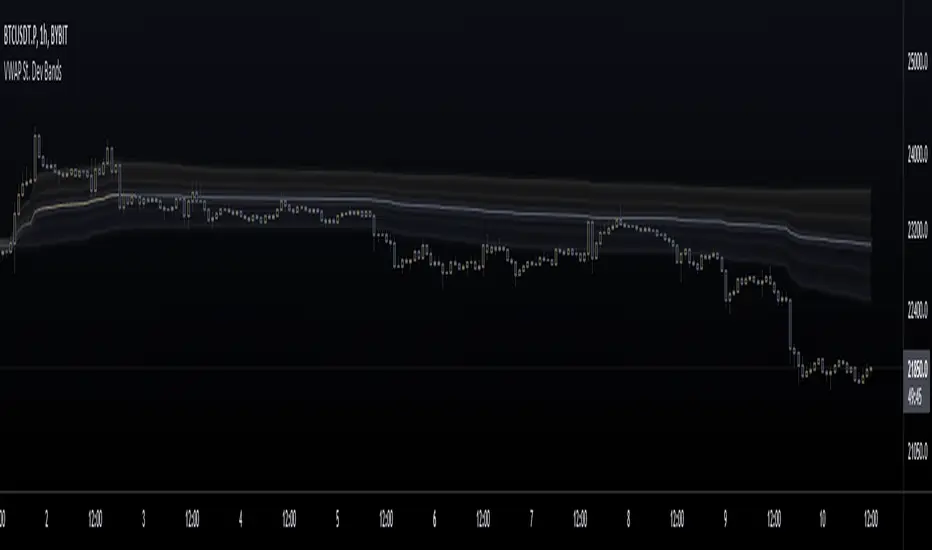
VWAP St. Dev BandsThis indicator allows you to add up to 3 volatility bands to VWAP based on its Standard Deviation.
Best use is for intraday but you can choose higher timeframes too.
For day trading a band of 3 standard deviations usually works well as an overbought/oversold region, allowing for mean reversion trading, but you are free to come up with your own strategies.
Enjoy!
Log Scale Linear RegressionThis indicator is basically the standard linear regression but adjusted to be suitable for log scale.
You can use 2 different standard deviation values, choose the data source and lookback length.
The colors are chosen directly on the main menu.
Enjoy!

Cumulative Volume OscillatorCVO: Cumulative Volume Oscillator allows you to choose between 3 types of oscillators based on volume indicators:
-OBV (On Balance Volume)
-CVD (Cumulative Volume Delta)
-PVT (Price Volume Trend)
Being a volume based oscillator this indicator allows for the detection of divergences between price action and volume, ideal for predicting reversals.
As an oscillator you can choose the length of the fast & slow EMAs, and a signal line is provided for trend following.

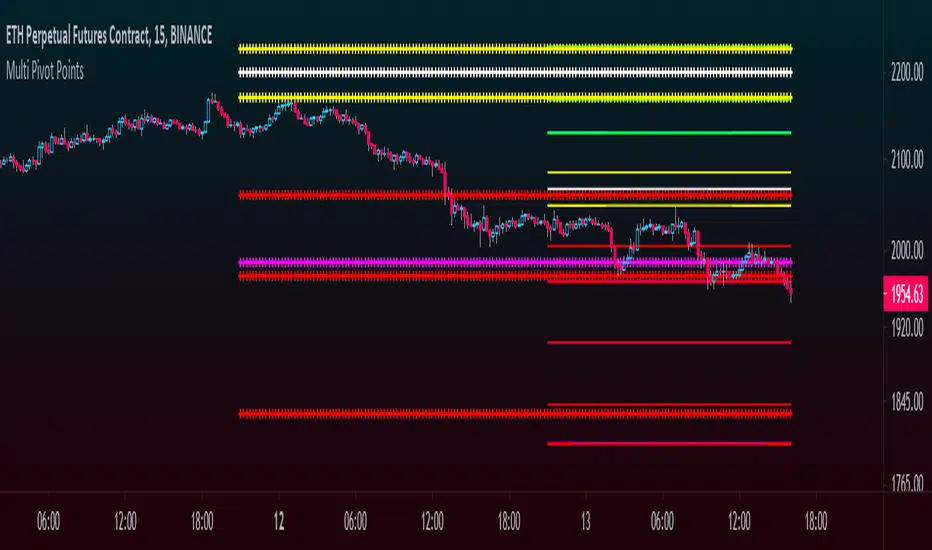
Multi Pivot Points - All in One IndicatorThis multi pivot indicator allows you to plot and overlay different types of pivot points:
-Fibonacci
-Floor Traders
-Camarilla
In addition to this, you can plot pivots from two different timeframes of your choice, for example the daily & weekly pivots, monthly & yearly, etc.
-You can select the linestyle, width and color of each pivot type for easy recognition of levels.
-You can choose to show only the current set of pivots or you can show the historical levels too.
This indicator allows traders to search for high probability targets or support and resistance zones via the confluence of both different pivot types and timeframes. These levels can work for either day traders or longer terms traders.
In the case of Fibonacci levels these can be chosen in the menu.
Enjoy!!
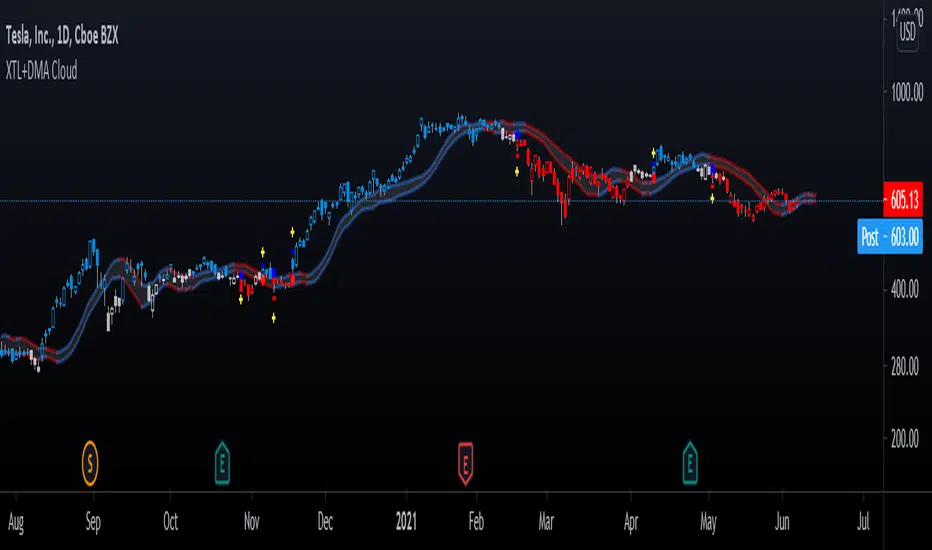
Advanced GET: Tom Joseph's XTL, DMA Cloud & Breakout SignalsThe Expert Trend Locator ( XTL ) was developed by Tom Joseph to identify major trends, similar to elliott wave 3 type swings.
Blue bars are bullish and indicate a potential upwards impulse.
Red bars are bearish and indicate a potential downwards impulse.
White bars indicate no trend is detected at the moment.
Added to the indicator is the recommended use to enter a position, as explained by Tom Joseph in his book Applying Technical Analysis:
Once a blue or red bar appears, the indicator signals an entry level, a stop loss level and two target levels (2nd is optional).
The levels can be shown until a new signal emerges or just above/below the breakout bar.
Finally, a cloud formed by two displaced moving averages (DMA) is included, which allow the trend to continue its momentum. During an uptrend the lower moving average could serve as a trailing stop, and during a downtrend the upper moving average could serve as the trailing stop.
Enjoy!
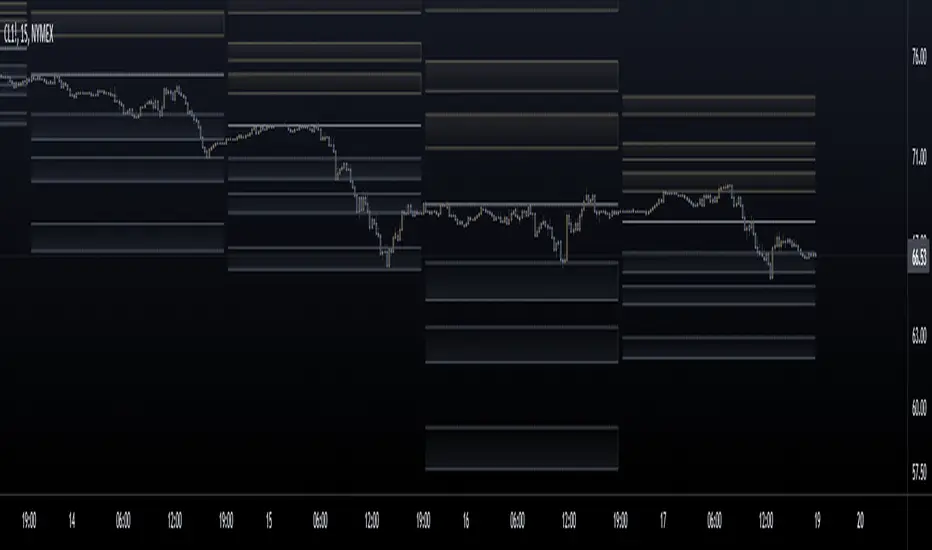
Fibonacci Pivot ZonesFibonacci Pivot Zones make use of the average price between the high, low & close of the previous session, while adding deviations based on Fibonacci numbers to form support and resistance zones, which can be used as targets for intraday and swing trading.
You can select the timeframe for the zones, for example 12 hour pivots to trade in 15m timeframe, or even monthly pivots to trade on the daily timeframe.
You can choose the different fibonacci levels on the menu, by default these are:
0.382
0.618
0.782
1
Enjoy!
[FT]volume confirmation
I was inspired by an article talking about volume confirmation on breakouts. I find volume in isolation to be misleading at times. But I do like the concept of VWAP. What if you had a moving average influenced by volume ( VWAP ), and another moving average not influenced by volume ( SMA ) both calculated using the same price inputs and period length. If you compare the two and take their difference, the resulting histogram would be just the volume influence. This is not tested or vetted in any way. Maybe it'll inspire someone else to do more with it. I made it into a percentage scale, just to potentially better show the context of the range.
Enjoy.

Highlight Selected PeriodEdit and put what month or week you want and it will highlight all january's or all second weeks of the month to try and see if there are any patterns.

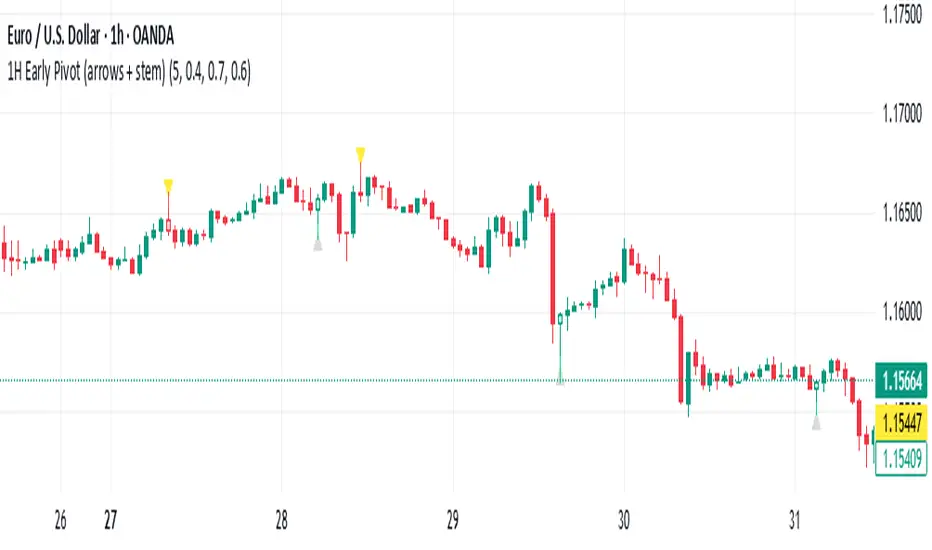
1H Early Pivot (arrows + stem) by Pastor CarrThis indicator helps to find early pivot points on the IH chart.

ICT SMT Divergence Lines - EnhancedThis indicator identifies and highlights Smart Money Technique (SMT) divergence between two user-selected symbols across any timeframe. It compares the last two completed candles of both symbols and marks potential SMT signals only when market context aligns with smart money principles.
⚡ Key Features
✅ SMT Bullish Signal
Symbol 1 forms a lower low compared to its prior candle.
Symbol 2 forms a higher low compared to its prior candle.
The previous candle on the chart was bearish (close < open).
✅ SMT Bearish Signal
Symbol 1 forms a higher high compared to its prior candle.
Symbol 2 forms a lower high compared to its prior candle.
The previous candle on the chart was bullish (close > open).
✅ Visual Representation
Draws a clean, subtle line between the two SMT candles — green for bullish SMT and red for bearish SMT — making divergence easy to spot.
Optional small triangle markers above or below the bar where SMT is detected.
Old lines are automatically removed to keep the chart uncluttered.
✅ Multi-timeframe compatible
Works on any chart timeframe.
Compares the last two completed candles in the current chart timeframe, or can be adapted for a fixed higher timeframe.
