CandelaCharts - X Model📝 Overview
The X Model Indicator is a sophisticated trading strategy designed to identify high-probability entry points for both long and short positions. It utilizes a combination of key market levels, price action patterns, and multi-timeframe analysis to generate precise signals.
The model offers tailored entry conditions for both long and short trades, ensuring optimized risk-reward setups.
📦 Features
Previous Day High/Low (ERL): Resistance level from the previous day’s high/low.
H1 Bullish/Bearish FVG (IRL): A Bullish Fair Value Gap (FVG) on the 1-hour chart indicating price target potential.
m15 MSS / SMT: Market Structure Shift and Smart Money Technique on the 15-minute chart confirming the market's direction.
Only Short/Long Above/Below 00:00: Triggers short positions only after midnight to avoid potential market noise from earlier sessions.
⚙️ Settings
Core
Status: Filter models based on status
Bias: Controls what model type will be displayed, bullish or bearish
Fractal: Controls the timeframe pairing will be used
Sweep: Shows the sweep that forms a model
I-sweep: Controls the visibility of invalidated sweeps
D-purge: Plots the double purge sweeps
CISD: Displays the Change In State of Delivery for a model
Labels: Adjust the HTF candle label size
History
History: Controls the amount of past models displayed on the chart
HTF
Candles: Controls the number of HTF candles that will be visible on the chart
Open: Highlights with a line the open price of the current HTF candle
Show True Day Open: Display True Day Open line
Offset: Controls the distance of HTF from the current chart
Space: Controls the space between HTF candles
Size: Controls the size of HTF candles
LTF
H/L Line: Displays on the LTF chart High and Low of each HTF candle
O/C Line: Displays on the LTF chart Open and Close of each HTF candle
PD Arrays
PD Array: Displays ICT PD Arrays
CE Line: Style the equilibrium line of the PD Array
Border: Style the border of the PD Array
Projections
StDev: Controls standard deviation available levels
Labels: Controls the size of standard deviation levels
Anchor: Controls the anchor point of standard deviation levels (wick, body)
Lines: Controls the line widths and color of standard deviation levels
Dashboard
Panel: Display information about the current model
💡 Framework
The model incorporates multiple timeframe alignments for increased precision and reliability. The following timeframes are utilized for a comprehensive view of the market:
1m - 5m - 1H
2m - 15m - 4H
3m - 20m - 8H
5m - 30m - 12H
15m - 1H - 1D
1H - 4H - 1W
4H - 1D - 1M
1D - 1W - 3M
1W - 1M - 12M
These alignments ensure that the model captures both short-term price movements and longer-term trends, allowing for well-informed decision-making across various market conditions.
The X Model Indicator employs a precise set of conditions for both short and long entries, designed to capture optimal market opportunities based on key price levels, market imbalances, and institutional activity. These conditions combine multiple timeframes, price action patterns, and market sentiment to enhance the accuracy of entry signals.
Here's how each condition works:
Short Entry Conditions:
Previous Day High (ERL): The previous day’s high acts as a significant resistance level for the market. A price rejection or failure to break above this level indicates a potential short opportunity, as the market may reverse or consolidate.
H1 Bullish FVG (IRL): A Bullish Fair Value Gap (FVG) on the 1-hour chart highlights an area of price imbalance. This signals that the price may attempt to move back into this gap, providing a high-probability short entry if combined with other bearish signals.
m15 MSS / SMT: On the 15-minute chart, the Momentum Shift (MSS) and Smart Money Tool (SMT) indicators are used to confirm market manipulation or shift in momentum. If these indicators show bearish market activity, they strengthen the case for a short position.
Only Short Above 00:00: To avoid noise from earlier market sessions, the model only triggers short entries after midnight (00:00), ensuring that the trade occurs during a more stable, predictable phase of the trading day.
Long Entry Conditions:
Previous Day Low (ERL): The previous day’s low serves as a support level, marking an area where the price is likely to bounce. If the price pulls back and tests this level, it suggests a high-probability long entry, especially when other indicators align.
H1 Bearish FVG (IRL): A Bearish Fair Value Gap (FVG) on the 1-hour chart shows an imbalance to the downside, where the price may reverse and move upwards. This gap is often seen as an opportunity for the price to return to equilibrium, presenting a favorable long entry.
m15 MSS / SMT: The Momentum Shift (MSS) and Smart Money Tool (SMT) on the 15-minute chart help identify the market’s true intentions. A shift towards bullish momentum or signs of smart money accumulation increases the likelihood of a successful long entry.
Only Long Below 00:00: To focus on the market’s early session dynamics, the model only triggers long entries before midnight (00:00), capturing potential moves during quieter periods when the price can show clearer directional trends.
⚡️ Showcase
Introducing X Model is a powerful trading tool designed to elevate your market analysis and boost your trading success.
Bearish Model
Bullish Model
Unlock your full trading potential and experience the difference with X Model — your ultimate tool for smarter, more informed trading decisions.
🚨 Alerts
This script offers alert options for all model types. The alerts need to be setup manually from Tradingview.
Bearish Model
A bearish model alert is triggered when a model forms, signaling a high sweep on HTF and CISD on LTF.
Bullish Model
A bullish model alert is triggered when a model forms, signaling a low sweep on HTF and CISD on LTF.
⚠️ Disclaimer
These tools are exclusively available on the TradingView platform.
Our charting tools are intended solely for informational and educational purposes and should not be regarded as financial, investment, or trading advice. They are not designed to predict market movements or offer specific recommendations. Users should be aware that past performance is not indicative of future results and should not rely on these tools for financial decisions. By using these charting tools, the purchaser agrees that the seller and creator hold no responsibility for any decisions made based on information provided by the tools. The purchaser assumes full responsibility and liability for any actions taken and their consequences, including potential financial losses or investment outcomes that may result from the use of these products.
By purchasing, the customer acknowledges and accepts that neither the seller nor the creator is liable for any undesired outcomes stemming from the development, sale, or use of these products. Additionally, the purchaser agrees to indemnify the seller from any liability. If invited through the Friends and Family Program, the purchaser understands that any provided discount code applies only to the initial purchase of Candela's subscription. The purchaser is responsible for canceling or requesting cancellation of their subscription if they choose not to continue at the full retail price. In the event the purchaser no longer wishes to use the products, they must unsubscribe from the membership service, if applicable.
We do not offer reimbursements, refunds, or chargebacks. Once these Terms are accepted at the time of purchase, no reimbursements, refunds, or chargebacks will be issued under any circumstances.
By continuing to use these charting tools, the user confirms their understanding and acceptance of these Terms as outlined in this disclaimer.
ابحث في النصوص البرمجية عن "Fractal"

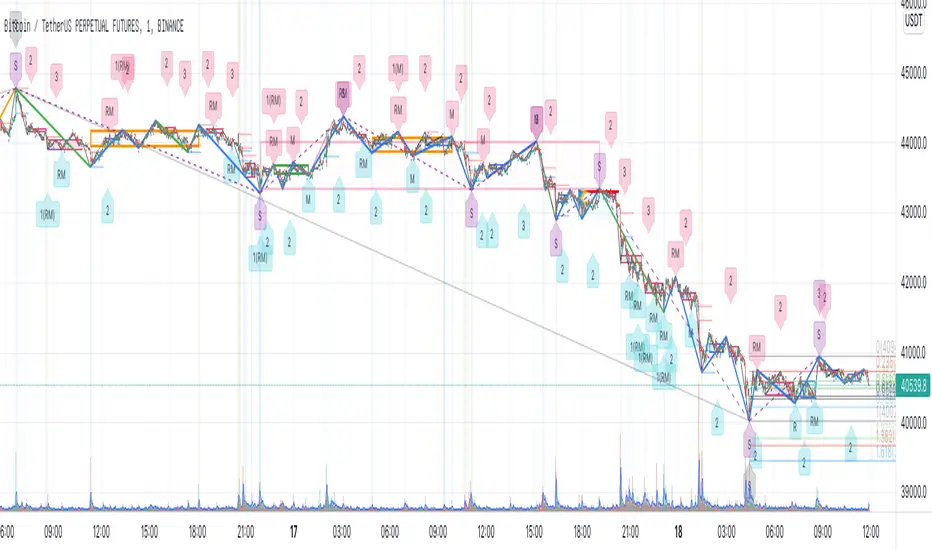
ZenThe Theory of Entanglement (缠论) is one of the most widely studied trading theories in China, but it is much less known among traders outside. Its philosophy is based on human greed, hatred, delusion, arrogance and doubt, which reveal the most fundamental aspect of the market. Fractals, strokes, line segments and pivots are basic elements in the Theory of Entanglement. However, manually drawing them on an ever-changing chart is both challenging and time consuming, and may lead to incorrect interpretation of the market trend. This indicator aims to automate the process of drawing strokes, line segments, and pivots for three consecutive levels such as 1m, 5m, and 30m (similar to time frames). The operation is then based on the so-called “same-level decomposition” technique. Buying and selling points are automatically marked on the chart, as well as points where trend divergence and range divergence occurred, which often signals a trend reversal.
Relations between fractal, stroke, line segment, pivot, and some important definitions:
• Stroke: Connecting two adjacent top and bottom fractals with at least one candlestick in between.
• Line segment: Consists of an odd number of strokes, at least three strokes are required, and the first three strokes must have overlapping parts.
• Level: Levels generally correspond to time frames of the chart, such as 1w, 1d, 4h, 30m, 5m, 1m etc. Sub-level: The above levels are respectively the sub-levels of the previous level.
• Pivot: The part of a trend type at a certain level that is overlapped by at least three consecutive sub-level trend types.
• Trend type: There are two trend types: trend and range. In trend, there are also two types: rising trend and falling trend.
• Range: At any level, a completed trend type contains only one pivot.
• Trend: At any level, a completed trend type contains at least two pivots in the same direction in sequence, which is called a trend at this level.
List of drawings on the chart:
1. Thin black lines: Strokes at the current level.
2. Thick blue lines: Strokes at a higher level, also line segments at the current level.
3. Purple dotted lines: Line segments at a higher level, also strokes at two levels higher from the current one.
4. Blue shaded rectangles: Pivots at the sub-level in a rising trend or range.
5. Red shaded rectangles: Pivots at the sub-level in a falling trend or range.
6. Green shaded rectangles: Pivots at the current level in a rising trend or range.
7. Orange shaded rectangles: Pivots at the current level in a falling trend or range.
List of symbols and labels on the chart (above the candle: sell signal, below the candle: buy signal)
1. Purple triangles below the candle: double golden cross of Stochastic and MACD, buy signal
2. Purple triangles above the candle: double death cross of Stochastic and MACD, sell signal
3. Blue triangles below the candle: EMA5 crosses EMA13 up, buy signal
4. Red triangles above the candle: EMA5 crosses EMA13 down, sell signal
5. Green triangles below the candle: EMA5 crosses EMA55 up, buy signal
6. Orange triangles above the candle: EMA5 crosses EMA55 down, sell signal
7. Blue circles on the low point of the candle: bottom divergence occurred, buy signal
8. Red circles on the high point of the candle: top divergence occurred, sell signal
9. Blue "R" label below the candle: bottom divergence calculated from RSI occurred, buy signal
10. Red "R" label above the candle: top divergence calculated from RSI occurred, sell signal
11. Blue "M" label below the candle: bottom divergence calculated from MACD occurred, buy signal
12. Red "M" label above the candle: top divergence calculated from MACD occurred, sell signal
13. Blue "RM" label below the candle: bottom divergence calculated from both RSI and MACD occurred, buy signal
14. Red "RM" label above the candle: top divergence calculated from both RSI and MACD occurred, sell signal
15. Blue "1(R)", "1(M)", "1(RM)" labels below the candle: 1st buying point due to bottom trend divergence or range divergence calculated from RSI, MACD, and both RSI and MACD occurred, respectively, buy signal
16. Red "1(R)", "1(M)", "1(RM)" labels above the candle: 1st selling point due to top trend divergence or range divergence calculated from RSI, MACD, and both RSI and MACD occurred, respectively, sell signal
17. Blue "3" label below the candle: 3rd buying point, buy signal
18. Red "3" label above the candle: 3rd selling point, sell signal
19. Green "3" label below the candle: 3rd buying point of a higher-level pivot, buy signal
20. Orange "3" label above the candle: 3rd selling point of a higher-level pivot, sell signal
21. Yellow-shaded vertical areas: candles where volume spikes occurred
22. Short red horizontal lines: highest point of volume spikes, potential support or resistance
23. Short blue horizontal lines: lowest point of volume spikes, potential support or resistance
EneX SignalEneX is signal that give recommendation signals for entry and exit on spot market. This indicators not suitable for leverage trading in futures market.
EneX signal consider several indicators and has entry and exit rules.
EneX signal is suitable for investors who believe in trend following strategy (disclaimer on).
This script composed by Yohan Naftali for educational purpose only. Reader who will use this signal must do own research.
Indicator and Plot Involved
1. Williams Fractals with default periods = 2
2. William Alligator Indicators with default simple moving average 8, 13, and 21
3. Exponential Moving Averages with default value EMA 50, 100, and 200
4. Relative Strength Index with default overbought level = 80 and oversold level = 20
5. Williams Fractals are joined to create support and resistance line and fill area between support and resistance lines.
Entry signal conditions
1. Entry on Weakness when bullish fractal appear on n/2 period
2. Entry when price break resistance line
All entry condition must above EMA and alligator signal and not in overbought RSI
Exit signal conditions
1. Lowest price is below Exponential Moving Average
2. Lowest price is below William alligator lines
You can easily find entry and exit points by using Entry (E), Exit(X) signals
How to use
1. Monitor chart and wait until E or X signals
2. Entry if Entry Signal (E) appear (green colored label)
3. Exit if Exit Signal (X) appear (red colored label)
4. Change indicators setting when necessary
Best Practice
1. Entry only when entry signal (E) appear
2. Never entry when price below William alligator signal
3. Exit when exit signal (X) appear
4. Not exit when exit signal appear when you believe or you have information that price will be rebound
5. Exit if you believe that current price meet your target price
6. Always wise when use EneX signals
Disclaimer
Do your own research and consider fundamental price of asset.
The indicators provided on this script is for educational purposes only.
Author does not offer advisory or brokerage services, nor does it recommend or advise users to buy or sell particular stocks or securities.
Please examined script and give feedback for further improvement.

CSM Trigger LineThis indicator highlights what I call the trigger line, which is a special non-lagging moving average that will act as the potential signal to enter into positions as part of the CSM (Currency Strength Micro-Mechanics) strategy.
Entries will be valid if the rest of conditions are met as part of the rules governing this strategy.
As you keep practicing with it, you will notice that the signal produced when we are typically just one candle away from confirming the formation of the next fractal.
This means that in all those instances when fractals don’t get retested, we will be in for some significant movements. In other words, the trigger line acts as a phenomenal hint to warn us of reversal points in the chart.

Composite Synchronous Sinusoidal Harmonics Waveform GeneratorWait, "Composite Synchronous Sinusoidal Harmonics Waveform Generator", say what?? What on earth is that, and what function does this script perform? Keep reading and discover! It's intended and provided freely to use for any TV member at any skill level, not just at the engineering level. This is also available for anyone becoming fluent with why stocks/markets fluctuated the way that they do.
Don't let the entitled name frighten you, it's actually surprisingly fun to just fiddle with. This is ALSO a ingenious PSv4 tinker toy. Change any input() and see how one subtle settings alteration dramatically changes the entire fractal. You might learn something new about this giant financial game we all are determined to play anyways. Double and triple tops, head and shoulders, bounces, cup/handle, consolidations, and MANY-MANY other things are revealed on how they come to exist and why. Funny thing is, this is occurring in minds of traders psychologically. You, me, everyone! Ponder that.
Initially, I wanted a synthetic signal "generator", where I would know for certain what the specific "composing" frequencies are for testing, spectral analysis, filtering, and pattern recognition purposes. Inherent "harmonics" affect nearly every algorithmic indicator you have seen or that may come to exist. While encountering a plethora of cycles, you may see exactly how well your indicators/filters perform when "sourced" to this script with `src = input(close, "Source", input.source)`. Keep in mind, open, high, low, and volume variables are NOT available, if they are employed in your indicators calculations. Feel free to tether this to TV built-in indicators or create your own in TV's Pine Editor, if a source input() isn't already provided. See what happens...
Educating you informatively further, there are "synchronous" irregular harmonic frequencies just like this that do in fact exist in tickers everywhere. While this script's specific generated "sinusoidals" are completely stationary, the ones you will see in REAL price action are ephemeral, emerging and disappearing at any time unexpectedly. The remarkable thing about my creation is, you may notice patterns in the generated fundamental "waveform" that are eerily similar to actual stock market fractal patterns encountered everyday. On just spontaneous random chance, I found a recognizable pattern on a watch list asset displayed above, without looking for it before publishing this. I did not cherry pick that or tune the settings to it. I just bumped up the chart interval one notch and offset the waveform quickly.
As you can witness looking closer, there are numerous pure sine waves artificially created with different amplitudes and phase shifts to form unique patterns that combine together in most unique ways appearing fractal in nature. The sine waves are not derived from any ticker price/volume that you maybe viewing, and should look similar on any time frame chosen. Don't worry about chart intervals. The combination of these with simple addition results in the most unique of waveforms in white. You will notice "dominant cycles", as Dr. John Ehlers would describe them, are the prevailers in movement. Yet those smaller cycles have enormous influence over more powerful cycles and ultimately our indicators.
One intention not included at initial release is a preset waveforms input() to instantly generate very specific patterns, such as a pseudo-square wave, sawtooth wave, and many others that may have applications in real world pattern matching. If you happen to come across very unique ones, you may inform me privately via TV chat and I will consider your gracious considerations of discovered settings for inclusion. I'm awaiting Pine arrays to arrive for that major revision. Yes, you have read that correctly. They have been in the TV contributor/developer oven for quite some time. This was revealed in a "public" announcement recently, and I decided to provide you with a "Get Ready Notification" in this script's description, wink-wink. Pine Script endowed with arrays may be used to create and test spectral decomposition analytics code, filters, or what ever else your mind can surmise utilizing this nifty generator script. You now have another tool for your TV tool belt, to aid with spawning the future evolution of indicators on TradingView. Let the tinkering commence...
Features List Includes:
Waveform offset
Nyquist noise injection
Sine wave enable/disable for all sine waves
Cycle period for all sine waves
Amplitude for all sine waves
Phase shift for all sine waves
The comments section below is solely just for commenting and other remarks, ideas, compliments, etc... regarding only this indicator, not others. When available time provides itself, I will consider your inquiries, thoughts, and concepts presented below in the comments section if you do have any questions or comments regarding this indicator. When my indicators achieve more prevalent use by TV members , I may implement more ideas when they present themselves as worthy additions. As always, "Like" it if you simply just like it with a proper thumbs up, and also return to my scripts list occasionally for additional postings. Have a profitable future everyone!

Deep_Fractal_Signals_and_Rubber_Band_TradesThis indicator is based on Williams Fractals and the TopDog Trading "Rubber Band Trade"
The Deep Fractal Signals are triangles that indicate the price is forming a pattern of decreasing lows in a down trend (orange) or, increasing highs in an up trend (green).
The triangles are placed above or below the last bar of the pattern, unlike Fractals which are drawn 2 candles prior to the current candle, and are re-painted on the chart.
When the triangle is indicated above the moving average in a down trend (blue), or below the moving average in an up trend (yellow), this is a Rubber Band Trade.
When the slope of the moving average is less than the Gain set by the user, or are counter-trend, the triangles are plotted in silver.
When used in conjunction with the Power Analyzer indicator, a signal to the long side should be taken when the Power Analyzer momentum indicator is at a cycle low. Similarly, a signal to the short side should be taken when the indicator is at a cycle high.
The first, second or third signal in a new trend have the highest probability of a follow through.
The indicator sometimes gives a false signal at the very end of the trend, just before the market reverses. This is an attempt by the Market Makers to persuade traders that the trend will continue.
Please leave a comment and "Like" this indicator if you find it useful.
FX Engineering

Phicube EMASAR ( EMA Support and Resistance )Indicator based on the Concept created by Bo Williams. But unlike the original that uses MIMAs, EMAs are used here.
Exponential moving averages will be shown according to fractal alignment, in order to show the important support and resistance levels ( SAR ).
When the fractals are aligned to become support,
we will have the EMA in the graph with a bright color.
When the fractals are aligned to become resistance, we will have EMA in the graph with a matte color.
Available exponential moving averages: 17,34,72,144,305,610,1292 and 2584
____________________________________________________//_____________________________________________________________________
Indicador baseado no Conceito criado pelo Bo Williams. Mas diferente do original que utiliza MIMAs, aqui é utilizado EMAs.
As médias móveis exponenciais serão mostradas de acordo com o alinhamento dos fractais, com objetivo de mostrar os níveis importantes
de suporte e resistência( SAR ).
Quando estiver com os fractais alinhados virando suporte, teremos no gráfico a EMA com uma cor em tom brilhante.
Quando estiver com os fractais alinhados virando resistência, teremos no gráfico a EMA com uma cor em tom fosco.
Médias móveis exponenciais disponíveis: 17,34,72,144,305,610,1292 e 2584

[PX] Level & TrendlinesThe indicator identifies the intermediate fractal pattern, where neighboring fractals are either higher or lower. It plots horizontal level and trendlines based on those fractals and comes with a variety of settings.
If you are looking for someone to develop your on indicator or trading strategy, don't hesitate to get in touch with me here on TradingView or below.
Contact:
www.pascal-simon.de
info@pascal-simon.de

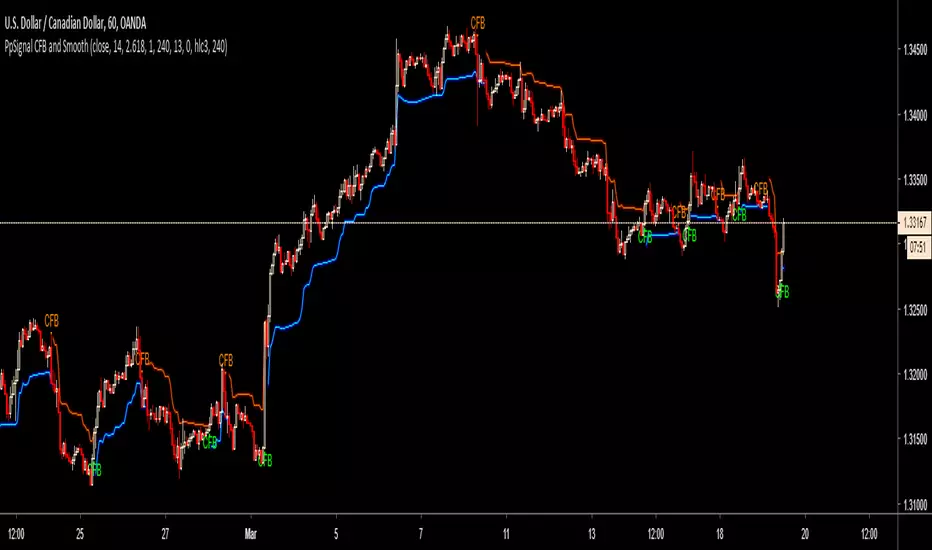
PpSignal CFB AlarmWhat is the Theory Behind CFB ?
CFB tells you how long the market has been in a quality trend. This value can be used to adjust the period length of other indicators, especially stochastic bands.
In order to quantify the overall duration of a market's trend, we replaced classical cycle analysis methods (FFT, MEM, MESA) with a form of analysis that works even when no cycles exist. We accomplished this by examining a time series for specific fractal patterns of any size. We then gather all the patterns found and combine them into one overall index, CFB (Composite Fractal Behavior) Index.
For good reason, CFB does not analyze time series data for dominant cycles. Classical cycle analysis examines data points (e.g. prices) and estimates the average presence of a cycle in the window. Now suppose a cycle with a period length of 9 days was strong for 50 days and then disappeared for the next 14 days. Because the cycle was present for 50 out of the last (50+14=64) days, the average presence of that cycle would be measured as "strong" even though it does not exist anymore!
Does CFB find the Dominant Cycle ?
No! Consider the following discussion about the MYTH of exploiting dominant cycles.
It is true that the market does have predictable cycles due to its "structural" or physical nature. For example, quarterly earning cycles, triple witching cycles, Federal Reserve meetings, weekly cycles, political election year cycles, the annual end-of-year stock dumping cycle, sunspot cycles, and the slow Kitchin (3-5 years), Juglar (7-11 years), Kuznet (15-25 years) and Kondratieff (45-60 years) cycles. They are very predictable and the markets readily discount their presence as far ahead in time as is reasonable. So there's not much left with regard to those cycles for you to exploit.
What traders see as cycles on an hourly chart, for example, is a different matter. The big, obvious cycles you see on price charts are actually the result of a combination of many weak cyclic forces that sometimes line up in phase to produce APPARENT dominant cycles that suggest the presence of a strong structural cycle that, in fact, does not exist. The slightest shifting in phase of any one component (due to crowd psychology, unscheduled events, etc.) will significantly alter the structure of the apparent dominant wave. This may drive the cycle into a "null" or random period, then reappear, completely out of phase. Now you see it ... and now you don't.
The transitory nature of these apparent dominant cycles makes their automated detection difficult and forecast unreliable. Sometimes cycle forecasting tools appear accurate and other times they are totally off mark. The reason is that tools designed to spot dominant cycles will announce whatever they find, even if they are only apparent (not structural) and transitory. For example, such tools would have no problem detecting cycles in the six charts below. But there is just one problem --- the slow cyclic price action in the six charts below is *impossible* to project into the future with any reasonable accuracy!
Why? Because we produced these six charts by simply adding consecutive random price changes. That's right!! These charts are nothing more than RANDOM WALKS. And by definition, they cannot be forecasted, no matter how impressive their apparent cyclic behavior may be!
The chart above does not "prove" market cycles are non-existent. Indeed, discretionary traders can learn to spot and use periodic price events, and take time to "understand" their causes, in order to verify whether the relevant triggers have actually occurred.
This demonstration does show, however, that cycle-finding tools like FFT, MESA and periodigrams, which have no understanding of market cause-effect relationships, can be easily fooled into seeing ghosts. In contrast, our CFB tool was designed to measure market trending action without assuming the existance of cycles. This makes CFB more reliable.
How would I use CFB's results ?
CFB produces a value proportional to a time series' trend duration. This value is in units of TIME, as measured in bars on a chart. Because CFB's output is in units of time and not price, CFB offers a unique window into a new dimension for representing signal behavior.
Investors have discovered many profitable ways to apply CFB:
* To auto-adjust the lookback of classical indicators, such as RSI
* To auto-adjust the lookback depth of breakout channels in trending markets
* To auto-adjust the minimum amount of retracement needed to reverse position
Making a profit in the market requires your finding a unique niche that very few other people are exploiting. CFB offers this unique perspective.
Do I specify a "period length" for CFB?
In CFB, period length determines how many bars (time slices) are examined for specific fractal patterns. Due to the complexity of the algorithm, CFB permits only four period lengths: 24, 48, 96, 192. The 24-bar version can see trend fractals up to 24 bars wide, and so on. You get all four versions when ordering CFB.
________________________________
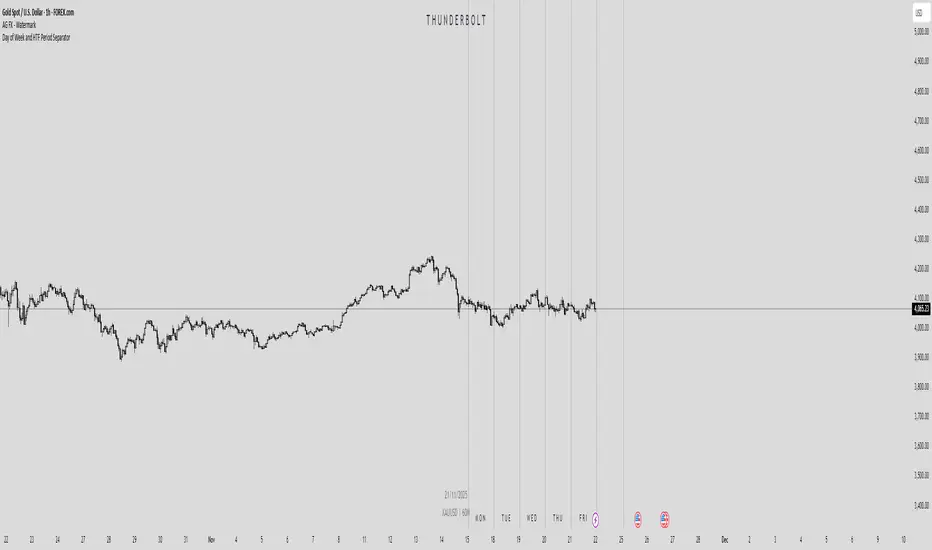
Day of Week SeparatorThis indicator displays vertical lines to separate each day of the trading week, along with the optional 4hr separators. It also shows day-of-week labels (MON, TUE, etc.) at a specified hour for quick visual reference. Useful for intraday traders who want a clear view of daily and higher timeframe transitions.
Auto HTF Candles [@gaucho_trader][Auto HTF Candles
(Title)
Tired of constantly switching between timeframes? 🔄 This indicator solves that problem by bringing Higher Timeframe (HTF) context directly onto your current chart.
Auto HTF Candles plots up to three different sets of HTF candles in a clean, non-intrusive panel on the right side of your screen. Now you can watch a 4H candle develop while analyzing price action on a 5-minute chart, all in one view.
Core Concept 🎯
The principle is simple: your lower timeframe (LTF) trading decisions become significantly more powerful when aligned with the HTF trend and structure. By displaying the live HTF candles, you can instantly see if the current LTF move is a weak pullback against a strong HTF candle or a powerful breakout from an HTF consolidation. This indicator provides that essential macro context without ever leaving your main chart.
Key Features 📊
📈 Display Multiple Timeframes: Plot up to three fully independent higher timeframes simultaneously (e.g., 15m, 1H, and 4H).
🤖 Automatic HTF Selection: Enable the "Auto-Adjust HTF 1" feature, and the script will intelligently select a logical higher timeframe for you based on your current chart.
⏳ Real-Time Countdown Timer: Each timeframe displayed includes a timer showing the exact time remaining until the current HTF candle closes. This is crucial for anticipating end-of-candle volatility.
🎨 Fully Customizable Appearance: You have complete control over the visual style. Adjust colors, candle width, spacing, and the padding from the live price.
✨ Clean & Organized Layout: The candles are neatly arranged to the right of the current price, ensuring your main chart remains clear and unobstructed.
How to Use It 💡
Context is King: Use the HTF candles to define your bias. If the 4H candle is strongly bullish, you can look for more confident long entries on your 5m chart.
Identify Key Levels in Real-Time: Watch the highs and lows of the HTF candles as they form. These levels often act as powerful intraday support and resistance.
Anticipate Reversals: Is the 1H candle approaching its close and printing a long upper wick? This could signal a potential reversal, giving you a heads-up before the pattern is obvious on the LTF.
Streamline Your Workflow: Use the "Auto-Adjust" feature for a dynamic analysis setup. As you switch between different charts, your most relevant HTF context will follow you automatically.
Main Settings ⚙️
HTF 1, 2, 3: Enable and select up to three custom timeframes and set how many recent candles you want to display for each.
Auto-Adjust HTF 1: The star of the show. Toggle this on to let the script automatically select the first HTF based on your chart's period.
Styling: A comprehensive section to modify all colors, candle width, and the spacing between candles and timeframes.
Label Settings: Independently control the visibility, color, and size of the HTF name labels and the countdown timers.
⚠️ Disclaimer
This indicator is a tool for market analysis and should not be considered financial advice. Trading involves significant risk. Always perform your own due diligence before making any trading decisions.
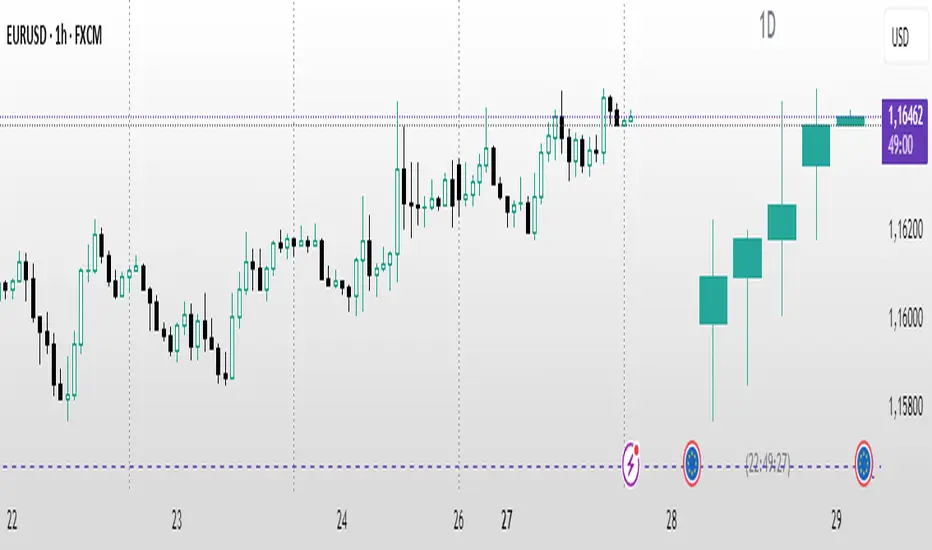
Automatic Higher Timeframe Dividers [@gaucho_trader]🧭 Overview
The HTF Separators (auto) indicator automatically draws vertical lines marking the start of each candle belonging to a higher–timeframe (HTF).
This allows you to visually identify the boundaries of higher–timeframe candles within your current chart — an essential concept for multi–timeframe (MTF) analysis.
For example:
On a 15-minute chart, each line marks the start of a new 4-hour candle.
On a 1-hour chart, the lines show where each daily candle begins.
On a daily chart, they highlight the start of each month.
These vertical separators help you recognize moments when price often reacts or shifts, since the open of a new higher-timeframe candle frequently aligns with impulses, reversals, or structural changes.
⚙️ Main Features
✅ Automatic timeframe mapping:
1m → 15m
3m → 30m
5m → 1H
15m → 4H
1H → 1D
4H → 1W
1D → 1M
✅ Full customization:
Line color
Line width
Style (solid, dashed, or dotted)
✅ Optional HTF label:
Display a small label showing the detected higher timeframe (e.g. “HTF: 4H”).
🧩 How to use
Add the indicator to your chart.
Adjust the color, width, and style to your preference.
(Optional) Enable the label to display the current HTF being tracked.
Watch how vertical lines automatically appear whenever a new higher-timeframe candle starts.
This helps you align your trades and analysis with higher-timeframe structure, giving you a clearer understanding of market cycles and timing.
💡 Practical Example
If you trade on a 15-minute chart, each separator line represents the start of a 4-hour candle.
Use it to:
Understand the context of your current candle within the larger trend.
Spot key reaction points at HTF opens.
Time entries and exits around HTF shifts.
🧠 Best for
Traders using multi-timeframe analysis (MTF)
Intraday and swing traders seeking better HTF alignment
Anyone wanting a cleaner and more structured chart view
📈 Automatic Higher Timeframe Dividers is a lightweight, practical tool that brings clarity and temporal precision to your technical analysis — helping you instantly see where each major candle begins on your chart.

OB - MentorXOB - MentorX
Advanced OrderBlock Detection with Smart Alerts
🎯 Key Features:
- Smart OrderBlock Detection: Identifies bullish/bearish OrderBlocks using fractal breaks
- Multi-Timeframe Alerts: Get instant notifications on 1m, 3m, 5m, 15m, 30m, 1h, 4h
- Strength Filter: Only alerts on significant OrderBlocks (ATR-based strength)
- Visual Confirmation: Alerts sync perfectly with drawn OrderBlock lines
- Customizable Settings: Adjust line styles, colors, and alert preferences
🔔 Alert System:
How It Works:
- OrderBlock detected → Lines drawn → Alert triggered
- No false signals - only alerts when OrderBlock is visible on chart
- Strength filter prevents noise alerts on weak OrderBlocks
Alert Examples:
🔴 Bearish OrderBlock Created
Timeframe: 15m
High: 1.2345
Low: 1.2300
Strength: 2.45% ATR
🟢 Bullish OrderBlock Created
Timeframe: 1h
High: 1.2400
Low: 1.2350
Strength: 3.20% ATR
⚙️ Setup:
1. Enable "Enable Alerts" in settings
2. Select desired timeframes (1m, 3m, 5m, 15m, 30m, 1h, 4h)
3. Adjust "Minimum OB Strength" (0.1-5.0% ATR)
4. Create TradingView alert with "Any alert() function call"
🎨 Customization:
- Line styles: Solid, Dashed, Dotted
- Colors: Customize bearish/bullish line colors
- Fractal filters: 3-bar or 5-bar fractals
- FVG filtering: Optional Fair Value Gap confirmation
📊 Perfect for:
- Scalping
- Swing trading
- Multi-timeframe analysis
- Professional trading strategies
Perfect for scalping, swing trading, and multi-timeframe analysis!
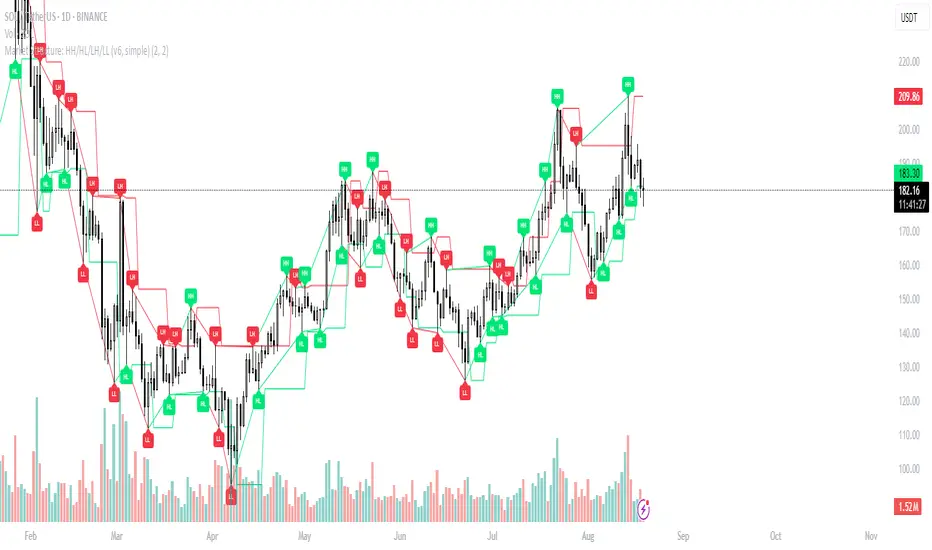
Market Structure: HH/HL/LH/LL (v6, simple)What it does
Labels swing High/Low and classifies structure as HH / HL / LH / LL after confirmation.
Uses confirmed fractals (pivothigh/pivotlow) → no repaint after confirmation (there is a right-bar confirmation delay).
Optional swing connectors (lines), optional plain H/L when structure label is not applicable.
Plots last confirmed High/Low levels as reference.
Alerts when a new HH/HL/LH/LL is formed.
How it works
Swings are detected with ta.pivothigh() / ta.pivotlow() using user-defined left and right.
A pivot is confirmed only after right bars on the right—this is the only delay. Once confirmed, the label does not repaint.
Inputs
Left bars & Right bars – fractal sensitivity.
Connect swings with lines – draw lines between consecutive swings.
Show bullish (HH/HL) / Show bearish (LH/LL) – filter what to display.
Show plain H/L – draw H/L when classification is not HH/HL/LH/LL yet.
Recommended settings
1H–4H: left=2, right=2 (responsive).
1D+: left=3, right=3 (cleaner swing map).
Alerts provided
HH formed – new Higher High confirmed.
HL formed – new Higher Low confirmed.
LH formed – new Lower High confirmed.
LL formed – new Lower Low confirmed.
Use them to automate structure tracking or feed your strategy rules.
Tips
Trend up: a sequence of HH + HL; Trend down: LH + LL.
Combine with VWAP/EMA, liquidity zones, or volume/CVD to avoid chasing late signals.
The script is intentionally simple and lightweight; BOS/CHoCH can be added in a future update.
Limitations / Notes
Because the tool relies on confirmed pivots, signals are delayed by right bars.
This is not financial advice and not a buy/sell system on its own.
Changelog
v1.0 – Initial public release (Pine v6). Structure labels, swing connectors, last levels, and alert set.
Keywords
market structure, hh hl lh ll, swing, fractal, pivothigh, pivotlow, trend, structure labels, price action
Stoch_RSI_ChartEnhanced Stochastic RSI Divergence Indicator with VWAP Filter for Charts
This custom indicator builds upon the classic Stochastic RSI to automatically detect both regular and hidden divergences. It’s designed to help traders spot potential market reversals or continuations using two methods for divergence detection (fractal‑ and pivot‑based) while offering optional VWAP filtering for confirmation.
Key Features
Stoch RSI Calculation
The indicator computes a smoothed Stoch RSI using configurable parameters for RSI length, stochastic length, and smoothing periods. An option to average the K and D lines provides a cleaner momentum view.
Divergence Detection via Fractals & Pivots
Fractal-Based Divergences:
Looks for 4-candle patterns to identify higher-highs or lower-lows in the price that are not confirmed by the oscillator, signaling potential reversals.
Pivot-Based Divergences:
Utilizes TradingView’s built-in pivot functions to find divergence conditions over adjustable pivot ranges.
Regular vs. Hidden Divergences:
Regular Divergence: Occurs when price makes a new extreme (higher high or lower low) while the Stoch RSI fails to follow suit.
Hidden Divergence: Indicates potential trend continuations when the oscillator diverges against the established price trend.
Optional VWAP Filtering
The script includes two optional VWAP filters that work as follows:
VWAP Filter on Regular Divergences:
Only confirms regular divergence signals if the current price satisfies the VWAP condition (e.g., price is above VWAP for bullish signals, below VWAP for bearish signals).
VWAP Filter on Hidden Divergences:
Similarly, hidden divergence signals are validated only when the price meets specific VWAP conditions, adding an extra layer of trend confirmation.
Customizable Alerts and Visual Labels
Easily configure divergence labels (“B” for bullish, “S” for bearish) and enable up to four alert conditions for real‑time notifications when a divergence occurs.
Credits & History:
Log RSI by @fskrypt
Divergence Detection originally by @RicardoSantos (with edits from @JustUncleL)
Further Edits by @NeoButane on August 8, 2018
Latest Edits by @FYMD on June 1, 2024

MMXM ICT [TradingFinder] Market Maker Model PO3 CHoCH/CSID + FVG🔵 Introduction
The MMXM Smart Money Reversal leverages key metrics such as SMT Divergence, Liquidity Sweep, HTF PD Array, Market Structure Shift (MSS) or (ChoCh), CISD, and Fair Value Gap (FVG) to identify critical turning points in the market. Designed for traders aiming to analyze the behavior of major market participants, this setup pinpoints strategic areas for making informed trading decisions.
The document introduces the MMXM model, a trading strategy that identifies market maker activity to predict price movements. The model operates across five distinct stages: original consolidation, price run, smart money reversal, accumulation/distribution, and completion. This systematic approach allows traders to differentiate between buyside and sellside curves, offering a structured framework for interpreting price action.
Market makers play a pivotal role in facilitating these movements by bridging liquidity gaps. They continuously quote bid (buy) and ask (sell) prices for assets, ensuring smooth trading conditions.
By maintaining liquidity, market makers prevent scenarios where buyers are left without sellers and vice versa, making their activity a cornerstone of the MMXM strategy.
SMT Divergence serves as the first signal of a potential trend reversal, arising from discrepancies between the movements of related assets or indices. This divergence is detected when two or more highly correlated assets or indices move in opposite directions, signaling a likely shift in market trends.
Liquidity Sweep occurs when the market targets liquidity in specific zones through false price movements. This process allows major market participants to execute their orders efficiently by collecting the necessary liquidity to enter or exit positions.
The HTF PD Array refers to premium and discount zones on higher timeframes. These zones highlight price levels where the market is in a premium (ideal for selling) or discount (ideal for buying). These areas are identified based on higher timeframe market behavior and guide traders toward lucrative opportunities.
Market Structure Shift (MSS), also referred to as ChoCh, indicates a change in market structure, often marked by breaking key support or resistance levels. This shift confirms the directional movement of the market, signaling the start of a new trend.
CISD (Change in State of Delivery) reflects a transition in price delivery mechanisms. Typically occurring after MSS, CISD confirms the continuation of price movement in the new direction.
Fair Value Gap (FVG) represents zones where price imbalance exists between buyers and sellers. These gaps often act as price targets for filling, offering traders opportunities for entry or exit.
By combining all these metrics, the Smart Money Reversal provides a comprehensive tool for analyzing market behavior and identifying key trading opportunities. It enables traders to anticipate the actions of major players and align their strategies accordingly.
MMBM :
MMSM :
🔵 How to Use
The Smart Money Reversal operates in two primary states: MMBM (Market Maker Buy Model) and MMSM (Market Maker Sell Model). Each state highlights critical structural changes in market trends, focusing on liquidity behavior and price reactions at key levels to offer precise and effective trading opportunities.
The MMXM model expands on this by identifying five distinct stages of market behavior: original consolidation, price run, smart money reversal, accumulation/distribution, and completion. These stages provide traders with a detailed roadmap for interpreting price action and anticipating market maker activity.
🟣 Market Maker Buy Model
In the MMBM state, the market transitions from a bearish trend to a bullish trend. Initially, SMT Divergence between related assets or indices reveals weaknesses in the bearish trend. Subsequently, a Liquidity Sweep collects liquidity from lower levels through false breakouts.
After this, the price reacts to discount zones identified in the HTF PD Array, where major market participants often execute buy orders. The market confirms the bullish trend with a Market Structure Shift (MSS) and a change in price delivery state (CISD). During this phase, an FVG emerges as a key trading opportunity. Traders can open long positions upon a pullback to this FVG zone, capitalizing on the bullish continuation.
🟣 Market Maker Sell Model
In the MMSM state, the market shifts from a bullish trend to a bearish trend. Here, SMT Divergence highlights weaknesses in the bullish trend. A Liquidity Sweep then gathers liquidity from higher levels.
The price reacts to premium zones identified in the HTF PD Array, where major sellers enter the market and reverse the price direction. A Market Structure Shift (MSS) and a change in delivery state (CISD) confirm the bearish trend. The FVG then acts as a target for the price. Traders can initiate short positions upon a pullback to this FVG zone, profiting from the bearish continuation.
Market makers actively bridge liquidity gaps throughout these stages, quoting continuous bid and ask prices for assets. This ensures that trades are executed seamlessly, even during periods of low market participation, and supports the structured progression of the MMXM model.
The price’s reaction to FVG zones in both states provides traders with opportunities to reduce risk and enhance precision. These pullbacks to FVG zones not only represent optimal entry points but also create avenues for maximizing returns with minimal risk.
🔵 Settings
Higher TimeFrame PD Array : Selects the timeframe for identifying premium/discount arrays on higher timeframes.
PD Array Period : Specifies the number of candles for identifying key swing points.
ATR Coefficient Threshold : Defines the threshold for acceptable volatility based on ATR.
Max Swing Back Method : Choose between analyzing all swings ("All") or a fixed number ("Custom").
Max Swing Back : Sets the maximum number of candles to consider for swing analysis (if "Custom" is selected).
Second Symbol for SMT : Specifies the second asset or index for detecting SMT divergence.
SMT Fractal Periods : Sets the number of candles required to identify SMT fractals.
FVG Validity Period : Defines the validity duration for FVG zones.
MSS Validity Period : Sets the validity duration for MSS zones.
FVG Filter : Activates filtering for FVG zones based on width.
FVG Filter Type : Selects the filtering level from "Very Aggressive" to "Very Defensive."
Mitigation Level FVG : Determines the level within the FVG zone (proximal, 50%, or distal) that price reacts to.
Demand FVG : Enables the display of demand FVG zones.
Supply FVG : Enables the display of supply FVG zones.
Zone Colors : Allows customization of colors for demand and supply FVG zones.
Bottom Line & Label : Enables or disables the SMT divergence line and label from the bottom.
Top Line & Label : Enables or disables the SMT divergence line and label from the top.
Show All HTF Levels : Displays all premium/discount levels on higher timeframes.
High/Low Levels : Activates the display of high/low levels.
Color Options : Customizes the colors for high/low lines and labels.
Show All MSS Levels : Enables display of all MSS zones.
High/Low MSS Levels : Activates the display of high/low MSS levels.
Color Options : Customizes the colors for MSS lines and labels.
🔵 Conclusion
The Smart Money Reversal model represents one of the most advanced tools for technical analysis, enabling traders to identify critical market turning points. By leveraging metrics such as SMT Divergence, Liquidity Sweep, HTF PD Array, MSS, CISD, and FVG, traders can predict future price movements with precision.
The price’s interaction with key zones such as PD Array and FVG, combined with pullbacks to imbalance areas, offers exceptional opportunities with favorable risk-to-reward ratios. This approach empowers traders to analyze the behavior of major market participants and adopt professional strategies for entry and exit.
By employing this analytical framework, traders can reduce errors, make more informed decisions, and capitalize on profitable opportunities. The Smart Money Reversal focuses on liquidity behavior and structural changes, making it an indispensable tool for financial market success.

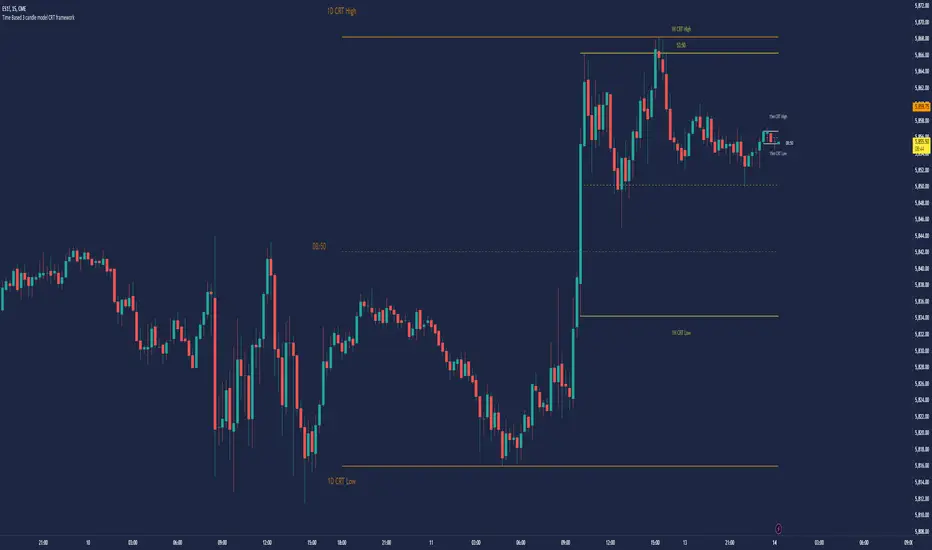
Time Based 3 Candle Model CRT FrameworkThe 3 Candle Model Overview:
The 3 Candle Model serves as a sophisticated framework for traders to navigate the complexities of financial markets, particularly within futures and forex trading. This guide not only elaborates on the model's key features but also emphasizes its originality and practical usefulness in the TradingView community. The core principle of the 3 Candle Model revolves around understanding how candle patterns can represent significant price ranges, offering valuable insights into potential market movements. By integrating the model with other critical trading concepts such as the Power of Three (PO3), Open-High-Low-Close (OHLC), and Turtle Soup setups, traders can enhance their ability to identify high-probability trades and achieve better trading outcomes.
Indicator includes:
3 Customizable Timeframe choices to fractally frame 3 candle models for precision
Live Timers for each timeframe to always be aware of the models timing
Parent Candle tracking on every preffered timeframe until new models parent candle is printed
Key Features of the 3 Candle Model
The 3 Candle Model primarily utilizes a three-candle structure, where the first candle establishes a price range, the second candle may act as a confirmation (often termed a "turtle soup"), and the third candle provides the breakout or continuation. This structure is pivotal in determining entry and exit points for trades, ensuring that each trading decision is backed by solid price action analysis.
OHLC Principle:
The Open-High-Low-Close (OHLC) concept is integral to the 3 Candle Model, allowing traders to analyze price action more effectively. Understanding the relationship between these four price points helps traders gauge market sentiment and potential reversals. By incorporating OHLC into the model, traders can develop a deeper understanding of market structure and its implications for future price movements.
Delivery States:
The 3 Candle Model emphasizes the importance of delivery states, which refer to the market's phase during specific time frames. Recognizing these states aids traders in determining the appropriate conditions for entering trades, particularly when combined with the power of three and candle range patterns. This understanding is crucial for positioning trades in alignment with market momentum.
High Probability Setups:
By aligning the 3 Candle Model with inside bar setups, traders can optimize their strategies for high-probability outcomes. This approach capitalizes on the inherent fractal nature of price movements, where previous patterns repeat at different scales. The combination of the model and inside bar setups enhances the trader's toolkit, allowing for more strategic trade placements.
Turtle Soup Formation:
The 3 Candle Model intricately connects with the Turtle Soup concept, which focuses on false breakouts. Identifying these formations at critical levels enhances the trader's ability to anticipate reversals or continuation patterns. The timing of these setups, particularly during specified times like 3:00 AM, 6:00 AM, 9:00 AM, and 1:00 PM, is crucial for maximizing trade success.
Using the 3 Candle Model in Trading
Integration with PO3:
The Power of Three (PO3) is a fundamental aspect of the 3 Candle Model that emphasizes the significance of three distinct stages of price delivery. Traders can leverage this principle by observing the initial range, confirming patterns, and executing trades during the third phase, leading to higher risk-to-reward ratios. This three-stage approach enhances a trader's ability to make informed decisions based on market behavior.
Targeting Midpoints:
Successful application of the 3 Candle Model involves targeting the midpoints of identified ranges. This practice not only provides strategic entry points but also enhances the probability of reaching desired profit levels. By targeting these midpoints, traders can refine their exit strategies and manage risk more effectively.
Aligning with Market Timing:
Timing is everything in trading. By synchronizing the 3 Candle Model setups with the aforementioned key timeframes, traders can better position themselves to exploit market dynamics. This alignment also facilitates the identification of high-quality trades that exhibit strong potential for profitability.
Prioritizing A+ Setups:
By focusing on the 3 Candle Model and its associated concepts, traders can prioritize A+ setups that exhibit a strong alignment of factors. This methodical approach enhances the quality of trades taken, leading to improved overall performance. By cultivating a strategy centered on high-probability setups, traders can maximize their return on investment.
Ensuring Originality and Usefulness
To meet the TradingView community guidelines, it is essential that this script is both original and useful. The 3 Candle Model, in its essence, is designed to provide traders with a unique perspective on market movements, free from generic or rehashed strategies. This tool integrates unique interpretations of the three-candle model and the associated strategies that are distinctly articulated and innovative.
Practical Applications: there are many practical applications of the 3 Candle Model in various trading contexts. This model in conjunction with other strategies to cultivate high-probability trade setups that can enhance performance across diverse market conditions.
Educational Value: This script is crafted with educational value in mind, providing insights that extend beyond mere trading signals. It encourages users to develop a deeper understanding of market mechanics and the interplay between price action, time, and trader psychology.
Conclusion
The 3 Candle Model provides a comprehensive framework for traders to enhance their trading strategies in the futures and forex markets. By understanding and applying the principles of this model alongside the Power of Three, OHLC concepts, and Turtle Soup formations, traders can significantly improve their ability to identify high-probability trades. The emphasis on timing, delivery states, and alignment of ranges ensures that traders are well-equipped to navigate the complexities of market movements, ultimately leading to more consistent and rewarding trading outcomes.
As trading involves risk, it is essential for traders to utilize these principles judiciously and maintain a disciplined approach to their trading strategies. By adhering to the TradingView community guidelines and emphasizing originality, usefulness, and detailed descriptions, this 3 Candle Model script stands as a valuable resource for traders seeking to refine their skills and achieve greater success in the financial markets.
Through this detailed exploration of the 3 Candle Model, traders will not only learn to recognize and exploit key patterns in price action but also appreciate the interconnectedness of various trading strategies that can significantly enhance their performance and profitability.
Market Structure RangesI have written a script for determining the BIAS.
It uses fractals of 3 for the highs and lows.
It works as follows:
If a range high is broken (!!!candelclose!!!), the last fractal low is selected as the new low point. The Rangelow is determined from this low point.
If a fractal high now occurs, the range high is set at this point.
This Range between the low range and high range is called "Dealing range" , this is divided at the centre - into premium and discount.
The range stays the same, until we see a body close outside this range!
The same applies to a short scenario, only in reverse.
In the indicator, the higher timeframe is selected, which determines the input for the dealing range. Then the dealing range from the higher timeframe is displayed in each timeframe that we want to use for our trades.
The indicator should be used to trade with the trend: for example, the last higher timeframe break is bullish (displayed in the table) -- called kMS
and on the other hand that we only want to take tades that are in the lower part of the range, i.e. in the discount area for buy trades.
This indicator therefore serves as a filter for the higher timeframe trend and higher timeframe premium/discount ranges.

Divergence Signal [TradingFinder] RSI & MACD Reversal On Swing🔵 Introduction
Sometimes in analyzing price charts using indicators, you may observe a discrepancy. For instance, while the price of stocks, currencies, or commodities is increasing, the indicator shows a decrease. Such a phenomenon in technical analysis is termed "divergence." Divergences are categorized into three types based on their formation and the prediction they make about the continuation of the price trend: "Regular Divergence," "Hidden Divergence," and "Time Divergence."
🟣 Important :
• This indicator exclusively identifies regular divergences since its primary function is to detect reversal points.
• This indicator identifies divergences using three indicators: "Moving Average Convergence Divergence" (MACD), "Relative Strength Index" (RSI), and "Awesome Oscillator" (AO). The user can choose each of these indicators in the settings using the "Divergence Detection Method" dropdown menu for identifying divergences. These settings are by default set to the MACD mode.
🔵Types of Divergence
Divergences, as mentioned, offer different predictions about the continuation of price trends. Hence, they have various types. We will focus on explaining regular divergences based on this indicator.
🟣 Regular Divergence(RD) :
Regular divergence is a situation arising from contradictory behavior between the indicator and the price chart at the end of a trend. By identifying regular divergences, we anticipate a change in trend direction resembling a reversal pattern.
Regular divergence has two types based on the trend and prediction:
Negative Regular Divergence (RD-) :
This type occurs between two price peaks at the end of an uptrend. Despite forming a new high, the indicator fails to recognize it, indicating a negative regular divergence. The likelihood of a subsequent downtrend is high. Negative divergence suggests strong selling pressure and weak buying power, portraying an unfavorable future for the stock.
Positive Regular Divergence (RD+) :
In contrast, positive regular divergence happens at the end of a downtrend and between two price troughs. As depicted in the chart, although the price forms a new low, the indicator doesn't acknowledge it. Positive regular divergence indicates robust buying pressure and weak selling power. Upon identifying positive divergence in the chart, we expect a price increase for the stock under review
🔵 How to Use
Information from the indicator is displayed in two ways: Table and Label.
🟣 Table : The table displays information about the latest divergence. This includes the type of divergence, existence or absence of divergence, consecutive divergences, divergence quality, and change in indicator phase.
Type Divergence : Indicates the type of divergence, which can be either "Bullish Divergence" or "Bearish Divergence."
Exist : Indicates the presence of divergence with a "+" sign and absence with a "-" sign. A green color is used for bullish divergence and red for bearish divergence.
Consecutive : Shows the number of consecutive divergences. For example, if there are 3 consecutive divergences, the number 3 is displayed.
Divergence Quality : Displays the quality of the divergence based on the number of consecutive divergences. If there is 1 divergence, the quality is "Normal"; for 2 divergences, it's "Good"; and for 3 or more divergences, it's "Strong."
Change Phase Indicator : Indicates whether a phase change in the indicator has occurred with "+" for yes and "-" for no.
🟣 Label : Unlike the table, which only shows information about the latest divergence, labels display information about each divergence at the point where it occurs. The information includes the type of divergence, detection method, divergence quality, consecutive divergences, and change in phase indicator. The selected method of detection is also displayed. For example, if the chosen method is the "AO" indicator, the label will show "Method: AO."
🔵 Settings
Fractal Period : Determines the period of swings. The minimum and default value is 2.
Divergence Detect Method : Selects the indicator (MACD, RSI, or AO) used for detecting divergences. The default indicator is MACD.
Show Fractal : Chooses whether to display fractals or not. The default is "No."
Show Table : Determines whether to display the table or not. The default is "Yes."
Show Label : Chooses whether to display labels or not. The default is "Yes."
Label Size : Adjusts the size of the labels from "Tiny" to "Large."

dmn's ICT AMD-Goldbach█ OVERVIEW
This script is built on ICT time & price theory and the theory of algorithmic market maker models, and visualizes the intraday divided using powers of three into accumulation, manipulation and distribution cycles.
It also includes an automatically calculated and plotted Goldbach level (a.k.a. IPDA level or Huddleston level) overlay, to help visualize where in the current market maker profile price is in relation to the AMD cycles, and where it might trade to.
█ CONCEPTS
Accumulation, Manipulation, Distribution Cycles
A 24 hour day, with the default set to start at 20:00 CET (the start of the Forex CLS Settlement operational timeline) is split in three parts - 9, 6 and 9 hours for the three cycles (roughly corresponding with Asia, London Open and New York + London Close sessions).
Since charts are fractals, there's also intra-cycle time fibs available in the script, to highlight the smaller fractal equivalents in each cycle.
These cycles are used to visualize the three phases (AMD) for easier identification of the current daily profile by analyzing during what cycle highs and lows of the day are made.
An example of a bullish day could be price rallying before making a low during the accumulation cycle, being manipulated higher and retracing to form an optimal trade entry during the manipulation cycle, expanding and creating the high of the day before selling off during the distribution cycle, with a potential reversal before it ends.
Goldbach levels
The Goldbach levels are based on the size of a price range (or price swing, if you will) expressed as a factor of power of three (3^n).
To decide what number to tell the script to use for the calculation, we look at what 3^n number best fits an average swing on the preferred timeframe we're trading.
For example; PO3 27 (3^3)might be fit for scalping, while PO3 243 (3^5) may correspond to the daily or weekly range, depending on the asset.
The script then calculates a range high and a range low using a power of three formula based on the current price and divides it into levels using Goldbach numbers.
At these levels one might expect to see price form various "blocks" as defined in concept by Michael J. Huddleston.
The blocks that correspond to the Goldbach levels are labeled with abbreviations as follows:
Ext = External range
Low = Range low
High = Range high
FVG = Fair value gap
RB = Rejection block
OB = Order block
LV = Liquidity void
BR = Breaker
MB = Mitigation block
Using these levels and said blocks we identify where in the current running market maker profile price is offered, and trade the preferred timeframe in line with the AMD cycles accordingly.
█ FEATURES
Custom AMD time cycles session times.
Custom time fib for fractal cycles.
Color and style customization.
Show only current or also historical cycles.
Equilibrium mode for Goldbach levels (show only high/low and midpoint)
Autodetection of asset type, with manual override.
█ NOTE
The default timings for the AMD cycles are set up for Forex pairs. For other asset types, such as indices, other timings are nessecary for optimal results.
Goldbach levels requires the correct symbol type setting for the calculation to work properly. Disable the script's autodetection and enable/disable the Forex option according to the type of chart if it fails.
Liquidity mapLocate institutional daily, weekly, and monthly liquidity intervention zones in an innovative format that allows you to fractalize the degree of trend reversal opportunity across multiple lengths!
Far from the traditional formats to tell you "where's the high/low", we display with this map the grab levels relating to the amplitudes of the measured period.
You can check "show old levels" to backtest these potential fractal reversal areas.
Use the levels that interest you according to your working UT (scalping, intraweek, swing, etc.), or take all the elements into consideration for your trading management :
Confluence the information to optimize your entry and shelter your stop loss under strong levels rejections !
Default parameters are: display high/low weekly & monthly, display liquidities levels in daily.

Synthetic Price Action GeneratorNOTICE:
First thing you need to know, it "DOES NOT" reflect the price of the ticker you will load it on. THIS IS NOT AN INDICATOR FOR TRADING! It's a developer tool solely generating random values that look exactly like the fractals we observe every single day. This script's generated candles are as fake as the never ending garbage news cycles we are often force fed and expected to believe by using carefully scripted narratives peddled as hypnotic truth to psychologically and emotionally influence you to the point of control by coercion and subjugation. I wanted to make the script's synthetic nature very clear using that analogy, it's dynamically artificial. Do not accidentally become disillusioned by this scripts values, make trading decisions from it, and lastly don't become victim to predatory media magic ministry parrots with pretty, handsome smiles, compelling you to board their ferris wheel of fear. Now, on to the good stuff...
BACKSTORY:
Occasionally I find myself in situations where I have to build analyzers in Pine to actually build novel quantitative analytic indicators and tools worthy of future use. These analyzers certainly don't exist on this platform, but usually are required to engineer and tweak algorithms of the highest quality with the finest computational caliber. I have numerous other synthesizers to publish besides this one.
For many reasons, I needed a synthetic environment to utilize the analyzers I built in Pine, to even pursue building some exotic indicators and algorithms. Pine doesn't allow sourcing of tuples. Not to mention, I required numerous Pine advancements to make long held dreams into tangible realities. Many Pine upgrades have arrived and MANY, MANY more are in need of implementation for all. Now that I have this, intending to use it in the future often when in need, you can now use it too. I do anticipate some skilled Pine poets will employ this intended handy utility to design and/or improved indicators for trading.
ORIGIN:
This was inspired by the brilliance from the world renowned ALGOmist John F. Ehlers, but it's taken on a completely alien form from its original DNA. Browsing on the internet for something else, I came across an article with a small code snippet, and I remembered an old wish of mine. I have long known that by flipping back and forth on specific tickers and timeframes in my Watchlist is not the most efficient way to evaluate indicators in multiple theatres of price action. I realized, I always wanted to possess and use this sort of tool, so... I put it into Pine form, but now have decided to inject it with Pine Script steroids. The outcome is highly mutable candle formations in a reusable mutagenic package, observable above and masquerading as genuine looking price candles.
OVERVIEW:
I guess you could call it a price action synthesizer, but I entitled it "Synthetic Price Action Generator" for those who may be searching for such a thing. You may find this more useful on the All or 5Y charts initially to witness indication from beginning (barstate.isfirst === barindex==0) to end (last_bar_index), but you may also use keyboard shortcuts + + to view the earliest plottable bars on any timeframe. I often use that keyboard shortcut to qualify an indicator through the entirety of it's runtime.
A lot can go wrong unexpectedly with indicator initialization, and you will never know it if you don't inspect it. Many recursively endowed Infinite Impulse Response (IIR) Filters can initialize with unintended results that minutely ring in slightly erroneous fashion for the entire runtime, beginning to end, causing deviations from "what should of been..." values with false signals. Looking closely at spg(), you will recognize that 3 EMAs are employed to manage and maintain randomness of CLOSE, HIGH, and LOW. In fact, any indicator's barindex==0 initialization can be inspected with the keyboard shortcuts above. If you see anything obviously strange in an authors indicator, please contact the developer if possible and respectfully notify them.
PURPOSE:
The primary intended application of this script, is to offer developers from advanced to even novice skill levels assistance with building next generation indicators. Mostly, it's purpose is for testing and troubleshooting indicators AND evaluating how they perform in a "manageable" randomized environment. Some times indicators flake out on rare but problematic price fluctuations, and this may help you with finding your issues/errata sooner than later. While the candles upon initial loading look pristine, by tweaking it to the minval/maxval parameters limits OR beyond with a few code modifications, you can generate unusual volatility, for instance... huge wicks. Limits of minval= and maxval= of are by default set to a comfort zone of operation. Massive wicks or candle bodies will undoubtedly affect your indication and often render them useless on tickers that exhibit that behavior, like WGMCF intraday currently.
Copy/paste boundaries are provided for relevant insertion into another script. Paste placement should happen at the very top of a script. Note that by overwriting the close, open, high, etc... values, your compiler will give you generous warnings of "variable shadowing" in abundance, but this is an expected part of applying it to your novel script, no worries. plotcandle() can be copied over too and enabled/disabled in Settings->Style. Always remember to fully remove this scripts' code and those assignments properly before actual trading use of your script occurs, AND specifically when publishing. The entirety of this provided code should never, never exist in a published indicator.
OTHER INTENTIONS:
Even though these are 100% synthetic generated price points, you will notice ALL of the fractal pseudo-patterns that commonly exist in the markets, are naturally occurring with this generator too. You can also swiftly immerse yourself in pattern recognition exercises with increased efficiency in real time by clicking any SPAG Setting in focus and then using the up/down arrow keys. I hope I explained potential uses adequately...
On a personal note, the existence of fractal symmetry often makes me wonder, do we truly live in a totality chaotic universe or is it ordered mathematically for some outcomes to a certain extent. I think both. My observations, it's a pre-deterministic reality completely influenced by infinitesimal amounts of sentient free will with unimaginable existing and emerging quantities. Some how an unknown mysterious mechanism governing the totality of universal physics and mathematics counts this 100.0% flawlessly and perpetually. Anyways, you can't change the past that long existed before your birth or even yesterday, but you can choose to dream, create, and forge the future into your desires and hopes. As always, shite always happens when your not looking for it. What you choose to do after stepping in it unintentionally... is totally up to you. :) Maybe this tool and tips provided will aid you in not stepping in an algo cachucha up to your ankles somehow.
SCRIPTING LESSONS PORTRAYED IN THIS SCRIPT:
Pine etiquette and code cleanliness
Overwrite capabilities of built-in Pine variables for testing indicators
Various techniques to organize Settings panel while providing ease of adjustment utility
Use of tooltip= to provide users adequate valuable information. Most people want to trade with indicators, not blindly make adjustments to them without any knowledge of their intended operation/effects
When available time provides itself, I will consider your inquiries, thoughts, and concepts presented below in the comments section, should you have any questions or comments regarding this indicator. When my indicators achieve more prevalent use by TV members , I may implement more ideas when they present themselves as worthy additions. Have a profitable future everyone!

Bill Williams SystemBill Williams System combine all indicators of Mr. Bill Williams into one window with detail below:
1. Top of window:
Display Fractals with shape triangle down is bottom fractal and shape triangle up is top fractal
2. Bottom of window:
Display Alligator Trend Flat with trend defined as below:
* Up trend: Lips value shift 3 bars greater than Teeth value shift 5 bars. And Teeth value shift 5 bars greater than Jaws value shift 8 bars. By default up trend is green square.
* Down trend: Lips value shift 3 bars less than Teeth value shift 5 bars. And Teeth value shift 5 bars less than Jaws value shift 8 bars. By default down trend is red square.
* Choppy: not up trend and not down trend. By default choppy is gray square.
3. Moving around zero line
* Awesome Oscillator is circles.
* Accelerator Oscillator is columns.
* Gator Oscillator is area.
