Syndicate Bias Universal (Auto)Syndicate Bias Universal (Auto): A Masterclass in Time-Based Trading
Chapter 1: The Modern Trader's Dilemma—A New Framework for a Noisy Market
In today's hyper-connected financial markets, the modern trader is faced with a profound paradox: we have access to more information than ever before, yet achieving consistent clarity has never been more challenging. We are inundated with a relentless stream of price data, countless indicators, breaking news, and expert opinions. This information overload often leads not to better decision-making, but to analysis paralysis, emotional trading, and a chronic sense of being one step behind the market's true intentions.
The fundamental problem that Syndicate Bias Universal (Auto) addresses is this struggle for clarity amidst the noise. It challenges the conventional approach of relying solely on price- and volume-based indicators, which are inherently lagging and often produce conflicting signals. Instead, it introduces a crucial, and often overlooked, third dimension to technical analysis: time.
This indicator is not merely another tool to be added to a cluttered chart; it is a comprehensive, systematic framework designed to reinterpret market dynamics through the structured lens of trading sessions. Its core function is to deconstruct any trading period—from an entire week down to the smallest intraday segments—into a clear, four-part narrative structure, which we call "Quarters."
Many traders can correctly identify a market's general direction but consistently struggle with the critical question of when to act. This timing issue leads to the most common trading errors: entering positions too early only to be stopped out by volatility, entering too late and catching the tail-end of a move, or being whipsawed by directionless chop. This script provides a logical, rules-based solution by identifying a specific, high-probability time window within each session where reversal setups are most likely to occur. It is built for the discerning trader who is ready to evolve—to move beyond reactive, emotionally-driven decisions and adopt a structured, patient, and objective methodology for market engagement. It is, in essence, an operating system for disciplined trading.
Chapter 2: The Core Philosophy—Viewing the Market as a Four-Quarter Game
At its heart, this indicator operates on a powerful principle: market sessions, regardless of their duration, exhibit a discernible rhythm and structure, much like a four-quarter game of football, a four-act theatrical play, or the four seasons of a year. Price action is not a chaotic, random walk. It is a story unfolding, driven by the collective psychology of millions of participants. This story often follows a recurring pattern of opening, exploration, climax, and resolution.
By dividing trading sessions into four distinct quarters, we can better contextualize this narrative. This temporal structure acts as a powerful filter, cutting through the incessant noise of minor price fluctuations and focusing the trader's attention on the moments that truly matter.
Quarter 1 (The Opening Act): This is the period of price discovery. The market is absorbing overnight news, and early participants are establishing their initial positions. The character of this quarter—whether it is quiet and rotational or strong and directional—provides crucial clues about the session's potential.
Quarter 2 (The Exploration): Following the initial open, the market begins to test the levels established in Q1. This is often a period of consolidation or early trend development, where weaker hands are shaken out.
Quarter 3 (The Climax): Often, this is where the session's primary, decisive move occurs. It can be a powerful trend continuation or, critically, a major reversal point where the initial momentum shows signs of exhaustion.
Quarter 4 (The Resolution): This is the closing period, characterized by profit-taking, late-day position adjustments, and a general decrease in volume as the session winds down.
This is not a "black box" system promising guaranteed results. It is a transparent methodology built on a clear, logical foundation of session analysis. Its purpose is to empower you with a deeper understanding of market behavior, transforming you from a mere participant, tossed about by the market's waves, into a patient observer who waits for specific, high-probability conditions to align before acting. Embracing this philosophy is the first and most crucial step to unlocking the tool's full potential.
Chapter 3: The Engine—Key Features & In-Depth Principles
This section dissects the sophisticated mechanics that power the indicator. Each feature is designed to work in concert, creating a robust and adaptive analytical engine.
Feature 1: Universal Market Adaptability—A Global, Intelligent Tool
A significant weakness of many trading tools is their inherent rigidity. An indicator fine-tuned for the unique volatility profile and session times of the New York open will invariably underperform or provide false signals when applied to the different rhythms of the Indian or Asian markets. Syndicate Bias Universal eradicates this problem with a sophisticated, dual-mode adaptability engine.
Intelligent Auto-Detection: This is the default and recommended setting for most traders. When the "Market Type" input is set to "Auto," the script becomes a dynamic, context-aware tool. It intelligently queries the exchange information (syminfo.prefix) of the instrument you are currently viewing. It automatically recognizes major Indian exchanges (NSE, BSE, MCX) and all other global exchanges. Based on this identification, it seamlessly applies the correct session timing logic—using "Asia/Kolkata" for Indian instruments and "America/New_York" for global instruments (Forex, Commodities, US Equities, etc.).
This allows traders with a diverse watchlist to move effortlessly from analyzing the NIFTY 50 to EUR/USD to Crude Oil, confident that the underlying temporal analysis remains precise, relevant, and correctly calibrated to the dominant trading hours of each asset. There is no need for manual adjustment or multiple chart templates; the indicator handles the complex work of timezone alignment for you.
Focused Manual Override: For the advanced trader, the manual override provides an indispensable layer of analytical control. There are specific scenarios where locking the indicator to a particular time zone, regardless of the asset being viewed, is crucial.
Cross-Market Influence Analysis: A European trader analyzing the DAX index might want to lock the indicator to "Global" (New York) time during the afternoon to see how the US open influences the German market's behavior in its final hours.
Commodity and Forex Trading: A trader in Asia specializing in WTI Crude Oil or Gold knows that these markets are heavily dominated by the New York session. By locking the indicator to "Global," they can apply the correct temporal structure to their analysis, even if their local time is different.
Consistent Strategy Application: A trader who has developed a strategy based purely on the London/New York session overlap can lock the indicator to "Global" and apply this single, consistent framework across any and all instruments they trade.
This dual-mode system ensures that the indicator is both effortlessly simple for those who need it to be and powerfully flexible for those who require granular control.
Feature 2: Fractal Quarter-Based Analysis—Structure at Every Scale
The term "fractal" in market analysis refers to the principle that the same patterns of collective human behavior—driven by greed, fear, hope, and indecision—manifest repeatedly across all timeframes. A pattern that takes months to unfold on a weekly chart can play out in a matter of minutes on a one-minute chart. The Syndicate Bias Universal indicator is built on this very principle, applying its Four-Quarter structure consistently from the highest macro view down to the lowest micro view.
This provides a unified, coherent framework for analysis, regardless of your trading style.
The Weekly Quarter (The Position Trader's View): At this macro level, the trading week is divided into four primary segments (e.g., Monday, Tuesday, Wednesday, Thursday). This perspective is invaluable for position traders and long-term investors. It helps answer critical strategic questions: Is the week's opening action on Monday establishing a trend that will likely hold, or is it creating the conditions for a mid-week reversal? The weekly quarters help contextualize the larger battle between long-term buyers and sellers.
The Daily Quarter (The Swing Trader's View): Here, the full 24-hour global trading day is partitioned into four 6-hour quarters. This is the ideal lens for swing traders and day traders who aim to capture the dominant move of the day or a multi-day swing. It helps them avoid the morning "chop" by understanding the initial price discovery phase and position themselves for the more decisive moves that often occur in the later quarters of the global session.
Intraday Quarters: 90min, Micro, and Nano (The Day Trader's & Scalper's View): For traders operating on the front lines of intraday price action, the script drills down with surgical precision. It breaks down shorter sessions into their own complete four-quarter cycles. This granular view is essential for timing precise entries, managing trades with tight stop-losses, and understanding the micro-rhythms of order flow. It helps scalpers identify high-probability windows to trade, while allowing them to step back and avoid periods of low liquidity or erratic price action.
To keep you anchored, the script automatically selects and displays the relevant analysis timeframe ("Auto TF") in a non-intrusive display on your chart. This seemingly simple feature is a crucial navigational tool, constantly reminding you of the specific temporal context the engine is currently analyzing, ensuring your decisions are always aligned with the appropriate structural scale.
Feature 3: The "S-Quarter" Timing Window—The Art of Strategic Patience
This is the intellectual core of the indicator and its most powerful feature. It is the mechanism that transforms trading from a constant, stressful hunt for opportunities into a calm, disciplined, and strategic wait. The S-Quarter (Search Quarter) engine enforces patience by activating its search for trade setups only within a specific, algorithmically determined time window.
The Q1 Volatility Profile Analysis: The process begins at the start of a new session. The indicator's logic performs a sophisticated analysis of the price action within the first quarter (Q1). It looks beyond simple direction and evaluates its character. This involves assessing the nature of the opening period's volatility. Is the range expanding or contracting? Is the price action rotational and indecisive, or is it directional and backed by momentum? A quiet, low-volatility Q1 suggests a different market psychology and implies a very different probabilistic path for the rest of the session compared to a strong, high-volume, trend-setting Q1.
Dynamic and Adaptive Window Selection: Based on this nuanced Q1 profile, the script makes a critical, forward-looking determination: which of the subsequent quarters (Q2, Q3, or Q4) is most likely to host a significant market turning point, a liquidity grab, or an exhaustion event. This designated period is the "S-Quarter." The selection is dynamic and adaptive:
If Q1 was a powerful, trending move, the engine might identify Q3 as the S-Quarter, anticipating that the initial momentum will wane, drawing in late trend-followers just in time for a sharp reversal.
If Q1 was a tight, rotational range, the engine might identify Q2 as the S-Quarter, anticipating that the first breakout attempt from this range will likely be a "head fake" designed to trap traders before the real move begins in the opposite direction.
This intelligent selection is what sets the tool apart. It doesn't use a fixed, one-size-fits-all timing window. It adapts its search to the unique, unfolding conditions of each individual trading session. The S-Quarter is the only time the script will actively look for and display trade setups. This powerful filter is the key to mastering trading psychology. It prevents impulsive entries, eliminates the fear of missing out (FOMO), dramatically reduces exposure to choppy and unpredictable market periods, and aligns your actions with the moments of highest probabilistic edge.
Feature 4: Contrarian Reversal Setups—Identifying Market Exhaustion
The setups generated by this indicator are contrarian by design. They are not trend-following signals. They are based on the principle of identifying moments where a prevailing short-term move is reaching a point of exhaustion, often culminating in a "liquidity grab."
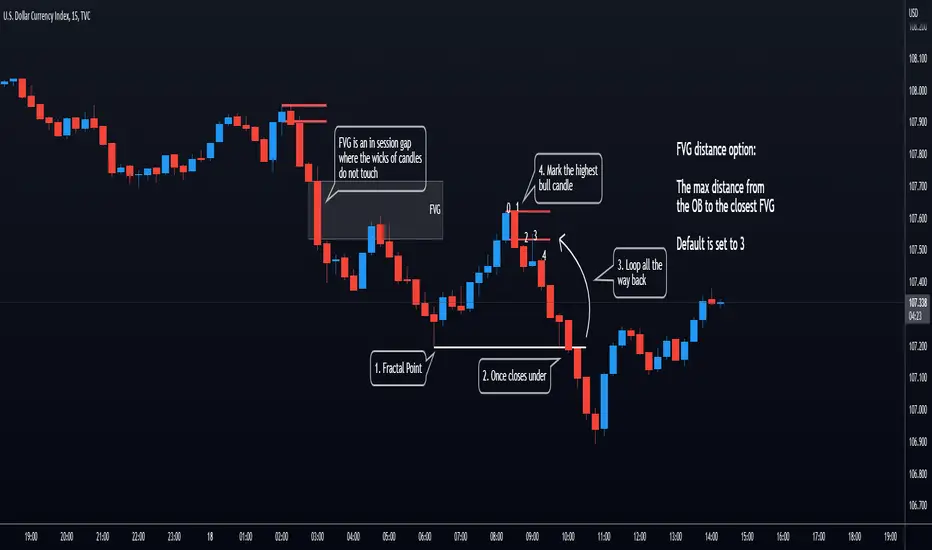
The Mechanics of a Liquidity Grab: Within the pre-defined S-Quarter, the script vigilantly monitors short-term market structure, specifically the pivot highs and pivot lows. A break of a recent, significant pivot is a critical event. The script's logic posits that during the S-Quarter, these breakouts are often not the beginning of a sustained new trend. Instead, they are frequently a calculated move by institutional players to "run the stops"—a stop hunt designed to trigger the stop-loss orders of retail traders who are positioned on the wrong side of the market. This action injects a surge of liquidity into the market, which is precisely what larger players need to fill their large orders in the opposite direction.
Bullish Reversal Setup (Fading the Low): This setup is triggered by a break below a recent structural low during the S-Quarter. This event signals that the sellers who pushed the price to a new low may have exhausted their power in the process of running the stops. The trap has been set, and this alert serves as a potential turning point where buyers are likely to step in with force.
Bearish Reversal Setup (Fading the High): This setup is triggered by a break above a recent structural high during the S-Quarter. This suggests that the final, euphoric wave of buying pressure may be culminating in a liquidity grab. The last of the breakout buyers have been drawn in at the worst possible price, presenting an opportunity for informed sellers to take control and initiate a move downwards.
It is absolutely essential to understand that these are high-probability setups, not automated entry signals. They are sophisticated alerts that tell you, "The conditions are now ripe for a potential reversal within our strategic time window." The final decision to execute a trade, and the management of that trade, always rests with you, the trader.
Chapter 4: The Workflow—A Step-by-Step Guide to Practical Application
This section provides a clear, actionable workflow for integrating the Syndicate Bias Universal indicator into your daily trading routine.
Step 1: Initial Configuration (The Pre-Flight Check). Begin by setting the "Market Type." For maximum efficiency across a varied watchlist, leave it on "Auto." If you are a specialist who focuses on one specific market session, manually select "Global" or "Indian" to lock in your preferred analytical framework. Ensure other visual settings, like "Show Active Quarter Boxes," are enabled.
Step 2: Contextualize the Session (Reading the Field). At the start of your trading day, observe the quarter boxes as they begin to form. Pay attention to the story they tell. Is the Q1 box narrow and tight, suggesting indecision? Is it wide and directional, suggesting a strong opening sentiment? This visual context helps you build an intuitive feel for the session's rhythm long before any signal appears.
Step 3: Exercise Strategic Patience (The Professional's Edge). This is the most critical and often the most difficult step. The script will automatically perform its Q1 analysis and silently determine the S-Quarter. Your job is to wait. Resist the urge to trade during the other quarters. This disciplined inaction is not passive; it is an active strategy. It conserves your mental and financial capital for the moments that count the most.
Step 4: The Alert (The Call to Action). When a label—"Look for Bullish/Bearish reversal"—appears on your chart, it is your cue to shift from a passive, observational state to an active, analytical one. This is the moment you have been waiting for. Do not instantly click "buy" or "sell." The alert is a call to focus your attention, not a command to act blindly.
Step 5: The Confirmation Process (Your Personal Edge). The setup is the start, not the end, of your trade analysis. This is where you apply your own skills to confirm the validity of the setup. For example, upon seeing a Bullish Reversal Setup:
Candlestick Analysis: Look for confirmation candles like a powerful bullish engulfing bar, a hammer, or a dragonfly doji forming right after the new low was made.
Volume Analysis: Check if the move to the new low was on high, climactic volume that suddenly dried up, followed by an increase in volume as the price starts to reverse.
Indicator Confluence: Look for bullish divergence on an oscillator like the RSI or MACD, where price makes a new low but the indicator makes a higher low.
This confirmation process is what integrates the indicator into your unique trading style, making it exponentially more powerful.
Step 6: Execute and Manage Risk (The Business of Trading). Once you have your confirmation, execute your trade according to your plan. Risk management is paramount. A logical stop-loss for a Bullish Reversal Setup would typically be placed just below the low of the liquidity grab candle. Your take-profit targets should be based on your analysis of key resistance levels. Always ensure the potential reward of the trade justifies the initial risk. A setup is a probabilistic edge, not a certainty.
Chapter 5: The Trader's Mind—Mastering the Psychology of Time
Integrating this tool effectively is as much about mastering psychology as it is about technical analysis. Its very design encourages the development of a professional trading mindset.
From Impulsive to Patient: The S-Quarter forces you to wait for the market to come to you, curing the impulsive need to be "in a trade" at all times.
From Reactive to Proactive: You are no longer reacting to every price tick. You have a proactive plan: you know which time window you are interested in and what condition you are waiting for. This puts you in a position of mental control.
Building Unshakeable Discipline: By consistently following the framework, you are building the muscle of discipline. You learn that often the most profitable action is no action at all.
Conquering FOMO (Fear Of Missing Out): FOMO is driven by unstructured, random trading. When you know you are only interested in a specific type of setup within a specific time window, the moves that happen outside of that framework become irrelevant noise. You cannot miss a move you were never supposed to take.
Gaining Confidence Through Structure: The clarity and structure provided by the Four-Quarter framework build immense confidence. You are not guessing; you are executing a well-defined plan based on a logical, repeatable methodology.
Chapter 6: Frequently Asked Questions & Scenarios
Q: What happens if no setup appears during the S-Quarter?
A: This is one of the most valuable outcomes the indicator can provide. It means that during the high-probability window, the market did not produce a clear exhaustion or liquidity grab event. The script has effectively told you that the conditions were not optimal for a high-probability reversal, and the correct decision was to preserve your capital. A null signal is a powerful signal in itself.
Q: Can I use this indicator with my existing trend-following strategy?
A: Absolutely. In fact, it's a perfect combination. You can use your macro trend-following tools to establish the dominant weekly or daily direction. Then, you can use the Syndicate Bias Universal indicator on a lower timeframe to look for contrarian setups that signal the end of a pullback, allowing you to enter the trade in the direction of the larger trend at a much better price.
Q: Which analysis timeframe ("Auto TF") is the 'best' one to use?
A: There is no "best" timeframe; there is only the timeframe that is right for your trading style. This is precisely why the fractal design is so powerful. A long-term swing trader might focus primarily on the signals generated by the Daily quarters, while a high-frequency scalper will live within the Micro and Nano quarters. The indicator adapts to you, not the other way around. Experiment and find the resolution that best suits your personality and trading goals.
ابحث في النصوص البرمجية عن "Fractal"

Stochastic Enhanced [DCAUT]█ Stochastic Enhanced
📊 ORIGINALITY & INNOVATION
The Stochastic Enhanced indicator builds upon George Lane's classic momentum oscillator (developed in the late 1950s) by providing comprehensive smoothing algorithm flexibility. While traditional implementations limit users to Simple Moving Average (SMA) smoothing, this enhanced version offers 21 advanced smoothing algorithms, allowing traders to optimize the indicator's characteristics for different market conditions and trading styles.
Key Improvements:
Extended from single SMA smoothing to 21 professional-grade algorithms including adaptive filters (KAMA, FRAMA), zero-lag methods (ZLEMA, T3), and advanced digital filters (Kalman, Laguerre)
Maintains backward compatibility with traditional Stochastic calculations through SMA default setting
Unified smoothing algorithm applies to both %K and %D lines for consistent signal processing characteristics
Enhanced visual feedback with clear color distinction and background fill highlighting for intuitive signal recognition
Comprehensive alert system covering crossovers and zone entries for systematic trade management
Differentiation from Traditional Stochastic:
Traditional Stochastic indicators use fixed SMA smoothing, which introduces consistent lag regardless of market volatility. This enhanced version addresses the limitation by offering adaptive algorithms that adjust to market conditions (KAMA, FRAMA), reduce lag without sacrificing smoothness (ZLEMA, T3, HMA), or provide superior noise filtering (Kalman Filter, Laguerre filters). The flexibility helps traders balance responsiveness and stability according to their specific needs.
📐 MATHEMATICAL FOUNDATION
Core Stochastic Calculation:
The Stochastic Oscillator measures the position of the current close relative to the high-low range over a specified period:
Step 1: Raw %K Calculation
%K_raw = 100 × (Close - Lowest Low) / (Highest High - Lowest Low)
Where:
Close = Current closing price
Lowest Low = Lowest low over the %K Length period
Highest High = Highest high over the %K Length period
Result ranges from 0 (close at period low) to 100 (close at period high)
Step 2: Smoothed %K Calculation
%K = MA(%K_raw, K Smoothing Period, MA Type)
Where:
MA = Selected moving average algorithm (SMA, EMA, etc.)
K Smoothing = 1 for Fast Stochastic, 3+ for Slow Stochastic
Traditional Fast Stochastic uses %K_raw directly without smoothing
Step 3: Signal Line %D Calculation
%D = MA(%K, D Smoothing Period, MA Type)
Where:
%D acts as a signal line and moving average of %K
D Smoothing typically set to 3 periods in traditional implementations
Both %K and %D use the same MA algorithm for consistent behavior
Available Smoothing Algorithms (21 Options):
Standard Moving Averages:
SMA (Simple): Equal-weighted average, traditional default, consistent lag characteristics
EMA (Exponential): Recent price emphasis, faster response to changes, exponential decay weighting
RMA (Rolling/Wilder's): Smoothed average used in RSI, less reactive than EMA
WMA (Weighted): Linear weighting favoring recent data, moderate responsiveness
VWMA (Volume-Weighted): Incorporates volume data, reflects market participation intensity
Advanced Moving Averages:
HMA (Hull): Reduced lag with smoothness, uses weighted moving averages and square root period
ALMA (Arnaud Legoux): Gaussian distribution weighting, minimal lag with good noise reduction
LSMA (Least Squares): Linear regression based, fits trend line to data points
DEMA (Double Exponential): Reduced lag compared to EMA, uses double smoothing technique
TEMA (Triple Exponential): Further lag reduction, triple smoothing with lag compensation
ZLEMA (Zero-Lag Exponential): Lag elimination attempt using error correction, very responsive
TMA (Triangular): Double-smoothed SMA, very smooth but slower response
Adaptive & Intelligent Filters:
T3 (Tilson T3): Six-pass exponential smoothing with volume factor adjustment, excellent smoothness
FRAMA (Fractal Adaptive): Adapts to market fractal dimension, faster in trends, slower in ranges
KAMA (Kaufman Adaptive): Efficiency ratio based adaptation, responds to volatility changes
McGinley Dynamic: Self-adjusting mechanism following price more accurately, reduced whipsaws
Kalman Filter: Optimal estimation algorithm from aerospace engineering, dynamic noise filtering
Advanced Digital Filters:
Ultimate Smoother: Advanced digital filter design, superior noise rejection with minimal lag
Laguerre Filter: Time-domain filter with N-order implementation, adjustable lag characteristics
Laguerre Binomial Filter: 6-pole Laguerre filter, extremely smooth output for long-term analysis
Super Smoother: Butterworth filter implementation, removes high-frequency noise effectively
📊 COMPREHENSIVE SIGNAL ANALYSIS
Absolute Level Interpretation (%K Line):
%K Above 80: Overbought condition, price near period high, potential reversal or pullback zone, caution for new long entries
%K in 70-80 Range: Strong upward momentum, bullish trend confirmation, uptrend likely continuing
%K in 50-70 Range: Moderate bullish momentum, neutral to positive outlook, consolidation or mild uptrend
%K in 30-50 Range: Moderate bearish momentum, neutral to negative outlook, consolidation or mild downtrend
%K in 20-30 Range: Strong downward momentum, bearish trend confirmation, downtrend likely continuing
%K Below 20: Oversold condition, price near period low, potential bounce or reversal zone, caution for new short entries
Crossover Signal Analysis:
%K Crosses Above %D (Bullish Cross): Momentum shifting bullish, faster line overtakes slower signal, consider long entry especially in oversold zone, strongest when occurring below 20 level
%K Crosses Below %D (Bearish Cross): Momentum shifting bearish, faster line falls below slower signal, consider short entry especially in overbought zone, strongest when occurring above 80 level
Crossover in Midrange (40-60): Less reliable signals, often in choppy sideways markets, require additional confirmation from trend or volume analysis
Multiple Failed Crosses: Indicates ranging market or choppy conditions, reduce position sizes or avoid trading until clear directional move
Advanced Divergence Patterns (%K Line vs Price):
Bullish Divergence: Price makes lower low while %K makes higher low, indicates weakening bearish momentum, potential trend reversal upward, more reliable when %K in oversold zone
Bearish Divergence: Price makes higher high while %K makes lower high, indicates weakening bullish momentum, potential trend reversal downward, more reliable when %K in overbought zone
Hidden Bullish Divergence: Price makes higher low while %K makes lower low, indicates trend continuation in uptrend, bullish trend strength confirmation
Hidden Bearish Divergence: Price makes lower high while %K makes higher high, indicates trend continuation in downtrend, bearish trend strength confirmation
Momentum Strength Analysis (%K Line Slope):
Steep %K Slope: Rapid momentum change, strong directional conviction, potential for extended moves but also increased reversal risk
Gradual %K Slope: Steady momentum development, sustainable trends more likely, lower probability of sharp reversals
Flat or Horizontal %K: Momentum stalling, potential reversal or consolidation ahead, wait for directional break before committing
%K Oscillation Within Range: Indicates ranging market, sideways price action, better suited for range-trading strategies than trend following
🎯 STRATEGIC APPLICATIONS
Mean Reversion Strategy (Range-Bound Markets):
Identify ranging market conditions using price action or Bollinger Bands
Wait for Stochastic to reach extreme zones (above 80 for overbought, below 20 for oversold)
Enter counter-trend position when %K crosses %D in extreme zone (sell on bearish cross above 80, buy on bullish cross below 20)
Set profit targets near opposite extreme or midline (50 level)
Use tight stop-loss above recent swing high/low to protect against breakout scenarios
Exit when Stochastic reaches opposite extreme or %K crosses %D in opposite direction
Trend Following with Momentum Confirmation:
Identify primary trend direction using higher timeframe analysis or moving averages
Wait for Stochastic pullback to oversold zone (<20) in uptrend or overbought zone (>80) in downtrend
Enter in trend direction when %K crosses %D confirming momentum shift (bullish cross in uptrend, bearish cross in downtrend)
Use wider stops to accommodate normal trend volatility
Add to position on subsequent pullbacks showing similar Stochastic pattern
Exit when Stochastic shows opposite extreme with failed cross or bearish/bullish divergence
Divergence-Based Reversal Strategy:
Scan for divergence between price and Stochastic at swing highs/lows
Confirm divergence with at least two price pivots showing divergent Stochastic readings
Wait for %K to cross %D in direction of anticipated reversal as entry trigger
Enter position in divergence direction with stop beyond recent swing extreme
Target profit at key support/resistance levels or Fibonacci retracements
Scale out as Stochastic reaches opposite extreme zone
Multi-Timeframe Momentum Alignment:
Analyze Stochastic on higher timeframe (4H or Daily) for primary trend bias
Switch to lower timeframe (1H or 15M) for precise entry timing
Only take trades where lower timeframe Stochastic signal aligns with higher timeframe momentum direction
Higher timeframe Stochastic in bullish zone (>50) = only take long entries on lower timeframe
Higher timeframe Stochastic in bearish zone (<50) = only take short entries on lower timeframe
Exit when lower timeframe shows counter-signal or higher timeframe momentum reverses
Zone Transition Strategy:
Monitor Stochastic for transitions between zones (oversold to neutral, neutral to overbought, etc.)
Enter long when Stochastic crosses above 20 (exiting oversold), signaling momentum shift from bearish to neutral/bullish
Enter short when Stochastic crosses below 80 (exiting overbought), signaling momentum shift from bullish to neutral/bearish
Use zone midpoint (50) as dynamic support/resistance for position management
Trail stops as Stochastic advances through favorable zones
Exit when Stochastic fails to maintain momentum and reverses back into prior zone
📋 DETAILED PARAMETER CONFIGURATION
%K Length (Default: 14):
Lower Values (5-9): Highly sensitive to price changes, generates more frequent signals, increased false signals in choppy markets, suitable for very short-term trading and scalping
Standard Values (10-14): Balanced sensitivity and reliability, traditional default (14) widely used,适合 swing trading and intraday strategies
Higher Values (15-21): Reduced sensitivity, smoother oscillations, fewer but potentially more reliable signals, better for position trading and lower timeframe noise reduction
Very High Values (21+): Slow response, long-term momentum measurement, fewer trading signals, suitable for weekly or monthly analysis
%K Smoothing (Default: 3):
Value 1: Fast Stochastic, uses raw %K calculation without additional smoothing, most responsive to price changes, generates earliest signals with higher noise
Value 3: Slow Stochastic (default), traditional smoothing level, reduces false signals while maintaining good responsiveness, widely accepted standard
Values 5-7: Very slow response, extremely smooth oscillations, significantly reduced whipsaws but delayed entry/exit timing
Recommendation: Default value 3 suits most trading scenarios, active short-term traders may use 1, conservative long-term positions use 5+
%D Smoothing (Default: 3):
Lower Values (1-2): Signal line closely follows %K, frequent crossover signals, useful for active trading but requires strict filtering
Standard Value (3): Traditional setting providing balanced signal line behavior, optimal for most trading applications
Higher Values (4-7): Smoother signal line, fewer crossover signals, reduced whipsaws but slower confirmation, better for trend trading
Very High Values (8+): Signal line becomes slow-moving reference, crossovers rare and highly significant, suitable for long-term position changes only
Smoothing Type Algorithm Selection:
For Trending Markets:
ZLEMA, DEMA, TEMA: Reduced lag for faster trend entry, quick response to momentum shifts, suitable for strong directional moves
HMA, ALMA: Good balance of smoothness and responsiveness, effective for clean trend following without excessive noise
EMA: Classic choice for trending markets, faster than SMA while maintaining reasonable stability
For Ranging/Choppy Markets:
Kalman Filter, Super Smoother: Superior noise filtering, reduces false signals in sideways action, helps identify genuine reversal points
Laguerre Filters: Smooth oscillations with adjustable lag, excellent for mean reversion strategies in ranges
T3, TMA: Very smooth output, filters out market noise effectively, clearer extreme zone identification
For Adaptive Market Conditions:
KAMA: Automatically adjusts to market efficiency, fast in trends and slow in congestion, reduces whipsaws during transitions
FRAMA: Adapts to fractal market structure, responsive during directional moves, conservative during uncertainty
McGinley Dynamic: Self-adjusting smoothing, follows price naturally, minimizes lag in trending markets while filtering noise in ranges
For Conservative Long-Term Analysis:
SMA: Traditional choice, predictable behavior, widely understood characteristics
RMA (Wilder's): Smooth oscillations, reduced sensitivity to outliers, consistent behavior across market conditions
Laguerre Binomial Filter: Extremely smooth output, ideal for weekly/monthly timeframe analysis, eliminates short-term noise completely
Source Selection:
Close (Default): Standard choice using closing prices, most common and widely tested
HLC3 or OHLC4: Incorporates more price information, reduces impact of sudden spikes or gaps, smoother oscillator behavior
HL2: Midpoint of high-low range, emphasizes intrabar volatility, useful for markets with wide intraday ranges
Custom Source: Can use other indicators as input (e.g., Heikin Ashi close, smoothed price), creates derivative momentum indicators
📈 PERFORMANCE ANALYSIS & COMPETITIVE ADVANTAGES
Responsiveness Characteristics:
Traditional SMA-Based Stochastic:
Fixed lag regardless of market conditions, consistent delay of approximately (K Smoothing + D Smoothing) / 2 periods
Equal treatment of trending and ranging markets, no adaptation to volatility changes
Predictable behavior but suboptimal in varying market regimes
Enhanced Version with Adaptive Algorithms:
KAMA and FRAMA reduce lag by up to 40-60% in strong trends compared to SMA while maintaining similar smoothness in ranges
ZLEMA and T3 provide near-zero lag characteristics for early entry signals with acceptable noise levels
Kalman Filter and Super Smoother offer superior noise rejection, reducing false signals in choppy conditions by estimations of 30-50% compared to SMA
Performance improvements vary by algorithm selection and market conditions
Signal Quality Improvements:
Adaptive algorithms help reduce whipsaw trades in ranging markets by adjusting sensitivity dynamically
Advanced filters (Kalman, Laguerre, Super Smoother) provide clearer extreme zone readings for mean reversion strategies
Zero-lag methods (ZLEMA, DEMA, TEMA) generate earlier crossover signals in trending markets for improved entry timing
Smoother algorithms (T3, Laguerre Binomial) reduce false extreme zone touches for more reliable overbought/oversold signals
Comparison with Standard Implementations:
Versus Basic Stochastic: Enhanced version offers 21 smoothing options versus single SMA, allowing optimization for specific market characteristics and trading styles
Versus RSI: Stochastic provides range-bound measurement (0-100) with clear extreme zones, RSI measures momentum speed, Stochastic offers clearer visual overbought/oversold identification
Versus MACD: Stochastic bounded oscillator suitable for mean reversion, MACD unbounded indicator better for trend strength, Stochastic excels in range-bound and oscillating markets
Versus CCI: Stochastic has fixed bounds (0-100) for consistent interpretation, CCI unbounded with variable extremes, Stochastic provides more standardized extreme readings across different instruments
Flexibility Advantages:
Single indicator adaptable to multiple strategies through algorithm selection rather than requiring different indicator variants
Ability to optimize smoothing characteristics for specific instruments (e.g., smoother for crypto volatility, faster for forex trends)
Multi-timeframe analysis with consistent algorithm across timeframes for coherent momentum picture
Backtesting capability with algorithm as optimization parameter for strategy development
Limitations and Considerations:
Increased complexity from multiple algorithm choices may lead to over-optimization if parameters are curve-fitted to historical data
Adaptive algorithms (KAMA, FRAMA) have adjustment periods during market regime changes where signals may be less reliable
Zero-lag algorithms sacrifice some smoothness for responsiveness, potentially increasing noise sensitivity in very choppy conditions
Performance characteristics vary significantly across algorithms, requiring understanding and testing before live implementation
Like all oscillators, Stochastic can remain in extreme zones for extended periods during strong trends, generating premature reversal signals
USAGE NOTES
This indicator is designed for technical analysis and educational purposes to provide traders with enhanced flexibility in momentum analysis. The Stochastic Oscillator has limitations and should not be used as the sole basis for trading decisions.
Important Considerations:
Algorithm performance varies with market conditions - no single smoothing method is optimal for all scenarios
Extreme zone signals (overbought/oversold) indicate potential reversal areas but not guaranteed turning points, especially in strong trends
Crossover signals may generate false entries during sideways choppy markets regardless of smoothing algorithm
Divergence patterns require confirmation from price action or additional indicators before trading
Past indicator characteristics and backtested results do not guarantee future performance
Always combine Stochastic analysis with proper risk management, position sizing, and multi-indicator confirmation
Test selected algorithm on historical data of specific instrument and timeframe before live trading
Market regime changes may require algorithm adjustment for optimal performance
The enhanced smoothing options are intended to provide tools for optimizing the indicator's behavior to match individual trading styles and market characteristics, not to create a perfect predictive tool. Responsible usage includes understanding the mathematical properties of selected algorithms and their appropriate application contexts.

Hurst Momentum Oscillator | AlphaNattHurst Momentum Oscillator | AlphaNatt
An adaptive oscillator that combines the Hurst Exponent - which identifies whether markets are trending or mean-reverting - with momentum analysis to create signals that automatically adjust to market regime.
"The Hurst Exponent reveals a hidden truth: markets aren't always trending. This oscillator knows when to ride momentum and when to fade it."
━━━━━━━━━━━━━━━━━━━━━━━━━━━━━━━━━━━━━━━━
📐 THE MATHEMATICS
Hurst Exponent (H):
Measures the long-term memory of time series:
H > 0.5: Trending (persistent) behavior
H = 0.5: Random walk
H < 0.5: Mean-reverting behavior
Originally developed for analyzing Nile river flooding patterns, now used in:
Fractal market analysis
Network traffic prediction
Climate modeling
Financial markets
The Innovation:
This oscillator multiplies momentum by the Hurst coefficient:
When trending (H > 0.5): Momentum is amplified
When mean-reverting (H < 0.5): Momentum is reduced
Result: Adaptive signals based on market regime
━━━━━━━━━━━━━━━━━━━━━━━━━━━━━━━━━━━━━━━━
💎 KEY ADVANTAGES
Regime Adaptive: Automatically adjusts to trending vs ranging markets
False Signal Reduction: Reduces momentum signals in mean-reverting markets
Trend Amplification: Stronger signals when trends are persistent
Mathematical Edge: Based on fractal dimension analysis
No Repainting: All calculations on historical data
━━━━━━━━━━━━━━━━━━━━━━━━━━━━━━━━━━━━━━━━
📊 TRADING SIGNALS
Visual Interpretation:
Cyan zones: Bullish momentum in trending market
Magenta zones: Bearish momentum or mean reversion
Background tint: Blue = trending, Pink = mean-reverting
Gradient intensity: Signal strength
Trading Strategies:
1. Trend Following:
Trade momentum signals when background is blue (trending)
2. Mean Reversion:
Fade extreme readings when background is pink
3. Regime Transition:
Watch for background color changes as early warning
━━━━━━━━━━━━━━━━━━━━━━━━━━━━━━━━━━━━━━━━
🎯 OPTIMAL USAGE
Best Conditions:
Strong trending markets (crypto bull runs)
Clear ranging markets (forex sessions)
Regime transitions
Multi-timeframe analysis
Market Applications:
Crypto: Excellent for identifying trend persistence
Forex: Detects when pairs are ranging
Stocks: Identifies momentum stocks
Commodities: Catches persistent trends
━━━━━━━━━━━━━━━━━━━━━━━━━━━━━━━━━━━━━━━━
Developed by AlphaNatt | Fractal Market Analysis
Version: 1.0
Classification: Adaptive Regime Oscillator
Not financial advice. Always DYOR.

Adaptive Convergence Divergence### Adaptive Convergence Divergence (ACD)
By Gurjit Singh
The Adaptive Convergence Divergence (ACD) reimagines the classic MACD by replacing fixed moving averages with adaptive moving averages. Instead of a static smoothing factor, it dynamically adjusts sensitivity based on price momentum, relative strength, volatility, fractal roughness, or volume pressure. This makes the oscillator more responsive in trending markets while filtering noise in choppy ranges.
#### 📌 Key Features
1. Dual Adaptive Structure: The oscillator uses two adaptive moving averages to form its convergence-divergence line, with EMA/RMA as signal line:
* Primary Adaptive (MA): Fast line, reacts quickly to changes.
* Following Adaptive (FAMA): Slow line, with half-alpha smoothing for confirmation.
2. Adaptive MA Types
* ACMO: Adaptive CMO (momentum)
* ARSI: Adaptive RSI (relative strength)
* FRMA: Fractal Roughness (volatility + fractal dimension)
* VOLA: Volume adaptive (volume pressure)
3. PPO Option: Switch between classic MACD or Percentage Price Oscillator (PPO) style calculation.
4. Signal Smoothing: Choose between EMA or Wilder’s RMA.
5. Visuals: Colored oscillator, signal line, histogram with adaptive transparency.
6. Alerts: Bullish/Bearish crossovers built-in.
#### 🔑 How to Use
1. Add to chart: Works on any timeframe and asset.
2. Choose MA Type: Experiment with ACMO, ARSI, FRMA, or VOLA depending on market regime.
3. Crossovers:
* Bullish (🐂): Oscillator crosses above signal → potential long entry.
* Bearish (🐻): Oscillator crosses below signal → potential short entry.
4. Histogram: expansion = strengthening trend; contraction = weakening trend.
5. Divergences:
* Bullish (hidden strength): Price pushes lower, but ACD turns higher = potential upward reversal.
* Bearish (hidden weakness): Price pushes higher, but ACD turns lower = potential downward reversal.
6. Customize: Adjust lengths, smoothing type, and PPO/MACD mode to match your style.
7. Set Alerts:
* Enable Bullish or Bearish crossover alerts to catch momentum shifts in real time.
#### 💡 Tips
* PPO mode normalizes values across assets, useful for cross-asset analysis.
* Wilder’s smoothing is gentler than EMA, reducing whipsaws in sideways conditions.
* Adaptive smoothing helps reduce false divergence signals by filtering noise in choppy ranges.

Up/Down Volume Delta %this script is based on FractalTrade_'s rendition of the up/down volume bars.
the shortcomings of that chart were that large volume bars caused the auto-scaling to shrink smaller volume bar displays to the point where much of the data was too small to see.
in this chart, the bars are displaying the percent delta out of the total bar volume. this way, large overall volume bars do not cause visual compression to everything else in the chart.
I've used color modulation to indicate relation to a relative volume point, so users can still tell when overall volume is large or small. when volume is under a moving average, the bars will display at a basis transparency. when the volume is over the average, the brightness will increase up to a specific ratio of volume defined by the user.
for example, if basis transparency is at 20, and the full opacity ratio is at 3, and the volume average is at 1M, a volume of 750k will display the delta bar at the basis transparency. a volume of 3M will achieve full brightness. a volume of 2M will display with moderate brightness (about 60%), but still stand out against other bars with basis transparency.
areas of the chart that are either increasing bar sizes or increasing in brightness can indicate directional force. when volume delta direction contradicts the candle direction, this can indicate support / resistance.

Multifractal Forecast [ScorsoneEnterprises]Multifractal Forecast Indicator
The Multifractal Forecast is an indicator designed to model and forecast asset price movements using a multifractal framework. It uses concepts from fractal geometry and stochastic processes, specifically the Multifractal Model of Asset Returns (MMAR) and fractional Brownian motion (fBm), to generate price forecasts based on historical price data. The indicator visualizes potential future price paths as colored lines, providing traders with a probabilistic view of price trends over a specified trading time scale. Below is a detailed breakdown of the indicator’s functionality, inputs, calculations, and visualization.
Overview
Purpose: The indicator forecasts future price movements by simulating multiple price paths based on a multifractal model, which accounts for the complex, non-linear behavior of financial markets.
Key Concepts:
Multifractal Model of Asset Returns (MMAR): Models price movements as a multifractal process, capturing varying degrees of volatility and self-similarity across different time scales.
Fractional Brownian Motion (fBm): A generalization of Brownian motion that incorporates long-range dependence and self-similarity, controlled by the Hurst exponent.
Binomial Cascade: Used to model trading time, introducing heterogeneity in time scales to reflect market activity bursts.
Hurst Exponent: Measures the degree of long-term memory in the price series (persistence, randomness, or mean-reversion).
Rescaled Range (R/S) Analysis: Estimates the Hurst exponent to quantify the fractal nature of the price series.
Inputs
The indicator allows users to customize its behavior through several input parameters, each influencing the multifractal model and forecast generation:
Maximum Lag (max_lag):
Type: Integer
Default: 50
Minimum: 5
Purpose: Determines the maximum lag used in the rescaled range (R/S) analysis to calculate the Hurst exponent. A higher lag increases the sample size for Hurst estimation but may smooth out short-term dynamics.
2 to the n values in the Multifractal Model (n):
Type: Integer
Default: 4
Purpose: Defines the resolution of the multifractal model by setting the size of arrays used in calculations (N = 2^n). For example, n=4 results in N=16 data points. Larger n increases computational complexity and detail but may exceed Pine Script’s array size limits (capped at 100,000).
Multiplier for Binomial Cascade (m):
Type: Float
Default: 0.8
Purpose: Controls the asymmetry in the binomial cascade, which models trading time. The multiplier m (and its complement 2.0 - m) determines how mass is distributed across time scales. Values closer to 1 create more balanced cascades, while values further from 1 introduce more variability.
Length Scale for fBm (L):
Type: Float
Default: 100,000.0
Purpose: Scales the fractional Brownian motion output, affecting the amplitude of simulated price paths. Larger values increase the magnitude of forecasted price movements.
Cumulative Sum (cum):
Type: Integer (0 or 1)
Default: 1
Purpose: Toggles whether the fBm output is cumulatively summed (1=On, 0=Off). When enabled, the fBm series is accumulated to simulate a price path with memory, resembling a random walk with long-range dependence.
Trading Time Scale (T):
Type: Integer
Default: 5
Purpose: Defines the forecast horizon in bars (20 bars into the future). It also scales the binomial cascade’s output to align with the desired trading time frame.
Number of Simulations (num_simulations):
Type: Integer
Default: 5
Minimum: 1
Purpose: Specifies how many forecast paths are simulated and plotted. More simulations provide a broader range of possible price outcomes but increase computational load.
Core Calculations
The indicator combines several mathematical and statistical techniques to generate price forecasts. Below is a step-by-step explanation of its calculations:
Log Returns (lgr):
The indicator calculates log returns as math.log(close / close ) when both the current and previous close prices are positive. This measures the relative price change in a logarithmic scale, which is standard for financial time series analysis to stabilize variance.
Hurst Exponent Estimation (get_hurst_exponent):
Purpose: Estimates the Hurst exponent (H) to quantify the degree of long-term memory in the price series.
Method: Uses rescaled range (R/S) analysis:
For each lag from 2 to max_lag, the function calc_rescaled_range computes the rescaled range:
Calculate the mean of the log returns over the lag period.
Compute the cumulative deviation from the mean.
Find the range (max - min) of the cumulative deviation.
Divide the range by the standard deviation of the log returns to get the rescaled range.
The log of the rescaled range (log(R/S)) is regressed against the log of the lag (log(lag)) using the polyfit_slope function.
The slope of this regression is the Hurst exponent (H).
Interpretation:
H = 0.5: Random walk (no memory, like standard Brownian motion).
H > 0.5: Persistent behavior (trends tend to continue).
H < 0.5: Mean-reverting behavior (price tends to revert to the mean).
Fractional Brownian Motion (get_fbm):
Purpose: Generates a fractional Brownian motion series to model price movements with long-range dependence.
Inputs: n (array size 2^n), H (Hurst exponent), L (length scale), cum (cumulative sum toggle).
Method:
Computes covariance for fBm using the formula: 0.5 * (|i+1|^(2H) - 2 * |i|^(2H) + |i-1|^(2H)).
Uses Hosking’s method (referenced from Columbia University’s implementation) to generate fBm:
Initializes arrays for covariance (cov), intermediate calculations (phi, psi), and output.
Iteratively computes the fBm series by incorporating a random term scaled by the variance (v) and covariance structure.
Applies scaling based on L / N^H to adjust the amplitude.
Optionally applies cumulative summation if cum = 1 to produce a path with memory.
Output: An array of 2^n values representing the fBm series.
Binomial Cascade (get_binomial_cascade):
Purpose: Models trading time (theta) to account for non-uniform market activity (e.g., bursts of volatility).
Inputs: n (array size 2^n), m (multiplier), T (trading time scale).
Method:
Initializes an array of size 2^n with values of 1.0.
Iteratively applies a binomial cascade:
For each block (from 0 to n-1), splits the array into segments.
Randomly assigns a multiplier (m or 2.0 - m) to each segment, redistributing mass.
Normalizes the array by dividing by its sum and scales by T.
Checks for array size limits to prevent Pine Script errors.
Output: An array (theta) representing the trading time, which warps the fBm to reflect market activity.
Interpolation (interpolate_fbm):
Purpose: Maps the fBm series to the trading time scale to produce a forecast.
Method:
Computes the cumulative sum of theta and normalizes it to .
Interpolates the fBm series linearly based on the normalized trading time.
Ensures the output aligns with the trading time scale (T).
Output: An array of interpolated fBm values representing log returns over the forecast horizon.
Price Path Generation:
For each simulation (up to num_simulations):
Generates an fBm series using get_fbm.
Interpolates it with the trading time (theta) using interpolate_fbm.
Converts log returns to price levels:
Starts with the current close price.
For each step i in the forecast horizon (T), computes the price as prev_price * exp(log_return).
Output: An array of price levels for each simulation.
Visualization:
Trigger: Updates every T bars when the bar state is confirmed (barstate.isconfirmed).
Process:
Clears previous lines from line_array.
For each simulation, plots a line from the current bar’s close price to the forecasted price at bar_index + T.
Colors the line using a gradient (color.from_gradient) based on the final forecasted price relative to the minimum and maximum forecasted prices across all simulations (red for lower prices, teal for higher prices).
Output: Multiple colored lines on the chart, each representing a possible price path over the next T bars.
How It Works on the Chart
Initialization: On each bar, the indicator calculates the Hurst exponent (H) using historical log returns and prepares the trading time (theta) using the binomial cascade.
Forecast Generation: Every T bars, it generates num_simulations price paths:
Each path starts at the current close price.
Uses fBm to model log returns, warped by the trading time.
Converts log returns to price levels.
Plotting: Draws lines from the current bar to the forecasted price T bars ahead, with colors indicating relative price levels.
Dynamic Updates: The forecast updates every T bars, replacing old lines with new ones based on the latest price data and calculations.
Key Features
Multifractal Modeling: Captures complex market dynamics by combining fBm (long-range dependence) with a binomial cascade (non-uniform time).
Customizable Parameters: Allows users to adjust the forecast horizon, model resolution, scaling, and number of simulations.
Probabilistic Forecast: Multiple simulations provide a range of possible price outcomes, helping traders assess uncertainty.
Visual Clarity: Gradient-colored lines make it easy to distinguish bullish (teal) and bearish (red) forecasts.
Potential Use Cases
Trend Analysis: Identify potential price trends or reversals based on the direction and spread of forecast lines.
Risk Assessment: Evaluate the range of possible price outcomes to gauge market uncertainty.
Volatility Analysis: The Hurst exponent and binomial cascade provide insights into market persistence and volatility clustering.
Limitations
Computational Intensity: Large values of n or num_simulations may slow down execution or hit Pine Script’s array size limits.
Randomness: The binomial cascade and fBm rely on random terms (math.random), which may lead to variability between runs.
Assumptions: The model assumes log-normal price movements and fractal behavior, which may not always hold in extreme market conditions.
Adjusting Inputs:
Set max_lag based on the desired depth of historical analysis.
Adjust n for model resolution (start with 4–6 to avoid performance issues).
Tune m to control trading time variability (0.5–1.5 is typical).
Set L to scale the forecast amplitude (experiment with values like 10,000–1,000,000).
Choose T based on your trading horizon (20 for short-term, 50 for longer-term for example).
Select num_simulations for the number of forecast paths (5–10 is reasonable for visualization).
Interpret Output:
Teal lines suggest bullish scenarios, red lines suggest bearish scenarios.
A wide spread of lines indicates high uncertainty; convergence suggests a stronger trend.
Monitor Updates: Forecasts update every T bars, so check the chart periodically for new projections.
Chart Examples
This is a daily AMEX:SPY chart with default settings. We see the simulations being done every T bars and they provide a range for us to analyze with a few simulations still in the range.
On this intraday PEPPERSTONE:COCOA chart I modified the Length Scale for fBm, L, parameter to be 1000 from 100000. Adjusting the parameter as you switch between timeframes can give you more contextual simulations.
On BITSTAMP:ETHUSD I modified the L to be 1000000 to have a more contextual set of simulations with crypto's volatile nature.
With L at 100000 we see the range for NASDAQ:TLT is correctly simulated. The recent pop stays within the bounds of the highest simulation. Note this is a cherry picked example to show the power and potential of these simulations.
Technical Notes
Error Handling: The script includes checks for array size limits and division by zero (math.abs(denominator) > 1e-10, v := math.max(v, 1e-10)).
External Reference: The fBm implementation is based on Hosking’s method (www.columbia.edu), ensuring a robust algorithm.
Conclusion
The Multifractal Forecast is a powerful tool for traders seeking to model complex market dynamics using a multifractal framework. By combining fBm, binomial cascades, and Hurst exponent analysis, it generates probabilistic price forecasts that account for long-range dependence and non-uniform market activity. Its customizable inputs and clear visualizations make it suitable for both technical analysis and strategy development, though users should be mindful of its computational demands and parameter sensitivity. For optimal use, experiment with input settings and validate forecasts against other technical indicators or market conditions.

Elliott Wave Noise FilterElliott Wave Noise Filter
Overview
The Elliott Wave Noise Filter is a specialized indicator for TradingView, designed to solve one of the biggest challenges in Elliott Wave analysis on lower timeframes: the identification of market noise. By combining multiple advanced filtering techniques, this indicator helps distinguish meaningful price action from random fluctuations.
The Problem
On lower timeframes—especially below 15 minutes—Elliott Wave analysis is significantly impacted by excessive market noise. This noise can lead to misinterpretation of wave structures, making it difficult to execute reliable trading decisions.
The Solution
The Elliott Wave Noise Filter utilizes four powerful methods to detect and filter noise:
ATR-Based Volatility Analysis: Identifies price movements too small to be structurally meaningful
Volume Confirmation: Filters out price moves that occur with insufficient volume
Trend Strength Measurement (ADX): Detects periods of weak trend activity, where noise tends to dominate
Fractal Pattern Recognition: Marks significant turning points that could be relevant for Elliott Wave analysis
Features
Visual Indicators
Background Coloring: Red indicates noise; green signifies a clear signal
Hull Moving Average: Smooths price action and highlights the prevailing trend
Fractal Markers: Triangles mark significant highs and lows
Status Panel: Displays current noise status and ADX value
Customization Options
ATR Period: Adjust the lookback period for ATR calculations
Noise Threshold: Defines the percentage of ATR below which a movement is considered noise
Volume Filter: Can be enabled or disabled
Volume Threshold: Sets the ratio to average volume for a move to be deemed significant
Hull MA Display and Length: Configure the moving average settings
ADX Parameters: Adjust trend strength sensitivity
Use Cases
For Elliott Wave Analysis
Eliminate noise to identify cleaner wave structures
Use fractal markers as potential wave endpoints
Reference the Hull MA for determining the broader trend
For General Trading
Identify high-noise periods to avoid low-quality setups
Spot clearer market phases for better entries
Assess price action quality through visual cues
Multi-Timeframe Approach
Apply the indicator across different timeframes for a comprehensive view
Prefer trading when both higher and lower timeframes align with consistent signals
Optimal Settings
For Very Short Timeframes (1–5 minutes)
Higher Noise Threshold (0.4–0.5)
Longer ATR Period (20–30)
Higher Volume Threshold (1.0–1.2)
For Medium Timeframes (15–60 minutes)
Medium Noise Threshold (0.2–0.3)
Standard ATR Period (14)
Standard Volume Threshold (0.8)
For Higher Timeframes (4h and above)
Lower Noise Threshold (0.1–0.2)
Shorter ATR Period (10)
Lower Volume Threshold (0.6–0.7)
Conclusion
The Elliott Wave Noise Filter is an essential tool for any Elliott Wave analyst or trader working on lower timeframes. By reducing noise and emphasizing significant market movements, it enables more precise analysis and potentially more profitable trading decisions.
Note: As with any technical indicator, the Elliott Wave Noise Filter should be used as part of a broader trading strategy and not as a standalone signal for trade execution.

Institutional Quantum Momentum Impulse [BullByte]## Overview
The Institutional Quantum Momentum Impulse (IQMI) is a sophisticated momentum oscillator designed to detect institutional-level trend strength, volatility conditions, and market regime shifts. It combines multiple advanced technical concepts, including:
- Quantum Momentum Engine (Hilbert Transform + MACD Divergence + Stochastic Energy)
- Fractal Volatility Scoring (GARCH + Keltner-based volatility)
- Dynamic Adaptive Bands (Self-adjusting thresholds based on efficiency)
- Market Phase Detection (Volume + Momentum alignment)
- Liquidity & Cumulative Delta Analysis
The indicator provides a Z-score normalized momentum reading, making it ideal for mean-reversion and trend-following strategies.
---
## Key Features
### 1. Quantum Momentum Core
- Combines Hilbert Transform, MACD divergence, and Stochastic Energy into a single composite momentum score.
- Normalized using a Z-score for statistical significance.
- Smoothed with EMA/WMA/HMA for cleaner signals.
### 2. Dynamic Adaptive Bands
- Upper/Lower bands adjust based on volatility and efficiency ratio .
- Acts as overbought/oversold zones when momentum reaches extremes.
### 3. Market Phase Detection
- Identifies bullish , bearish , or neutral phases using:
- Volume-Weighted MA alignment
- Fractal momentum extremes
### 4. Volatility & Liquidity Filters
- Fractal Volatility Score (0-100 scale) shows market instability.
- Liquidity Check ensures trades are taken in favorable spread conditions.
### 5. Dashboard & Visuals
- Real-time dashboard with key metrics:
- Momentum strength, volatility, efficiency, cumulative delta, and market regime.
- Gradient coloring for intuitive momentum visualization .
---
## Best Trade Setups
### 1. Trend-Following Entries
- Signal :
- QM crosses above zero + Market Phase = Bullish + ADX > 25
- Cumulative Delta rising (buying pressure)
- Confirmation :
- Efficiency > 0.5 (strong momentum quality)
- Liquidity = High (tight spreads)
### 2. Mean-Reversion Entries
- Signal :
- QM touches upper band + Volatility expanding
- Market Regime = Ranging (ADX < 25)
- Confirmation :
- Efficiency < 0.3 (weak momentum follow-through)
- Cumulative Delta divergence (price high but delta declining)
### 3. Breakout Confirmation
- Signal :
- QM holds above zero after a pullback
- Market Phase shifts to Bullish/Bearish
- Confirmation :
- Volatility rising (expansion phase)
- Liquidity remains high
---
## Recommended Timeframes
- Intraday (5M - 1H): Works well for scalping & swing trades.
- Swing Trading (4H - Daily): Best for trend-following setups.
- Position Trading (Weekly+): Useful for macro trend confirmation.
---
## Input Customization
- Resonance Factor (1.0 - 3.618 ): Adjusts MACD divergence sensitivity.
- Entropy Filter (0.382/0.50/0.618) : Controls stochastic damping.
- Smoothing Type (EMA/WMA/HMA) : Changes momentum responsiveness.
- Normalization Period : Adjusts Z-score lookback.
---
The IQMI is a professional-grade momentum indicator that combines institutional-level concepts into a single, easy-to-read oscillator. It works across all markets (stocks, forex, crypto) and is ideal for traders who want:
✅ Early trend detection
✅ Volatility-adjusted signals
✅ Institutional liquidity insights
✅ Clear dashboard for quick analysis
Try it on TradingView and enhance your trading edge! 🚀
Happy Trading!
- BullByte

Volumetric Price Delivery Bias Pro @MaxMaserati🚀 Volumetric Price Delivery Bias Pro MaxMaserati
Description:
The Volumetric Price Delivery Bias Pro is an advanced trading indicator designed to provide clear insights into market trends, reversals, and continuations. Leveraging a combination of price action and volume analysis, it highlights critical support and resistance zones with unparalleled precision. It is a perfect blend of price action and volume intelligence.
🚀 Key Features:
Dynamic Price Analysis:
Detects key price turning points using fractal analysis.
Differentiates between bullish and bearish delivery signals for clear trend direction.
Support & Resistance Visualization:
Defense Lines: Pinpoint levels where buyers or sellers defend positions.
Zone Boxes: Highlight support/resistance areas with adjustable thresholds for precision.
Volume-Driven Confirmation:
Combines volume data to validate price levels.
Visualizes strength through dynamic box size and intensity.
⚡ Signals Explained
CDL (Change of Delivery Long): Indicates a bullish trend reversal.
CDS (Change of Delivery Short): Indicates a bearish trend reversal.
LD (Long Delivery): Confirms bullish trend continuation.
SD (Short Delivery): Confirms bearish trend continuation.
📊 Volume Strength Explained:
Volume strength = Current level volume ÷ (Average volume × Threshold).
Higher strength (above 100%) indicates stronger confirmation of support/resistance.
Boxes and lines dynamically adjust size and color to reflect strength.
🎯 Who Is It For?
This tool is ideal for scalpers, intraday traders, and swing traders who want to align their strategies with real market dynamics.
Scalpers: Identify quick reversals with shorter fractal lengths.
Intraday Traders: Spot balanced trends and continuations.
Swing Traders: Capture major market moves with higher confidence.
What to Do When Volume Strength Is Above 100%
Bullish Scenarios:
High volume at a support zone or during an upward move confirms strong buying interest.
Use it as confirmation for bullish setups.
Bearish Scenarios:
High volume at a resistance zone or during a downward move confirms strong selling pressure.
Use it as confirmation for bearish setups.
Range Markets:
High volume near range edges signals potential reversals or breakouts.
Observe price behavior to identify the likely scenario.
Breakouts:
High volume at key levels confirms the strength of a breakout.
Monitor for continuation in the breakout direction.
General Tip:
Combine high volume signals with other indicators or patterns for stronger confirmation.
🛠️ Customization Options
Configure fractal lengths, volume thresholds, and visual styles for optimal adaptability to scalping, intraday, or swing trading strategies.
Adjustable table display to track delivery bias, counts, and the latest signal.
📢 Alerts and Visuals:
Real-time alerts ensure you never miss critical signals.
Labels and lines mark CDL, CDS, LD, and SD levels for easy chart interpretation.

Adaptive Stochastic Oscillator with Signals [AIBitcoinTrend]👽 Adaptive Stochastic Oscillator with Signals (AIBitcoinTrend)
The Adaptive Stochastic Oscillator with Signals is a refined version of the traditional Stochastic Oscillator, dynamically adjusting its lookback period based on market volatility. This adaptive approach improves responsiveness to market conditions, reducing lag while maintaining trend sensitivity. Additionally, the indicator includes real-time divergence detection and an ATR-based trailing stop system, allowing traders to manage risk and optimize trade exits effectively.
👽 What Makes the Adaptive Stochastic Oscillator Unique?
Unlike the standard Stochastic Oscillator, which uses a fixed lookback period, this version dynamically adjusts the period length using an ATR-based fractal dimension. This makes it more responsive to market conditions, filtering out noise while capturing key price movements.
Key Features:
Adaptive Lookback Calculation – Stochastic period changes dynamically based on volatility.
Real-Time Divergence Detection – Identify bullish and bearish divergences instantly.
Implement Crossover/Crossunder signals tied to ATR-based trailing stops for risk management
👽 The Math Behind the Indicator
👾 Adaptive Lookback Period Calculation
Traditional Stochastic Oscillators use a fixed-length period for their calculations, which can lead to inaccurate signals in varying market conditions. This version automatically adjusts its lookback period based on market volatility using an ATR-based fractal dimension approach.
How it Works:
The fractal dimension (FD) is calculated using the ATR (Average True Range) over a defined period.
FD values dynamically adjust the Stochastic lookback period between a minimum and maximum range.
This results in a faster response in high-volatility conditions and smoother signals during low volatility.
👽 How Traders Can Use This Indicator
👾 Divergence Trading Strategy
Traders can anticipate trend reversals before they occur using real-time divergence detection.
Bullish Divergence Setup:
Identify price making a lower low while Stochastic %K makes a higher low.
Enter a long trade when Stochastic confirms upward momentum.
Bearish Divergence Setup:
Identify price making a higher high while Stochastic %K makes a lower high.
Enter a short trade when Stochastic confirms downward momentum.
👾 Trailing Stop & Signal-Based Trading
Bullish Setup:
✅Stochastic %K crosses above 90 → Buy signal.
✅A bullish trailing stop is placed at low - ATR × Multiplier.
✅Exit if the price crosses below the stop.
Bearish Setup:
✅Stochastic %K crosses below 10 → Sell signal.
✅A bearish trailing stop is placed at high + ATR × Multiplier.
✅Exit if the price crosses above the stop.
👽 Why It’s Useful for Traders
Adaptive Period Calculation: Dynamically adjusts to market volatility.
Real-Time Divergence Alerts: Helps traders identify trend reversals in advance.
ATR-Based Risk Management: Automatically adjusts stop levels based on price movements.
Works Across Multiple Markets & Timeframes: Useful for stocks, forex, crypto, and futures trading.
👽 Indicator Settings
Min & Max Lookback Periods – Define the range for the adaptive Stochastic period.
Enable Divergence Analysis – Toggle real-time divergence detection.
Lookback Period – Set the number of bars for detecting pivot points.
Enable Trailing Stop – Activate the dynamic trailing stop feature.
ATR Multiplier – Adjust stop-loss sensitivity.
Line Width & Colors – Customize stop-loss visualization.
Disclaimer: This indicator is designed for educational purposes and does not constitute financial advice. Please consult a qualified financial advisor before making investment decisions.

HTF Market Structure [TakingProphets]HTF Market Structure
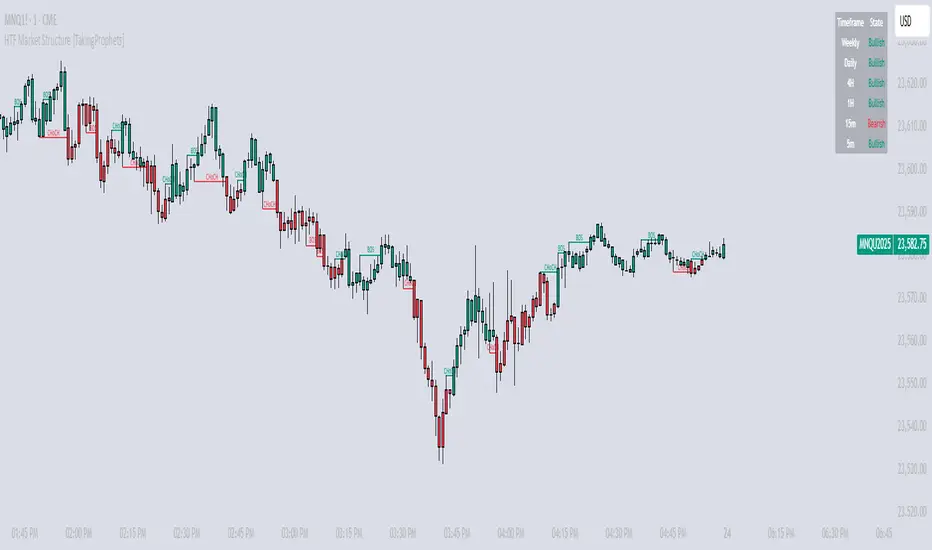
The Market Structure CHoCH/BOS (Fractal) Indicator is designed for traders using smart money concepts and ICT (Inner Circle Trader) methodology to track market structure shifts in real time. It automatically detects Change of Character (CHoCH) and Break of Structure (BOS) events based on fractal highs and lows, helping traders identify potential trend reversals and continuations with greater precision.
🔹 Key Features:
✅ Automatic CHoCH & BOS Detection – No need for manual plotting; the indicator highlights key structure shifts.
✅ Custom Lookback Period – Adjustable fractal settings to fine-tune market structure sensitivity.
✅ Multi-Timeframe Market Structure Table – Displays the most recent CHoCH state on multiple timeframes (Weekly, Daily, 4H, 1H, 15m, 5m).
✅ Candle Coloring – Optional feature to change candle colors after a CHoCH for better visual clarity.
✅ Works Across All Markets – Use it for Forex, Stocks, Crypto, and Futures.
🔹 How It Works:
📌 Break of Structure (BOS) – Indicates a continuation of the existing trend when price breaks a previous swing high or low.
📌 Change of Character (CHoCH) – Suggests a potential trend reversal when price structure shifts direction.
📌 Multi-Timeframe Confirmation – The built-in table tracks the latest CHoCH across different timeframes to help confirm bias.
🔹 How to Use:
Look for CHoCH signals at key liquidity zones (order blocks, fair value gaps).
Use BOS confirmations to follow trend continuations.
Combine with other smart money concepts like imbalance fills and liquidity grabs for stronger trade setups.
🚀 Enhance your market structure analysis with the CHoCH/BOS Indicator
Volumetric Price Delivery Bias Pro @MaxMaserati🚀 Volumetric Price Delivery Bias Pro @MaxMaserati
Description:
The Volumetric Price Delivery Bias Pro is an advanced trading indicator designed to provide clear insights into market trends, reversals, and continuations. Leveraging a combination of price action and volume analysis, it highlights critical support and resistance zones with unparalleled precision. It is a perfect blend of price action and volume intelligence.
🚀 Key Features:
Dynamic Price Analysis:
Detects key price turning points using fractal analysis.
Differentiates between bullish and bearish delivery signals for clear trend direction.
Support & Resistance Visualization:
Defense Lines: Pinpoint levels where buyers or sellers defend positions.
Zone Boxes: Highlight support/resistance areas with adjustable thresholds for precision.
Volume-Driven Confirmation:
Combines volume data to validate price levels.
Visualizes strength through dynamic box size and intensity.
⚡ Signals Explained
CDL (Change of Delivery Long): Indicates a bullish trend reversal.
CDS (Change of Delivery Short): Indicates a bearish trend reversal.
LD (Long Delivery): Confirms bullish trend continuation.
SD (Short Delivery): Confirms bearish trend continuation.
📊 Volume Strength Explained:
Volume strength = Current level volume ÷ (Average volume × Threshold).
Higher strength (above 100%) indicates stronger confirmation of support/resistance.
Boxes and lines dynamically adjust size and color to reflect strength.
🎯 Who Is It For?
This tool is ideal for scalpers, intraday traders, and swing traders who want to align their strategies with real market dynamics.
Scalpers: Identify quick reversals with shorter fractal lengths.
Intraday Traders: Spot balanced trends and continuations.
Swing Traders: Capture major market moves with higher confidence.
What to Do When Volume Strength Is Above 100%
Bullish Scenarios:
High volume at a support zone or during an upward move confirms strong buying interest.
Use it as confirmation for bullish setups.
Bearish Scenarios:
High volume at a resistance zone or during a downward move confirms strong selling pressure.
Use it as confirmation for bearish setups.
Range Markets:
High volume near range edges signals potential reversals or breakouts.
Observe price behavior to identify the likely scenario.
Breakouts:
High volume at key levels confirms the strength of a breakout.
Monitor for continuation in the breakout direction.
General Tip:
Combine high volume signals with other indicators or patterns for stronger confirmation.
🛠️ Customization Options
Configure fractal lengths, volume thresholds, and visual styles for optimal adaptability to scalping, intraday, or swing trading strategies.
Adjustable table display to track delivery bias, counts, and the latest signal.
📢 Alerts and Visuals:
Real-time alerts ensure you never miss critical signals.
Labels and lines mark CDL, CDS, LD, and SD levels for easy chart interpretation.
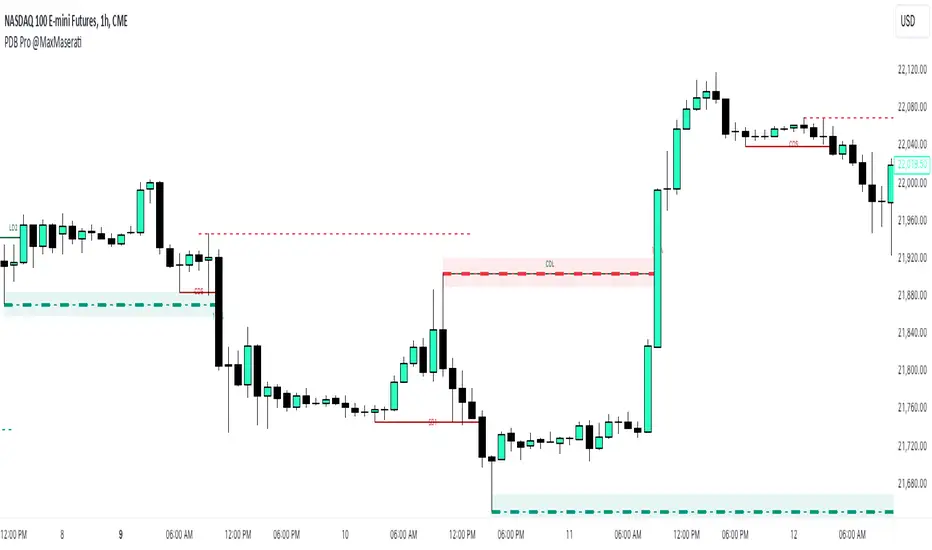
FU Candle Indicator V3.2What the FU Candle Indicator does:
First we need to understand what FU candles are. There's bullish and bearish FU candles.
Bullish FU candles are candles that have a long wick that takes out the previous candles low, then turns around and closes above the high of the previous candle.
Bearish FU candles are candles that have a long wick that takes out the previous candles high, then turns around and closes below the low of the previous candle.
Then there's so called attempted FU candles (ATT FU)
The difference between normal FU candles and ATT FU candles is, that the ATT FU candle doesn't close above/below the high/low of the previous candle but only above the previous candle's body close.
Bullish ATT FU Candle:
Bearish ATT FU Candle:
Detection of Bullish FU Candles:
Bullish FU Candles are detected by measuring the distance between the low of the previous candle and the low of the current candle.
Then the distance between the previous candles high and the current candles close price are measured.
If current candle low < previous candle low and current candle close > previous candle high = Bullish FU Candle.
Detection of Bullish ATT FU Candles:
Bullish ATT FU Candles are detected by measuring the distance between the low of the previous candle and the low of the current candle.
Then the distance between the previous candles close or open price and the current candles close price are measured. If the previous candle closed bearish, the open price is used for comparison, if the previous candle closed bullish, the close price is used for comparison.
If current candle low < previous candle low and current candle close > previous candle open or close = Bullish ATT FU Candle.
Detection of Bearish FU Candles:
Bearish FU Candles are detected by measuring the distance between the high of the previous candle and the high of the current candle.
Then the distance between the previous candles low, AND the current candles close price are measured.
If current candle high > previous candle high, AND current candle close < previous candle low = Bearish FU Candle.
Detection of Bearish ATT FU Candles:
Bearish ATT FU Candles are detected by measuring the distance between the high of the previous candle and the high of the current candle.
Then the distance between the previous candles close or open price and the current candles close price are measured. If the previous candle closed bearish, the open price is used for comparison, if the previous candle closed bullish, the close price is used for comparison.
If current candle high > previous candle high and current candle close < previous candle open or close = Bearish ATT FU Candle.
What makes this script unique?
It shows and liquidity grab and a break of structure on a lower timeframe in one candle.
It allows to adjust the settings for the asset and timeframe you're using
The built in filters (Fractal Filter and EMA Filter) are both optional but allow to filter out certain candles and most importantly it leaves room for experimentation and optimisation to your trading style.
Input Settings and how to use them:
Bullish FU Candle Color --> This setting is to set the color for bullish FU candles.
Bearish FU Candle Color --> This setting is to set the color for bearish FU candles.
Chart --> This setting enables you to display FU's on different timeframes instead of only the current time. It's set to current timeframe by default.
Liq. Grab in Points --> This is the strength of the liquidity grab. By how many points has the current candle taken out the low/ high of the previous candle. It's set to 20 by default but it has to be adjusted to the timeframe and asset you're using.
Engulfing in Points --> This the strength of the engulfing of the previous candle. It measures the distance of the current close price to the open, close, high or low of the previous candle. It depends if the current candle is bullish or bearish and if the previous candle was bullish or bearish and if ATT FUs are enabled but this setting applies to all methods. It's set to 20 by default but you have to adjust it to the asset and timeframe you're using.
Min. Size in Points --> This setting is to filter out tiny candles. It measures the overall size of the FU candle from low to high. It's set to 20 by default but you have to adjust it to the asset and timeframe you are using.
Min. Body Size in Points --> This setting is to filter out FU candles that have a tiny body. It measures the size of the body from open to close. It's set to 20 by default but you have to adjust it to the asset and timeframe you are using.
Max. Body Size in Points --> This setting is to filter out FU candles that have a huge body. It measures the size of the body from open to close. It's set to 10000 by default but you have to adjust it to the asset and timeframe you are using.
Show ATT FU Candles --> ATT FU Candles are FU's where the body only engulfs the previous candles body but not the wick. This type of FU candles is just as valid as the strong FU's where the Body and the wick of the previous Candle is engulfed. The setting is enabled by default.
Rejection Filter --> This setting is used filter out FU candles where the opposite side rejection is stronger than the body direction of the FU. This filters out a lot of traps. It's disabled by default.
Fractal Filter --> FU's are only valid if they broke a fractal of the past x candles. This filters out some of the FU candles that are inside a range and therefore invalid. This is an optional filter and disabled by default.
EMA Filter --> FU's are only if they are above/ below the EMA. This is to filter out most of the FU candles that are inside ranges. The EMA period can be set too. This is an optional filter and enabled and EMA length set to 7 by default. You can enable it and/ or change the length of the EMA to fit your trading style.
Show Entry Lines --> The entry line setting has been changed in terms of styling. The upper and lower line has been removed. Now only the 50% retracement line of the candle body is displayed and the line type, color, strength and length can be set to keep charts as clean as possible.
Alert Timeframes --> You can select the timeframes for which you want to receive an alert if you set and alert for the FU Candle indicator. If you set an alert for the FU Candle Indicator it will send an alert for every FU candle on every selected timeframe.
TF1-TF8 --> This setting is to enable or disable alerts for timeframe 1 - timeframe 8. By default all alerts are disabled, I recommend only enabling the ones that you actually use.
Recommended use:
A bullish FU candle doesn't necessarily mean it's a long and vice versa a bearish FU candle doesn't necessarily mean it's a short. In fact, most FU candles are traps. Often times you'll see a bullish FU candle starting a bearish reversal.
Whenever you see an FU Candle check the following:
Did the FU candle take relevant liquidity?
Is the FU Candle in line with the overall bias or does it go against the bias?
Where did the FU react? Example: A bearish FU candle that reacts in a bullish FVG is a perfect long entry and vice versa.
A bullish FU candle that takes out a relevant swing high can often be a fake-out and price can immediately reverse as the next candle opens.
Timing is also very important. Usually the valid FU candles happen after a strong move to one direction during high volume times and right before or right after a new candle opens on a higher timeframe.
Examples of valid setups:
Nr. 1) Mitigation Setup
Overall bullish on the higher time frame, liquidity grab to the downside, shift in momentum, strong move to the upside left a FVG. later price comes back into the FVG and forms a FU candle --> perfect long trade targeting the opposite side of the range.
Entry either at close of the FU or at the 50% retracement.
Nr. 2) Trap Setup
Clear bullish trend respecting the trend line, bearish FU candle forms but it didn't take any relevant liquidity to the upside. Only internal range liquidity. Perfect long entry using a buy limit below the lower wick of the FU candle with the SL below the nearest low.
Nr. 3) Liquidity Grab Setup
Bearish trend, price comes up aggressively and takes out a high and forms an FU Candle. Market entry short at close of the FU candle or at the 50% retracement of the FU candle or by putting a limit order right above the wick of the candle that follows the FU candle, targeting the opposite side of the range.
Nr. 4) Fake Breakout Setup
Price takes out a significant HTF low, then makes at least 2 BOS on the LTF and forms an Order Block or leaves an FVG. Price forms a bearish U that fails to close below the FVG or Orderblock.
Market entry long at the close of the bearish FU targeting the opposite side of the range. Vice versa for shorts. In simple terms: Bullish FUs at the top of the range and bearish FUs at the bottom of the range are usually always traps.
Sometimes price takes out the high/low of a trap FU before reversing aggressively so you can also have a limit order below the low of the bearish FU or above the high of a bullish FU in this case. But you risk missing the trade.
Entry Methods:
Entry Type 1) Market Entry at the close of the FU candle. --> Never miss a trade, not the best RRR.
Entry Type 2 Limit Entry at the 50% retracement of the body of the FU candle. --> Miss some of the trades but better RRR.
Entry Type 3 Limit order below the wick of the candle that follows the FU candle. --> Miss quite a lot of trades but by far best RRR.
Why this is a closed source script:
The source code of this script is not open because I have spent several years of my life developing it and I use it in all my trading bots.
Also I'm open for feedback and will modify/ update the script for free if I get input that can make it better.
For questions, please reach out via DM or check out my youtube channel. I have several videos explaining in detail how I use these candles, which are valid and which aren't.

FRAMA Channel [BigBeluga]This is a trend-following indicator that utilizes the Fractal Adaptive Moving Average (FRAMA) to create a dynamic channel around the price. The FRAMA Channel helps identify uptrends, downtrends, and ranging markets by examining the relationship between the price and the channel's boundaries. It also marks trend changes with arrows, optionally displaying either price values or average volume at these key points.
🔵 IDEA
The core idea behind the FRAMA Channel indicator is to use the fractal nature of markets to adapt to different market conditions. By creating a channel around the FRAMA line, it not only tracks price trends but also adapts its sensitivity based on market volatility. When the price crosses the upper or lower bands of the channel, it signals a potential shift in trend direction. If the price remains within the channel and crosses over the upper or lower bands without a breakout, the market is likely in a ranging phase with low momentum. This adaptive approach makes the FRAMA Channel effective in both trending and ranging market environments.
🔵 KEY FEATURES & USAGE
◉ Dynamic FRAMA Channel with Trend Signals:
The FRAMA Channel uses a fractal-based moving average to create an adaptive channel around the price. When the price crosses above the upper band, it signals an uptrend and plots an upward arrow with the price (or average volume) value. Conversely, when the price crosses below the lower band, it signals a downtrend and marks the point with a downward arrow. This dynamic adaptation to market conditions helps traders identify key trend shifts effectively.
◉ Ranging Market Detection:
If the price remains within the channel, and only the high crosses the upper band or the low crosses the lower band, the indicator identifies a ranging market with low momentum. In this case, the channel turns gray, signaling a neutral trend. This is particularly useful for avoiding false signals during periods of market consolidation.
◉ Color-Coded Candles and Channel Bands:
Candles and channel bands are color-coded to reflect the current trend direction. Green indicates an upward trend, blue shows a downward trend, and gray signals a neutral or ranging market. This visual representation makes it easy to identify the market condition at a glance, helping traders make informed decisions quickly.
◉ Customizable Display of Price or Average Volume:
On trend change signals, the indicator allows users to choose whether to display the price at the point of trend change or the average volume of 10 bars. This flexibility enables traders to focus on the information that is most relevant to their strategy, whether it's the exact price entery or the volume context of the market shift. Displaying the average volume allows to see the strength of the trend change.
Price Data:
Average Volume of points:
🔵 CUSTOMIZATION
Length & Bands Distance: Adjust the length for the FRAMA calculation to control the sensitivity of the channel. A shorter length makes the channel more reactive to price changes, while a longer length smooths it out. The Bands Distance setting determines how far the bands are from the FRAMA line, helping to define the breakout and ranging conditions.
Signals Data: Choose between displaying the price or the average volume on trend change arrows. This allows traders to focus on either the exact price level of trend change or the market volume context.
Color Settings: Customize the colors for upward momentum, downward momentum, and neutral states to suit your charting preferences. You can also toggle whether to color the candles based on the momentum for a clearer visual of the trend direction.
The FRAMA Channel indicator adapts to market conditions, providing a versatile tool for identifying trends and ranging markets with clear visual cues.

(Envelopes)USS Enterprise1. This indicator is created for those who still believe in the functionality of moving averages. Indicator consists of several envelopes of moving averages and two separate averages. The selection of these moving averages is linked to Fibonacci theories and calculations.
2. The indicator shows moving averages (envelopes) of all market participants. From the smallest to the giants.
3. It should be noted that all averages are mainly calibrated to a 15-minute time frame. But I'm not saying that you can't use it on any TF. Because market is fractal.
Groups:
1. (YELLOW ENVELOPES) The first group are scalpers and big traders. Yellow envelope! This is the largest group of traders, but with the smallest capital on the market. Why did I choose this envelope? To show who is in control of the market. The average duration of holding the price of this envelope is 12-16 hours (in trend phase) and therefore it is suitable for intra-day trading. If the price closes below this envelope, we know that their strength was no longer sufficient. However, as long as these two yellow curves do not cross each other, we consider this group of traders to be still dominant/active and their weakening was only partial, for example, due to a pullback, or due to manipulation of the price of stronger players.
2. (LIGHT BLUE ENVELOPE) When I mentioned pullback. Understand it as the return of the price in the trend. But who is capable of these pullbacks in the trend? Our second group of traders. Institutions. (Light blue color). Only their amount of money can cause the price to return to their point of interest and that is the light blue envelope. The average ability to hold the trend of the institutions is something around 1-2 days. If the price closes with a slow decline/rise below this/above this envelope, we can expect that their strength is still large enough. However, if there are movements that seem to cut through this envelope, it is the first indication that the institutions are losing strength. If there is a crossover of any yellow average across both institutional ones, we can expect a much bigger pullback in the trend. This pullback is then again mainly under the control of the institutions (rejections from the light blue envelope.) But where can this pullback go? Another market participant will tell us that!
3. (DARK BLUE ENVELOPE) Market makers are another participant. Their task is to maintain balance on the market. This means that the market does not only go up or only down. That's what the envelope of market makers is for. This envelope is considered a trend defender. What makes it special. It can hold a trend even for days. We can consider the return to this envelope as a supply and demand strategy. In the trend, the price will come back here as a pullback and then rocket back into the original trend. I'll tell you what you probably guessed, yes, we are moving here at the EMA200 level. So if the institutional (light blue) traders lose their strength, believe me that the envelope of the market makers is a very likely stop! When does a trend change occur and not a pullback? If there is a crossing of the light blue average with the entire envelope of market makers. The next test from the other side of this envelope confirms the trend change.
4. Let's skip the black envelope for the moment.
5. (PURPLE ENVELOPE) Let's explain the purple envelope. It is the envelope of market makers and especially hedge funds. What do you think when the price closes below the EMA200 (originally a bull trend) and even tests it below? "We have a trend change now we definitely have a down trend!!!" Uhm. NOPE :D. That's their job. To show you what they want you to believe. What does this result in? Filling their large orders, which eventually means that you were caught and liquidated with your positions. By testing, you will find out how many times you thought there was a trend change, but after you see how the price reacts from the purple envelope, you will understand that until now you did not know at all when a general trend change occurs. When we talk about a trend change in the long term , occurs when the EMA200 (dark blue envelope) crosses this purple envelope. This purple envelope is able to keep the price trending for an average of 3 weeks.
Don't get caught that the trend change is when the price closes below the EMA200.Or "golden cross"
6. (BLACK ENVELOPE) Did we miss something though? So let's go back to the meaning of the black envelope. When you take a good look at the trend and notice all the envelopes lined up nicely and focus on the dark blue envelope and the purple envelope. Don't you feel like you're seeing Fibonacci's return? Or as if you see the price in the premium zone?.78%-88%. Yes, it's exactly this envelope. Sometimes market makers and funds are satisfied with the price in this envelope and are willing to continue buying or selling from this envelope. However, keep in mind, this can be a stop before testing the purple envelope - mostly the range is formed in this black envelope. Expect in such a case that they will test the purple envelope. Otherwise, take this envelope as a sign of a premium zone.
7. (ORANGE,TEAL and RED MA) The Orange,Teal and Red averages show a pure bank level. That is, our mentioned giants on the market. You will see for yourself on the market with what accuracy the banks return to these averages. You will see for yourself that trends really change only at these averages. You must have told yourself several times why and how patterns that resemble a letter are created in the market V or the letter A. Congratulations! Thanks to my indicator, you already know today! Because of these bank averages!!!
I wish you the best of luck with this indicator and hopefully it helps as many people as possible understand trends and how important simple lines can be! Which and how many envelopes or moving averages you will use is entirely up to you!
Warning: Everything published in this description or the functionality of this indicator serves only as educational content! Only YOU are responsible for all profits and losses!

Sweep institutionalThis indicator focuses on identifying "SWEEPs" based on taking liquidity at highs and lows. The application of the SWEEP strategy is highly determinant in the Swing points, as they serve as the target of our operations.
ALERTS INCLUDED
🔹Example of Strategy Application
1.-Create the BULLISH SWEEP.
2.-You can enter LONG.
3.-If it is a BULLISH SWEEP, take a long with a SWING HIGH target (2-3 pips up).
4.-If it is a BULLISH SWEEP, place your SL behind the SWEEP (2-3 pips).
(This example is bullish, but it would be the same in a bearish setup, applying everything in the opposite way)
t's very crucial for the strategy to reference SWING POINTS, as these points will be our take profit and stop loss points.
The strategy is based on identifying a SWEEP. After this, we can look for trading opportunities with targets on the opposite side of the fractal. Remember, if you decide to enter, the Stop Loss should be placed protected by the Sweep, and the Take Profit should be set at the opposite Swing, as seen in the example.
Use this STRATEGY IN TIMEFRAMES GREATER THAN 30M. If you decide to use it in timeframes <30M, there's a higher probability of encountering false SWEEPs (the most optimal are 1h & 4h)
🔹Use
The Sweep strategy involves identifying potential trades based on the creation of a "SWEEP" (liquidity grab) at the Swing High or Swing Low. Below is an example of a bearish opportunity after taking liquidity from a Swing High with a wick and no candle body closing above it.
🔹Details
As you have seen, it indicates the surpassing of a high without the candle body, this is called a “SWEEP.” Each time this occurs, the price is likely to surpass the opposite SWING High/Low. The following example will show more clearly how it works in both bullish and bearish scenarios.
🔹Configuration
-Cooldown period: is the length of the operating Range line
-Swing detection: determines the points to be used as SL and TP protection
Bullish/Berish Sweep
-Line Width: size of the line
-Line Style: design type
-Color
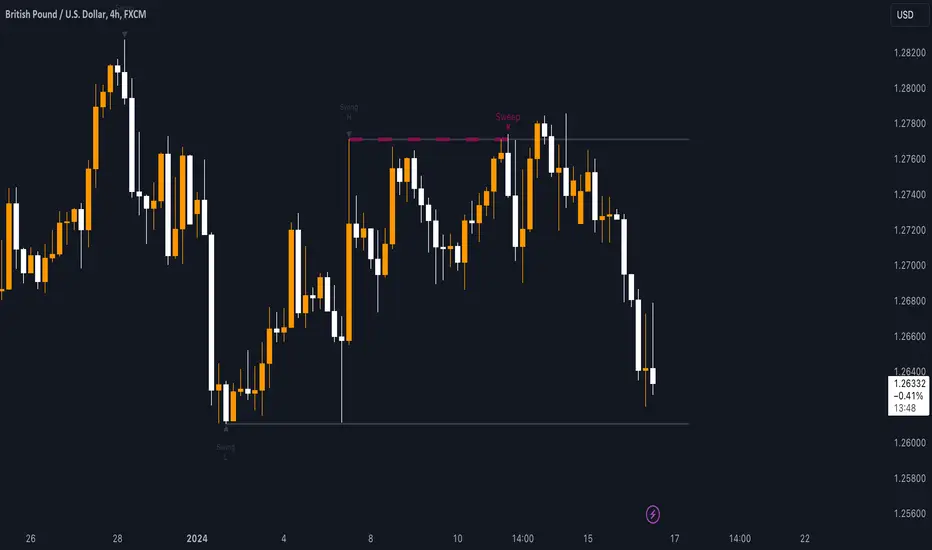
MTF Market Structure - SMC IndicatorsThe Multi Timeframe Market Structure helps understand and identify bullish or bearish Market Structure by highlighting “KEY” Highs and Lows. It also identifies changes in market direction by identifying a “Shift in Market Structure” (See Point 2 below) or “Break in Market Structure” (See Point 3 Below).
What are Key Highs and Lows?
Not every high or low is a “Key” high or low. “Key” highs and lows are specific highs and lows that form the structure of the market and have significance in understanding the current trend in the market (see point 1 below).
The indicator identifies these “Key” highs and lows on multiple time frames, allowing the trader to keep a perspective of the Market Structure with multiple timeframes simultaneously (see point 5 below).
The key highs and lows identified by the indicator are as follows:
Key Lows : Identify significant Swing Lows, Short-term lows “STL”, Intermediate-Term Lows “ITL”, and Long-Term Lows “LTL”.
Key Highs : Identify significant Swing Highs, Short-term highs “STH”, Intermediate-Term Highs “ITH”, and Long-Term Highs “LTH”.
Significant Swing High : This is a price swing with one lower candle to the right and one lower candle to the left of it.
Significant Swing Low : This is a price swing with one higher candle to the right and one higher candle to the left of it.
Short-Term High “STH” is a price swing with one lower Significant Swing High to the right and one lower Significant Swing High to the left of it.
Short-Term Low “STL” is a price swing with one higher Significant Swing Low to the right and one higher Significant Swing Low to the left of it.
Intermediate-Term High “ITH” is a price swing with one lower STH to the right and one lower STH to the left of it.
Intermediate-Term Low “ITL” is a price swing with one higher STL to the right and one higher STL to the left of it.
Long-Term High “LTH” is a price swing with one lower ITH to the right and one lower ITH to the left of it.
Long-Term Low “ITL” is a price swing with one higher ITL to the right and one higher ITL to the left of it.
By identifying key highs and lows using the Market Structure Indicator, it can be used in multiple ways by using those reference points as follows:
1. Identifying Market Trends by Connecting Key Highs and Lows.
Bullish trend identification is when the indicator is making higher ITLs and ITHs.
Bearish Trend identification when the indicator is making lower ITLs and ITHs.
PS: it’s essential to understand the underlying market trend on multiple timeframes to use the next features correctly. Always use the Shifts and Breaks in Market Structures in line with the 1H or higher timeframes Market Trend for higher probability trade opportunities. This is because, generally, higher timeframes have more importance than lower timeframes.
2. Shift In Market Structure - SMS for Entries
A Shift in Market Structure “SMS” identifies potential reversal in short-term market trend relative to the timeframe where the SMS is identified.
This occurs after a run of any Significant Swing High or Low and then reversing, creating a Fair Value Gap “FVG”.
There can be Bullish and Bearish Market Structure Shifts.
When a Bullish Shift in Market Structure occurs, the indicator identifies an opportunity for the price to change from Bearish to Bullish, as seen in the image below.
When a Bearish Shift in Market Structure occurs, the indicator identifies an opportunity for the price to change from Bullish to Bearish.
3. Break In Market Structure - BMS for Entries
A Break in Market Structure “BMS” has a similar function to the Shift in Market Structure “SMS”; however, when it occurs, it identifies a potential longer-term trend reversal (compared to the SMS) relative to the timeframe where the BMS is identified.
Unlike “SMS”, the BMS occurs after a run only after a run on Key Highs or Lows.
Similar to the SMS, there can be Bullish and Bearish Breaks in Market Structure.
When a Bullish Break in Market Structure occurs, the indicator identifies an opportunity for a longer-term trend change from Bearish to Bullish, as seen in the image below.
The FVG must occur in the lower 50% of the impulse price leg (at Discount).
When a Bearish Break in Market Structure occurs, the indicator identifies an opportunity for a longer-term trend change from Bullish to Bearish.
The FVG must occur in the upper 50% of the impulse price leg (at Premium).
4. Inversion Break and Shift in Market Structure for Early Entries
Inversion “BMS” and “SMS” are similar to the normal SMS and BMS, but they occur:
Bullish: When the FVG of the Bearish BMS/SMS forms in the lower 50% of the impulse price leg (at Discount).
We use the FVG that forms from the Bearish SMS/BMS as an inversion FVG for potential entry after market trend change from Bearish to Bullish.
Bearish: When the FVG of the Bullish BMS/SMS forms in the upper 50% of the impulse price leg (at Premium).
We use the FVG that forms from the Bullish SMS/BMS as an inversion FVG for potential entry after market trend change from Bullish to Bearish.
5. Multi Time Frame analysis
The indicator allows multiple timeframe perspectives to be considered when using it.
The key Highs and Lows have significance not only on the current timeframe they are identified but also on lower or higher timeframes simultaneously.
This is because a ITL/ITH on the 1H means
It’s a LTL/LTH on one or more timeframes lower (15Min, 5M, and 1Min).
And at the same time, it’s a STL/STH on one timeframe higher (4H)
Also, it’s a Significant Low/High (marked with a dot) on two timeframes higher (Daily).
The same logic applies to all other Key Highs and Lows.
Another example is a Significant Low/High (swing marked with a dot below or above it) on the current timeframe (1D) means it’s a STL/STH on one timeframe lower (4H) and an ITL/ITH on two timeframes lower (1H) and a LTH/LTH on three timeframes lower or more (15M, 5M, 1Min, 30 Seconds, etc…).
This Multi-time frame analysis is a great way to help traders understand Market Structure and Market trend on multiple timeframes simultaneously, and it also assists in Top-down analysis.
PS: Note that this multi-timeframe analysis approach and logic can be applied to any timeframe and for any type of trading (swing trading, day trading, scalping, or short-term trading) because the price is fractal.
For example, if a trader is a swing trader, then it’s best to identify trader opportunities on the 1H or higher; however, lower timeframes Market Structure can still be used to help the traders refine their entries and target key highs and lows in the opposite direction.
If a trader is a day trader or a scalper, the trader could use Market Structure on 15M or lower to identify trader opportunities and target key highs and lows in the opposite direction.
6. Setting Targets
The indicator can also be used to identify potential targets after the SMS or BMS occurs. Targets can be chosen above Key Highs or Lows depending on the trade objective and timeframe where the trade idea is identified.
Bonus Features
Highlight Market Structure Trend
This feature is an excellent backtesting visual tool to look at changes in market trends highlighted in colours. These changes are based on the Shift or Break in of Market Structure depending on the selection option.
When "Shift/Break" in Market Structure" is selected, a Bullish trend is highlighted in blue when a Bullish Shift/Break in Market Structure Occurs and in Red when a Bearish Shift/Break in Market Structure Occurs.
Notifications
Sends notifications when there is a Shift or Break in Market Structure on the current timeframe of choice.

Market Profile @joshuuuTime is fractal. Every candle has an open, low, high and closing price.
Depending on what timeframe you are on, some opening prices could be more interesting than others.
This indicator tracks, which timeframe you are currently on and displays different things accordingly, so that the chart is never messy.
Below the hourly timeframe, the indicator highlights ICT Killzones, times of the day where most volume occurs and price moves the "cleanest". There are different versions to display those sessions in the settings.
From the hourly timeframe up to the daily timeframe, the indicator shows the "Weekly Profile". It plots the weekly opening line, can highlight daily highs and lows and daily opens and shows the name of the days on the chart.
On the daily timeframe, the indicator switches to a monthly profile. It shows the monthly open, weekly highs/lows AND it shows another concept taught by ICT, the IPDA Lookback.
ICT teaches that especially the last 20, 40 and 60 days PD Arrays and Highs/Lows are important and this indicator highlights those lookback windows accordingly.
The indicator has a lot of settings to make it allow maximum individuality.

AI-Bank-Nifty Tech AnalysisThis code is a TradingView indicator that analyzes the Bank Nifty index of the Indian stock market. It uses various inputs to customize the indicator's appearance and analysis, such as enabling analysis based on the chart's timeframe, detecting bullish and bearish engulfing candles, and setting the table position and style.
The code imports an external script called BankNifty_CSM, which likely contains functions that calculate technical indicators such as the RSI, MACD, VWAP, and more. The code then defines several table cell colors and other styling parameters.
Next, the code defines a table to display the technical analysis of eight bank stocks in the Bank Nifty index. It then defines a function called get_BankComponent_Details that takes a stock symbol as input, requests the stock's OHLCV data, and calculates several technical indicators using the imported CSM_BankNifty functions.
The code also defines two functions called get_EngulfingBullish_Detection and get_EngulfingBearish_Detection to detect bullish and bearish engulfing candles.
Finally, the code calculates the technical analysis for each bank stock using the get_BankComponent_Details function and displays the results in the table. If the engulfing input is enabled, the code also checks for bullish and bearish engulfing candles and displays buy/sell signals accordingly.
The FRAMA stands for "Fractal Adaptive Moving Average," which is a type of moving average that adjusts its smoothing factor based on the fractal dimension of the price data. The fractal dimension reflects self-similarity at different scales. The FRAMA uses this property to adapt to the scale of price movements, capturing short-term and long-term trends while minimizing lag. The FRAMA was developed by John F. Ehlers and is commonly used by traders and analysts in technical analysis to identify trends and generate buy and sell signals. I tried to create this indicator in Pine.
In this context, "RS" stands for "Relative Strength," which is a technical indicator that compares the performance of a particular stock or market sector against a benchmark index.
The "Alligator" is a technical analysis tool that consists of three smoothed moving averages. Introduced by Bill Williams in his book "Trading Chaos," the three lines are called the Jaw, Teeth, and Lips of the Alligator. The Alligator indicator helps traders identify the trend direction and its strength, as well as potential entry and exit points. When the three lines are intertwined or close to each other, it indicates a range-bound market, while a divergence between them indicates a trending market. The position of the price in relation to the Alligator lines can also provide signals, such as a buy signal when the price crosses above the Alligator lines and a sell signal when the price crosses below them.
In addition to these, we have several other commonly used technical indicators, such as MACD, RSI, MFI (Money Flow Index), VWAP, EMA, and Supertrend. I used all the built-in functions for these indicators from TradingView. Thanks to the developer of this TradingView Indicator.
I also created a BankNifty Components Table and checked it on the dashboard.

FDI-Adaptive Non-Lag Moving Average [Loxx]FDI-Adaptive Non-Lag Moving Average is a Fractal Dimension Index adaptive Non-Lag moving Average. This acts more like a trend coloring indictor with gradient coloring.
What is the Fractal Dimension Index?
The goal of the fractal dimension index is to determine whether the market is trending or in a trading range. It does not measure the direction of the trend. A value less than 1.5 indicates that the price series is persistent or that the market is trending. Lower values of the FDI indicate a stronger trend. A value greater than 1.5 indicates that the market is in a trading range and is acting in a more random fashion.
Included
Bar coloring
Loxx's Expanded Source Types

FDI-Adaptive, Jurik-Filtered, TMA w/ Price Zones [Loxx]FDI-Adaptive, Jurik-Filtered, TMA w/ Price Zones is a Triangular Moving Average that is Fractal Dimension Index Adaptive with Jurik Smoothing. You'll notice that this combination not only smooths out the signal but also catches bottoms better than other FIR digital filters. This is a multi-layered adaptive moving average. Price zones are calculated using a weighted range function. Future updates will included signals associated with these range bands. For now, however, these range bands serve as support and resistance, stop-loss or take profit, or indicators of market reversal.
What is the Triangular Moving Average
The Triangular Moving Average is basically a double-smoothed Simple Moving Average that gives more weight to the middle section of the data interval. The TMA has a significant lag to current prices and is not well-suited to fast moving markets. TMA = SUM ( SMA values)/ N Where N = the number of periods.
What is the Fractal Dimension Index?
The goal of the fractal dimension index is to determine whether the market is trending or in a trading range. It does not measure the direction of the trend. A value less than 1.5 indicates that the price series is persistent or that the market is trending. Lower values of the FDI indicate a stronger trend. A value greater than 1.5 indicates that the market is in a trading range and is acting in a more random fashion.
What is Jurik Volty used in the Juirk Filter?
One of the lesser known qualities of Juirk smoothing is that the Jurik smoothing process is adaptive. "Jurik Volty" (a sort of market volatility ) is what makes Jurik smoothing adaptive. The Jurik Volty calculation can be used as both a standalone indicator and to smooth other indicators that you wish to make adaptive.
What is the Jurik Moving Average?
Have you noticed how moving averages add some lag (delay) to your signals? ... especially when price gaps up or down in a big move, and you are waiting for your moving average to catch up? Wait no more! JMA eliminates this problem forever and gives you the best of both worlds: low lag and smooth lines.
Included:
Bar coloring
Signals
Alerts
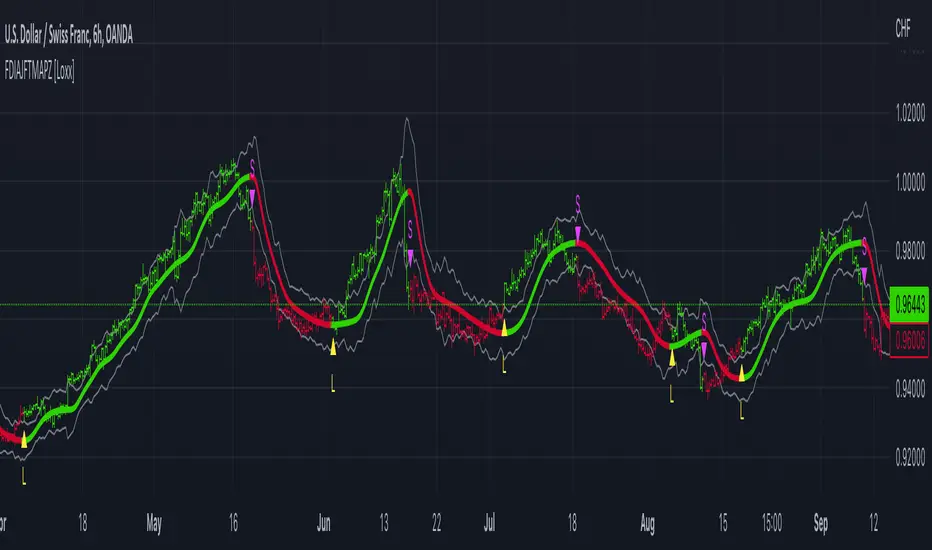
FDI-Adaptive Fisher Transform [Loxx]FDI-Adaptive Fisher Transform is a Fractal Dimension Adaptive Fisher Transform indicator.
What is the Fractal Dimension Index?
The goal of the fractal dimension index is to determine whether the market is trending or in a trading range. It does not measure the direction of the trend. A value less than 1.5 indicates that the price series is persistent or that the market is trending. Lower values of the FDI indicate a stronger trend. A value greater than 1.5 indicates that the market is in a trading range and is acting in a more random fashion.
What is Fisher Transform?
The Fisher Transform is a technical indicator created by John F. Ehlers that converts prices into a Gaussian normal distribution.
The indicator highlights when prices have moved to an extreme, based on recent prices. This may help in spotting turning points in the price of an asset. It also helps show the trend and isolate the price waves within a trend.
Included:
Zero-line and signal cross options for bar coloring
Customizable overbought/oversold thresh-holds
Alerts
Signals
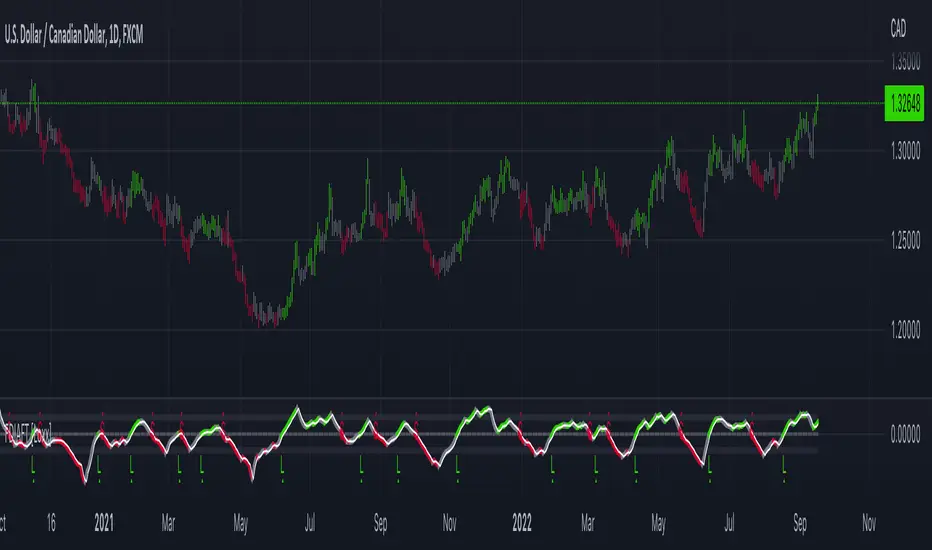
Orderblocks (Nephew_Sam_) - Open sourceHighlights orderblocks based on fractal market structure.
Whenever a new fractal high/low is created, it will search for the Orderblock and plot lines and labels
Options:
1. Select 3/5 bar fractal
2. Plot lines and labels on OB's
- Ability to filter OB only when a candle is fully engulfed
3. Change bar color of engulfed candles
4. Option to filter OB that follows with an FVG
View the published chart for more details on how this indicator works
Disclaimer: You have the permissions to use this code however make sure you give me the credits when you do and make it open source or grant me access to the code.