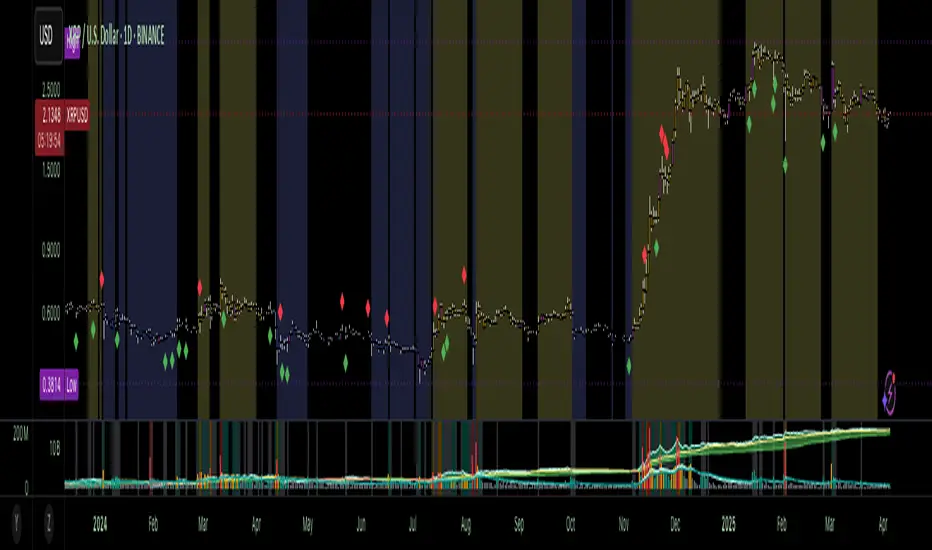
Accumulation-Distribution CandlesThis structural visualization tool maps each candle through the lens of Effort vs. Result, blending Volume, Range, and closing bias into a normalized pressure score. Candle bodies are dynamically color-coded using a five-tier system—from heavy accumulation to heavy distribution—revealing where energy is building, dispersing, or neutral. This helps to visually isolate Markup, Markdown, Re-accumulation, and Distribution at a glance.
The indicator calculates a strength score by multiplying price result (close minus open) by effort (volume or price range), smoothing this raw value using a Fibonacci-based EMA. (34 for standard, 55 for crypto; the higher crypto value acknowledges that 24/7 trading offers more hours per week or month than trad markets.) The result is standardized against its rolling deviation and clamped to a range. This score determines the visual tier:
• 💙 Dark Blue = heavy Accumulation (strong upward result on strong effort)
• 🩵 Pale Blue = mild Accumulation
• 🌚 Gray = neutral (low conviction or balance)
• 💛 Pale Yellow = mild Distribution
• 🧡 Deep Yellow = heavy Distribution (strong downward result on strong effort)
The tool is optimized for the 1D chart, where Wyckoff phases are most clearly expressed. However, it adapts well to lower timeframes when used selectively. Traders may hide the body coloring and enable only zone highlighting to preserve other candle overlays such as SUPeR TReND 2.718, which offers directional clarity and trend duration. This combination is especially useful on intraday charts (15m–1H) where microstructure matters but visual clutter must be avoided.
When used alongside other Volume overlays (such as the OBVX Conviction Bias) or Volatility indicators (such as the Asymmetric Turbulence Ribbon (ATR)), this indicator adds confluence to directional setups by contextualizing pressure with Volatility. For example: compression zones marked by ATR may align with persistent pale blue candles—indicating quiet Accumulation before expansion.
Optional Overlays:
Normally ON -
• 📌 Pin Bars , filtered by volume, to isolate wick-dominant reversals from key zones
• 💪🏻 Strong-Body Candles — fuchsia candles w/ high body-to-range ratio reflect conviction
• 🧯 Wick Absorption Candles — red candles w/ long wicks and low closing strength indicate failed pushes or absorbed breakouts
• 🟦/🟧 Zone Highlighting for candles above a defined Accumulation/Distribution threshold
Normally OFF -
• 🔺 Fractals (5-bar) to map swing pivots by underlying pressure tier (normally OFF)
• 🟥/🟩 Engulfing patterns, filtered by directional conviction (normally OFF)
The Pin Bar strategy benefits most from the zone logic—when a bullish pin bar appears in an Accumulation zone (esp. pale or dark blue), and Volume exceeds its rolling average, it may mark a spring or failed breakdown. Conversely, bearish pins in Distribution zones can mark rejection or resistance.
This is not a signal engine—it’s a narrative filter designed to slot cleanly into a multi-layered workflow of visual structure and informed execution. Use it to identify bias and phase. Then deploy trade triggers from tools like SUPeR TReND 2.718, or the liquidity flows shown the The Silver Lining or the AltSeasonality - MTF indicators, for example. The candle colors tell you who’s in control—the other tools tell you when to act.
ابحث في النصوص البرمجية عن "Fractal"
Hull Moving Average Adaptive RSI (Ehlers)Hull Moving Average Adaptive RSI (Ehlers)
The Hull Moving Average Adaptive RSI (Ehlers) is an enhanced trend-following indicator designed to provide a smooth and responsive view of price movement while incorporating an additional momentum-based analysis using the Adaptive RSI.
Principle and Advantages of the Hull Moving Average:
- The Hull Moving Average (HMA) is known for its ability to track price action with minimal lag while maintaining a smooth curve.
- Unlike traditional moving averages, the HMA significantly reduces noise and responds faster to market trends, making it highly effective for detecting trend direction and changes.
- It achieves this by applying a weighted moving average calculation that emphasizes recent price movements while smoothing out fluctuations.
Why the Adaptive RSI Was Added:
- The core HMA line remains the foundation of the indicator, but an additional analysis using the Adaptive RSI has been integrated to provide more meaningful insights into momentum shifts.
- The Adaptive RSI is a modified version of the traditional Relative Strength Index that dynamically adjusts its sensitivity based on market volatility.
- By incorporating the Adaptive RSI, the HMA visually represents whether momentum is strengthening or weakening, offering a complementary layer of analysis.
How the Adaptive RSI Influences the Indicator:
- High Adaptive RSI (above 65): The market may be overbought, or bullish momentum could be fading. The HMA turns shades of red, signaling a possible exhaustion phase or potential reversals.
- Neutral Adaptive RSI (around 50): The market is in a balanced state, meaning neither buyers nor sellers are in clear control. The HMA takes on grayish tones to indicate this consolidation.
- Low Adaptive RSI (below 35): The market may be oversold, or bearish momentum could be weakening. The HMA shifts to shades of blue, highlighting potential recovery zones or trend slowdowns.
Why This Combination is Powerful:
- While the HMA excels in tracking trends and reducing lag, it does not provide information about momentum strength on its own.
- The Adaptive RSI bridges this gap by adding a clear visual layer that helps traders assess whether a trend is likely to continue, consolidate, or reverse.
- This makes the indicator particularly useful for spotting trend exhaustion and confirming momentum shifts in real-time.
Best Use Cases:
- Works effectively on timeframes from 1 hour (1H) to 1 day (1D), making it suitable for swing trading and position trading.
- Particularly useful for trading indices (SPY), stocks, forex, and cryptocurrencies, where momentum shifts are frequent.
- Helps identify not just trend direction but also whether that trend is gaining or losing strength.
Recommended Complementary Indicators:
- Adaptive Trend Finder: Helps identify the dominant long-term trend.
- Williams Fractals Ultimate: Provides key reversal points to validate trend shifts.
- RVOL (Relative Volume): Confirms significant moves based on volume strength.
This enhanced HMA with Adaptive RSI provides a powerful, intuitive visual tool that makes trend analysis and momentum interpretation more effective and efficient.
This indicator is for educational and informational purposes only. It should not be considered financial advice or a guarantee of performance. Always conduct your own research and use proper risk management when trading. Past performance does not guarantee future results.

Hurst-Based Trend Persistence w/Poisson Prediction
---
# **Hurst-Based Trend Persistence w/ Poisson Prediction**
## **Introduction**
The **Hurst-Based Trend Persistence with Poisson Prediction** is a **statistically-driven trend-following oscillator** that provides traders with **a structured approach to identifying trend strength, persistence, and potential reversals**.
This indicator combines:
- **Hurst Exponent Analysis** (to measure how persistent or mean-reverting price action is).
- **Color-Coded Trend Detection** (to highlight bullish and bearish conditions).
- **Poisson-Based Trend Reversal Probability Projection** (to anticipate when a trend is likely to end based on statistical models).
By integrating **fractal market theory (Hurst exponent)** with **Poisson probability distributions**, this indicator gives traders a **probability-weighted view of trend duration** while dynamically adapting to market volatility.
---
## **Simplified Explanation (How to Read the Indicator at a Glance)**
1. **If the oscillator line is going up → The trend is strong.**
2. **If the oscillator line is going down → The trend is weakening.**
3. **If the color shifts from red to green (or vice versa), a trend shift has occurred.**
- **Strong trends can change color without weakening** (meaning a bullish or bearish move can remain powerful even as the trend shifts).
4. **A weakening trend does NOT necessarily mean a reversal is coming.**
- The trend may slow down but continue in the same direction.
5. **A strong trend does NOT guarantee it will last.**
- Even a powerful move can **suddenly reverse**, which is why the **Poisson-based background shading** helps anticipate probabilities of change.
---
## **How to Use the Indicator**
### **1. Understanding the Rolling Hurst-Based Trend Oscillator (Main Line)**
The **oscillator line** is based on the **Hurst exponent (H)**, which quantifies whether price movements are:
- **Trending** (values above 0 → momentum-driven, persistent trends).
- **Mean-reverting** (values below 0 → price action is choppy, likely to revert to the mean).
- **Neutral (Random Walk)** (values around 0 → price behaves like a purely stochastic process).
#### **Interpreting the Oscillator:**
- **H > 0.5 → Persistent Trends:**
- Price moves tend to sustain in one direction for longer periods.
- Example: Strong uptrends in bull markets.
- **H < 0.5 → Mean-Reverting Behavior:**
- Price has a tendency to revert back to its mean.
- Example: Sideways markets or fading momentum.
- **H ≈ 0.5 → Random Walk:**
- No clear trend; price is unpredictable.
A **gray dashed horizontal line at 0** serves as a **baseline**, helping traders quickly assess whether the market is **favoring trends or mean reversion**.
---
### **2. Color-Coded Trend Signal (Visual Confirmation of Trend Shifts)**
The oscillator **changes color** based on **price slope** over the lookback period:
- **🟢 Green → Uptrend (Price Increasing)**
- Price is rising relative to the selected lookback period.
- Suggests sustained bullish pressure.
- **🔴 Red → Downtrend (Price Decreasing)**
- Price is falling relative to the selected lookback period.
- Suggests sustained bearish pressure.
#### **How to Use This in Trading**
✔ **Stay in trends until a color change occurs.**
✔ **Use color changes as confirmation for trend reversals.**
✔ **Avoid counter-trend trades when the oscillator remains strongly colored.**
---
### **3. Poisson-Based Trend Reversal Projection (Anticipating Future Shifts)**
The **shaded orange background** represents a **Poisson-based probability estimation** of when the trend is likely to reverse.
- **Darker Orange = Higher Probability of Trend Reversal**
- **Lighter Orange / No Shade = Low Probability of Immediate Reversal**
💡 **The idea behind this model:**
✔ Trends **don’t last forever**, and their duration follows **statistical patterns**.
✔ By calculating the **average historical trend duration**, the indicator predicts **how likely a trend shift is at any given time**.
✔ The **Poisson probability function** is applied to determine the **expected likelihood of a reversal as time progresses**.
---
## **Mathematical Foundations of the Indicator**
This indicator is based on **two primary statistical models**:
### **1. Hurst Exponent & Trend Persistence (Fractal Market Theory)**
- The **Hurst exponent (H)** measures **autocorrelation** in price movements.
- If past trends **persist**, H will be **above 0.5** (meaning trend-following strategies are favorable).
- If past trends tend to **mean-revert**, H will be **below 0.5** (meaning reversal strategies are more effective).
- The **Rolling Hurst Oscillator** calculates this exponent over a moving window to track real-time trend conditions.
#### **Formula Breakdown (Simplified for Traders)**
The Hurst exponent (H) is derived using the **Rescaled Range (R/S) Analysis**:
\
Where:
- **R** = **Range** (difference between max cumulative deviation and min cumulative deviation).
- **S** = **Standard deviation** of price fluctuations.
- **Lookback** = The number of periods analyzed.
---
### **2. Poisson-Based Trend Reversal Probability (Stochastic Process Modeling)**
The **Poisson process** is a **probabilistic model used for estimating time-based events**, applied here to **predict trend reversals based on past trend durations**.
#### **How It Works**
- The indicator **tracks trend durations** (the time between color changes).
- A **Poisson rate parameter (λ)** is computed as:
\
- The **probability of a reversal at any given time (t)** is estimated using:
\
- **As t increases (trend continues), the probability of reversal rises**.
- The indicator **shades the background based on this probability**, visually displaying the likelihood of a **trend shift**.
---
## **Dynamic Adaptation to Market Conditions**
✔ **Volatility-Adjusted Trend Shifts:**
- A **custom volatility calculation** dynamically adjusts the **minimum trend duration** required before a trend shift is recognized.
- **Higher volatility → Requires longer confirmation before switching trend color.**
- **Lower volatility → Allows faster trend shifts.**
✔ **Adaptive Poisson Weighting:**
- **Recent trends are weighted more heavily** using an exponential decay function:
- **Decay Factor (0.618 by default)** prioritizes **recent intervals** while still considering historical trends.
- This ensures the model adapts to changing market conditions.
---
## **Key Takeaways for Traders**
✅ **Identify Persistent Trends vs. Mean Reversion:**
- Use the oscillator line to determine whether the market favors **trend-following or counter-trend strategies**.
✅ **Visual Trend Confirmation via Color Coding:**
- **Green = Uptrend**, **Red = Downtrend**.
- Trend changes help confirm **entry and exit points**.
✅ **Anticipate Trend Reversals Using Probability Models:**
- The **Poisson projection** provides a **statistical edge** in **timing exits before trends reverse**.
✅ **Adapt to Market Volatility Automatically:**
- Dynamic **volatility scaling** ensures the indicator remains effective in **both high and low volatility environments**.
Happy trading and enjoy!

Quarterly Theory ICT 02 [TradingFinder] True Open Session 90 Min🔵 Introduction
The Quarterly Theory ICT indicator is an advanced analytical system built on ICT (Inner Circle Trader) concepts and fractal time. It divides time into four quarters (Q1, Q2, Q3, Q4), and is designed based on the consistent repetition of these phases across all trading timeframes (annual, monthly, weekly, daily, and even shorter trading sessions).
Each cycle consists of four distinct phases: the first phase (Q1) is the Accumulation phase, characterized by price consolidation; the second phase (Q2), known as Manipulation or Judas Swing, is marked by initial false movements indicating a potential shift; the third phase (Q3) is Distribution, where price volatility peaks; and the fourth phase (Q4) is Continuation/Reversal, determining whether the previous trend continues or reverses.
🔵 How to Use
The central concept of this strategy is the "True Open," which refers to the actual starting point of each time cycle. The True Open is typically defined at the beginning of the second phase (Q2) of each cycle. Prices trading above or below the True Open serve as a benchmark for predicting the market's potential direction and guiding trading decisions.
The practical application of the Quarterly Theory strategy relies on accurately identifying True Open points across various timeframes.
True Open points are defined as follows :
Yearly Cycle :
Q1: January, February, March
Q2: April, May, June (True Open: April Monthly Open)
Q3: July, August, September
Q4: October, November, December
Monthly Cycle :
Q1: First Monday of the month
Q2: Second Monday of the month (True Open: Daily Candle Open price on the second Monday)
Q3: Third Monday of the month
Q4: Fourth Monday of the month
Weekly Cycle :
Q1: Monday
Q2: Tuesday (True Open: Daily Candle Open Price on Tuesday)
Q3: Wednesday
Q4: Thursday
Daily Cycle :
Q1: 18:00 - 00:00 (Asian session)
Q2: 00:00 - 06:00 (True Open: Start of London Session)
Q3: 06:00 - 12:00 (NY AM)
Q4: 12:00 - 18:00 (NY PM)
90 Min Asian Session :
Q1: 18:00 - 19:30
Q2: 19:30 - 21:00 (True Open at 19:30)
Q3: 21:00 - 22:30
Q4: 22:30 - 00:00
90 Min London Session :
Q1: 00:00 - 01:30
Q2: 01:30 - 03:00 (True Open at 01:30)
Q3: 03:00 - 04:30
Q4: 04:30 - 06:00
90 Min New York AM Session :
Q1: 06:00 - 07:30
Q2: 07:30 - 09:00 (True Open at 07:30)
Q3: 09:00 - 10:30
Q4: 10:30 - 12:00
90 Min New York PM Session :
Q1: 12:00 - 13:30
Q2: 13:30 - 15:00 (True Open at 13:30)
Q3: 15:00 - 16:30
Q4: 16:30 - 18:00
Micro Cycle (22.5-Minute Quarters) : Each 90-minute quarter is further divided into four 22.5-minute sub-segments (Micro Sessions).
True Opens in these sessions are defined as follows :
Asian Micro Session :
True Session Open : 19:30 - 19:52:30
London Micro Session :
T rue Session Open : 01:30 - 01:52:30
New York AM Micro Session :
True Session Open : 07:30 - 07:52:30
New York PM Micro Session :
True Session Open : 13:30 - 13:52:30
By accurately identifying these True Open points across various timeframes, traders can effectively forecast the market direction, analyze price movements in detail, and optimize their trading positions. Prices trading above or below these key levels serve as critical benchmarks for determining market direction and making informed trading decisions.
🔵 Setting
Show True Range : Enable or disable the display of the True Range on the chart, including the option to customize the color.
Extend True Range Line : Choose how to extend the True Range line on the chart, with the following options:
None: No line extension
Right: Extend the line to the right
Left: Extend the line to the left
Both: Extend the line in both directions (left and right)
Show Table : Determines whether the table—which summarizes the phases (Q1 to Q4)—is displayed.
Show More Info : Adds additional details to the table, such as the name of the phase (Accumulation, Manipulation, Distribution, or Continuation/Reversal) or further specifics about each cycle.
🔵 Conclusion
The Quarterly Theory ICT, by dividing time into four distinct quarters (Q1, Q2, Q3, and Q4) and emphasizing the concept of the True Open, provides a structured and repeatable framework for analyzing price action across multiple time frames.
The consistent repetition of phases—Accumulation, Manipulation (Judas Swing), Distribution, and Continuation/Reversal—allows traders to effectively identify recurring price patterns and critical market turning points. Utilizing the True Open as a benchmark, traders can more accurately determine potential directional bias, optimize trade entries and exits, and manage risk effectively.
By incorporating principles of ICT (Inner Circle Trader) and fractal time, this strategy enhances market forecasting accuracy across annual, monthly, weekly, daily, and shorter trading sessions. This systematic approach helps traders gain deeper insight into market structure and confidently execute informed trading decisions.

MACD+ Divergences [CryptoSmart] By IgnotusIndicator Description: MACD+ Divergence
---
Overview
The MACD+ Divergence is an enhanced version of the classic MACD (Moving Average Convergence Divergence) indicator, meticulously crafted by CryptoSmart. This proprietary tool integrates advanced divergence detection, Top Dog Trading MOM (Momentum) and DAD (Direction as Decision) variations, and unique background shading to provide traders with a comprehensive view of market momentum, trend direction, and potential reversals.
This indicator is not just a standard MACD; it incorporates a unique configuration aligned with a proprietary trading strategy developed by CryptoSmart. Its settings and code are restricted to preserve the integrity and effectiveness of the strategy. Traders can leverage this powerful tool to identify high-probability trade setups without constantly monitoring the charts.
---
Key Features
- Proprietary MACD Calculation:
- MACD line calculated using user-defined fast, slow, and signal lengths.
- Supports both Exponential Moving Averages (EMA) and Simple Moving Averages (SMA).
- Includes optimized settings for Top Dog Trading MOM and DAD variations for structured momentum and directional analysis.
- Dynamic Coloring:
- MACD histogram changes color dynamically based on its direction and position relative to the zero line:
- Green/Lime: Increasing momentum above the zero line.
- Red/Maroon: Decreasing momentum below the zero line.
- MACD line and signal line adapt their colors to reflect directional trends.
- Background Shading:
- Background color highlights key conditions:
- Lime: Bullish momentum or upward DAD direction.
- Red: Bearish momentum or downward DAD direction.
- Provides an intuitive visual cue for market sentiment.
- Advanced Divergence Detection:
- Identifies regular and hidden divergences in:
- MACD Histogram.
- MACD Line.
- MOM (Momentum).
- DAD (Direction as Decision).
- Regular divergences indicate potential trend reversals, while hidden divergences suggest trend continuation.
- Divergences are plotted as lines and labeled with clear markers (`R` for regular and `H` for hidden).
- Customizable Inputs:
- Enable or disable specific features, such as:
- Displaying regular or hidden divergences.
- Showing divergence labels.
- Using Top Dog Trading MOM and DAD variations.
- Adjustable offset for divergence markers ensures realistic entry points.
- Comprehensive Alert System:
- Alerts notify traders of key events, including:
- MACD line crossing the signal line.
- Divergence formations (regular and hidden).
- Changes in DAD direction (upward or downward).
- Alerts ensure traders don’t miss critical trading opportunities.
- Unique Configuration:
- Built with a proprietary configuration integrating a proven trading strategy.
- Parameters and logic are fine-tuned to deliver precise signals.
- Restricted code ensures alignment with the proprietary strategy.
- Aesthetic Enhancements:
- Clean and professional design with customizable colors and line styles.
- Optional histogram outlines for better visibility.
---
How It Works
1. MACD Calculation:
- MACD line = Difference between fast and slow moving averages.
- Signal line = Smoothed version of the MACD line.
- Histogram = Difference between the MACD line and signal line.
2. Divergence Logic:
- Fractals identify local highs and lows in the MACD histogram, MACD line, MOM, and DAD.
- Regular divergences occur when price makes a higher high/lower low, but the MACD indicator does not confirm the move.
- Hidden divergences occur when price makes a lower high/higher low, but the MACD indicator confirms the trend continuation.
3. Background Shading:
- Background color changes based on the direction of the MACD histogram or DAD line, providing a quick visual reference for market bias.
4. Alerts:
- Alerts trigger when specific conditions are met, such as divergences forming or the MACD line crossing the signal line.
---
Inputs
- Standard MACD Settings:
- Fast Length: Default = 12
- Slow Length: Default = 26
- Signal Smoothing: Default = 9
- Top Dog Trading Settings:
- Fast Length: Default = 5
- Slow Length: Default = 20
- Signal Smoothing: Default = 30
- Visualization Options:
- Enable/Disable Top Dog Trading MOM and DAD.
- Show regular or hidden divergences.
- Display divergence labels.
- Background shading for momentum/direction.
- Offset Adjustment:
- Adjust divergence markers to align with realistic entry points.
---
Usage
- Trend Reversals:
- Use regular divergences to identify potential trend reversals.
- Trend Continuation:
- Use hidden divergences to confirm ongoing trends.
- Entry/Exit Points:
- Combine divergence signals with MACD crossovers for precise entry and exit points.
- Market Sentiment:
- Monitor background shading to gauge overall market bias.
---
Tips for Traders
Combine with Other Indicators:
- Use this indicator alongside support/resistance levels, candlestick patterns, or volume analysis for confirmation.
Adjust Parameters:
- Experiment with different fast, slow, and signal lengths to suit your trading style and timeframe.
Focus on Divergences:
- Pay close attention to divergence signals, as they often precede significant price movements.
Use Alerts:
- Enable alerts to stay informed about key events without constantly monitoring the chart.
---
Why Choose MACD+ Divergence ?
This indicator stands out due to its unique integration of a proprietary trading strategy, ensuring reliable and actionable signals. The inclusion of Top Dog Trading MOM and DAD variations adds precision, while the advanced divergence detection and alert system make it an indispensable tool for traders seeking an edge in the markets.
---
Restrictions
To maintain the integrity and effectiveness of the MACD+ Divergence , its configuration and code are restricted. This ensures alignment with the proprietary strategy developed by CryptoSmart, delivering consistent and accurate results.
---
Conclusion
The **MACD+ Divergence ** is a cutting-edge tool that combines traditional MACD analysis with advanced divergence detection and proprietary enhancements. Its unique configuration and restricted code ensure it remains a powerful and reliable resource for traders. Whether you’re looking for trend reversals, continuations, or overall market sentiment, this indicator provides the insights needed to make informed trading decisions.
---
Disclaimer
This indicator is for educational and informational purposes only. Trading involves risk, and past performance is not indicative of future results. Always conduct your own research and consult with a financial advisor before making trading decisions.

Uptrick: Quantum RSI +Uptrick: Quantum RSI+ (QR-Pro) is a technical analysis indicator designed to enhance the functionality of the traditional Relative Strength Index (RSI). It incorporates adaptive volatility adjustments, threshold calculations, divergence detection, and visualization enhancements. This script is a vendor-protected indicator, and its source code is not publicly available. It adheres to TradingView’s vendor requirements while providing traders with a refined approach to analyzing market momentum, strength, and trend conditions.
Purpose:
The purpose of Quantum RSI+ (QR-Pro) is to adapt the RSI methodology dynamically based on changing market conditions. By utilizing smoothing techniques, adjustable length calculations, and divergence detection, it provides a structured way to evaluate trend strength and potential reversals. The indicator aims to offer a balanced response to varying levels of market volatility, helping traders minimize lag while reducing signal noise. Unlike standard RSI indicators that rely on fixed period settings, this script adapts to real-time market conditions, offering enhanced responsiveness and more accurate detection of potential reversal points.
Overview:
Quantum RSI+ (QR-Pro) modifies traditional RSI calculations by integrating a state-based adjustment system that alters the RSI length dynamically. This allows the indicator to respond more effectively to different volatility environments. It incorporates multiple analytical tools, such as divergence detection and support/resistance visualization, to assist in identifying momentum shifts and trend strength. In addition, the script offers an advanced metrics table that provides deeper insights into market statistics such as entropy, kurtosis, and volatility analysis. These insights are valuable for traders who wish to understand market structure in greater detail and adjust their strategies accordingly.
Originality:
This indicator differentiates itself by combining adaptive RSI length adjustments, divergence detection, and dynamic learning zones. Unlike standard RSI implementations that use fixed calculations, Quantum RSI+ (QR-Pro) adjusts automatically to market volatility, making it more responsive and effective under changing conditions. The advanced metrics table, which includes measures like the Hurst exponent, entropy, kurtosis, and volatility Z-score, further distinguishes the script by offering an additional layer of market intelligence. These metrics help traders determine whether a market is trending or mean-reverting, assess randomness, and identify volatility spikes, thereby justifying the script's value compared to freely available alternatives.
Enhanced RSI Framework:
Quantum RSI+ (QR-Pro) introduces a framework that adjusts RSI sensitivity based on volatility. Traditional RSI methods use a fixed calculation period, which can result in signals that either react too slowly or too quickly depending on market behavior. This indicator modifies the RSI length dynamically, shortening it in high-volatility periods to capture rapid shifts while extending it in low-volatility periods to filter out noise. This adaptive approach provides a more balanced assessment of market momentum and helps traders avoid false signals. It is best used in conjunction with other technical analysis tools to validate trade setups and manage risk effectively.
Advanced Adaptive Smoothing:
The script employs a multi-layered smoothing technique to refine RSI readings. Traditional RSI indicators can be affected by market noise, leading to erratic signals. By applying a structured smoothing process, Quantum RSI+ (QR-Pro) helps identify sustained trends while filtering out short-lived fluctuations. This balance between reactivity and stability leads to more reliable momentum assessments, making it easier for traders to discern genuine market movements from transient noise.
Dynamic Market Intelligence:
Instead of relying on static thresholds, Quantum RSI+ (QR-Pro) calculates its levels dynamically based on historical market performance. This approach provides a contextual understanding of market conditions, allowing traders to better anticipate reversals. Additional validation methods further increase the reliability of the signals, making the indicator a practical tool for confirming potential trend changes in real time.
Inputs:
• Line Width – Sets the thickness of the RSI plot line for visual clarity.
• MA Type for Quantum RSI – Allows users to choose the type of moving average (SMA, EMA, WMA, or VWMA) to overlay on the Quantum RSI.
• MA Length – Defines the period used for the selected moving average, providing additional trend filtering.
• Enable Moving Average – Toggles the calculation and plotting of the chosen moving average on the RSI. Bar coloring is then adjusted according to the slope of this MA if enabled.
• Ribbon Help – Enables or disables a moving average ribbon that visually compares two moving averages for enhanced trend clarity. Bar coloring is then adjusted according to the slope of this Ribbon if enabled.
• Ribbon Difference – Adjusts the gap between the fast and slow moving averages used in the ribbon visualization.
• Slope Length – Determines the period for calculating the slope of the moving average, which influences its color representation based on trend direction. A higher value usually can help filter out more noise as it would not be affected by small moves.
• Show Advanced Metrics Table – Toggles the display of a table that presents advanced market metrics.
Features and Usage:
• Adaptive RSI Length – Dynamically adjusts the RSI length based on market volatility. Traders can use this feature to obtain more responsive RSI signals during volatile periods and smoother readings during calmer market conditions.
• Quantum RSI Smoothing – Applies a structured smoothing process to RSI values to reduce noise, helping traders focus on genuine momentum shifts rather than transient fluctuations.
• Holographic Divergence Detection – Detects bullish and bearish divergences by comparing price action with RSI movements. This feature can be used to confirm potential trend reversals when combined with other market data.
• Gradient-Filled Zones – Highlights areas with smooth gradient transitions, making it easier to visualize and anticipate shifts in market sentiment.
• Moving Average of RSI – Overlays different moving averages on the RSI to provide additional trend filtering and confirmation for trading decisions.
• Ribbon Visualization – Displays a dynamic moving average ribbon that compares fast and slow moving averages, offering additional visual context and clarity regarding trend direction and potential momentum shifts.
• Metrics Table – Presents market statistics such as the Hurst exponent, Shannon entropy, kurtosis, skewness, fractal dimension, and volatility Z-score. These metrics offer deeper insights into market structure, assisting traders in understanding whether markets are trending or reverting and identifying periods of uncertainty. Here's what the metrics tell you:
• Hurst Exponent – Provides insight into whether market behavior tends to follow a trending or mean-reverting pattern.
• Shannon Entropy – Gauges the randomness or unpredictability in price movements, reflecting market stability.
• Kurtosis – Highlights the likelihood of extreme price swings, indicating the presence of heavy tails in the return distribution.
• Skewness – Indicates the asymmetry in the distribution of returns, pointing to potential biases in price direction.
• Fractal Dimension – Assesses the complexity of market patterns, revealing the intricacy of price action.
• Volatility Z-Score – Standardizes current volatility relative to historical levels, helping to identify periods of unusual market activity.
• UPT State – Provides a qualitative evaluation of the overall market environment, categorizing conditions as favorable, cautionary, or neutral for trading.
• Alerts – Built-in alert conditions notify users when bullish or bearish divergences occur, enabling traders to automate signal detection and respond promptly to market changes.
Summary:
Quantum RSI+ (QR-Pro) is a structured RSI-based momentum analysis tool that adapts to market conditions dynamically. By incorporating volatility-based adjustments, adaptive threshold calculations, and divergence detection, it delivers enhanced trend recognition and trade signals. Its advanced visualization techniques and moving average options offer a clear representation of market dynamics, while the advanced metrics table provides additional insights into market structure and behavior. Traders can use this indicator to identify overbought and oversold conditions dynamically, filter market noise through adaptive smoothing, and confirm trade signals using divergence detection. It is best applied as part of a comprehensive technical analysis strategy to validate trends and potential reversals in real-world trading scenarios.
Disclaimer:
This indicator is a technical analysis tool and should not be considered financial advice. Trading involves significant risk, and past performance does not guarantee future results. Users should exercise discretion and employ proper risk management when utilizing this tool in live trading.

SYMPL Reversal BandsThis is an expansion of the Hybrid moving average. It uses the same hybrid moving code from the hybrid moving average script with an additional layer using the ta.hma function for some slight additional smoothing. Colors of the bands change dynamically based of the long and short hybrid moving averages running in the background. This can be really helpful in identifying periods to short bounces or long dips.
Below is the explanation of the hybrid moving average
Hybrid Moving Average Market Trend System - , designed to visualize market trends using a combination of three moving averages: FRAMA (Fractal Adaptive Moving Average), VIDYA (Variable Index Dynamic Average), and a Hamming windowed Volume-Weighted Moving Average (VWMA).
Key Features:
FRAMA Calculation:
FRAMA adapts to market volatility by dynamically adjusting its smoothing factor based on the fractal dimension of price movement. This allows it to be more responsive during trending periods while filtering out noise in sideways markets. The FRAMA is calculated for both short and long periods
VIDYA with CMO:
The VIDYA (Variable Index Dynamic Average) is based on a Chande Momentum Oscillator (CMO), which adjusts the smoothing factor dynamically depending on the momentum of the market. Higher momentum periods result in more responsive averages, while low momentum periods lead to smoother averages. Like FRAMA, VIDYA is calculated for both short and long periods.
Hamming Windowed VWMA:
This VWMA variation applies a Hamming window to smooth the weighting of volume across the calculation period. This method emphasizes central data points and reduces noise, making the VWMA more adaptive to volume fluctuations. The Hamming VWMA is calculated for short and long periods, offering another layer of adaptability to the hybrid moving average.
Hybrid Moving Averages:
Dynamic Coloring and Filling:
The script uses dynamic color transitions to visually distinguish between bullish and bearish conditions:

Hybrid Moving Average - Market TrendHybrid Moving Average Market Trend System - , designed to visualize market trends using a combination of three moving averages: FRAMA (Fractal Adaptive Moving Average), VIDYA (Variable Index Dynamic Average), and a Hamming windowed Volume-Weighted Moving Average (VWMA).
Key Features:
FRAMA Calculation:
FRAMA adapts to market volatility by dynamically adjusting its smoothing factor based on the fractal dimension of price movement. This allows it to be more responsive during trending periods while filtering out noise in sideways markets. The FRAMA is calculated for both short and long periods
VIDYA with CMO:
The VIDYA (Variable Index Dynamic Average) is based on a Chande Momentum Oscillator (CMO), which adjusts the smoothing factor dynamically depending on the momentum of the market. Higher momentum periods result in more responsive averages, while low momentum periods lead to smoother averages. Like FRAMA, VIDYA is calculated for both short and long periods.
Hamming Windowed VWMA:
This VWMA variation applies a Hamming window to smooth the weighting of volume across the calculation period. This method emphasizes central data points and reduces noise, making the VWMA more adaptive to volume fluctuations. The Hamming VWMA is calculated for short and long periods, offering another layer of adaptability to the hybrid moving average.
Hybrid Moving Averages:
Dynamic Coloring and Filling:
The script uses dynamic color transitions to visually distinguish between bullish and bearish conditions:

Momentum TheoryMomentum Theory is a mechanical pattern-recognition tool for rapid multi-timeframe analysis. It utilizes higher timeframe breakout levels and peak levels to quickly identify multi-timeframe Swing Points that help in setting a bias, formulating a setup, and executing an entry. It takes advantage of the fractal nature of the market by applying one concept for top-down analysis that scalpers, day traders, and swing traders can use.
✅ Rapid Multi-Timeframe Analysis
✅ Mechanical Pattern-Recognition Used to Filter Setups
✅ For Scalpers, Day Traders, and Swing Traders
--- 📷 INDICATOR GALLERY ---
--- ⚡ ANALYSIS FEATURES ---
✔ Multi-Timeframe Map
Displays breakout levels, peak levels, bar flow, and swing points of higher timeframes. Read how the market is moving with a quick glance.
✔ Bar Flow
Displays whether the previous higher timeframe bar closed in breakout, fakeout, inside, or outside. Aids to quickly read market flow.
There are 4 Bar Types: Breakout , Fakeout , Inside , Outside
✔ Momentum Cycles
Displays which part of the Momentum Cycle the timeframe is currently in to anticipate future movement.
Read more information below at Momentum Theory Concept
✔ Quick Analysis
Calculates a percentage bias based on the position of the higher timeframes to set an overall bias. Great for when trying to narrow down a large watchlist to a few pairs.
✔ Market Snapshots
Takes a snapshot of the entire market on all valid trigger bars for future review. Tracks Quick Analysis, Momentum Cycles, and Bar Flow at that exact point in time.
Limited to the last 150 entry bars. Use TradingView Bar Replay to access more history.
--- ⛰️ LEVELS FEATURES ---
✔ Breakout Bias
Shows the location of all the higher timeframe breakout levels and if price is currently bullish or bearish. Breakout bias shows the overall bias of the timeframe.
✔ Peak Bias
Shows which peak level has been triggered of the higher timeframe and if price closed above or below it. Peak bias shows the current momentum of the timeframe.
✔ Trigger Bars
Displays when the lower and middle timeframes are moving in alignment. Spot when the lower timeframes are starting to move together.
⚠️ Trigger bars are an indication of breakout bias alignment at the lowest timeframes. They are NOT signals to be taken blindly without further analysis.
✔ Automatic Range Detection
Detects if the current and higher timeframe is in a range and plots those levels on the chart.
Ranges are created when the following 3 bar scenarios occur:
Inside Bar - Peaks of current bar closed inside previous bar's peaks
Outside Bar - Peaks of current bar are outside previous bar's peaks, but closed inside.
Mirrored Fakeout Bars - 2 opposite facing fakeout bars in a row
✔ Key Levels Highlights
Highlights the relevant levels for each timeframe and if current price is above or below them.
✔ Visual Elements
Highlights key elements like breakout level flips, fakeout bars, intraday session trading times, off session times, and higher timeframe swing points.
--- 🔥 OTHER FEATURES ---
✔ Built-In Alerts
Multiple built-in alert types to notify you of significant events in the market.
✔ Dark and Light Modes
Adjustable theme colors to trade your chart the way you want.
✔ Plug-and-Play
Automatically changes the relevant levels depending on the viewed timeframe. No initial settings to configure. Just add it to your chart and start trading!
H4 - Monthly Setups / Weekly Momentum
H1 -Weekly Setups / Daily Momentum
M15 - Daily Setups / H8 Momentum
M5 -H8 Setups / H2 Momentum
M3 - H4 Setups / H1 Momentum
M1 - H1 Setups / M15 Momentum
--- 💡 MOMENTUM THEORY CONCEPT ---
The best trade setups are found at swing points for 3 reasons:
They are the highest probability point the market will continue pushing.
They provide the best Stop Loss protection.
They offer the greatest Risk-to-Reward.
The goal of trading is to identify when these swing points occur to take the best trade setups.
Every swing point consists of a push towards a peak, a peak formation, and a push away from a peak. There is no way to know how long a push towards or away from a peak will last, but the peak formation can be identified by 2 elements:
A fakeout of a previous peak level
A flip of its last breakout level
We can track the movement of the market by looking at which peak level is triggered relative to its breakout level. How price behaves at the previous peak levels shows where momentum is headed. It continues to build towards a new peak until it fakes out the previous peak level and flips its breakout level, creating a swing point.
Swing points on the higher timeframes show up as multiple swing points on the lower timeframes, but they often won't be moving in sync. When 2 timeframe swing points get in alignment, the market will move smoothly together. You find the lower timeframe swing point the exact same way you find the higher timeframe one.
The market is constantly moving from one swing point to the next in a repeatable cycle. By using higher timeframe breakout levels and peak levels triggered, we can track where we are in this cycle to anticipate its future movement. This is the Momentum Cycle and it repeats itself over and over.
By using the exact same concept, we can identify mechanical alignment patterns on the lower timeframes to create setups that work in every phase of the market cycle. Identify your own patterns or use the suggested ones below. Watch the Live Trading Examples to see how these patterns are used.
✔ Range Setups
✔ Continuation Setups
✔ Reversal Setups
--- 🧩 EXTENDING MOMENTUM THEORY ---
If the best trade setups are found at swing points, then that must mean that every trading strategy that's worth learning must have some type of method to identify that specific move. Since Momentum Theory specializes in identifying the swing point, it can easily fit into most trading strategies by removing discretion and inserting a mechanical process to filter your existing strategy's setups. By using only non-negotiable levels such as Previous Day High / Low, you can convert most discretionary patterns into mechanical ones to hopefully help increase your consistency. My hope is that you can build your own library of mechanical setups that are specific to your strategy that go beyond the ones that I've provided.
--- 📝 HOW TO USE ---
⚠ Click on "Indicators > Invite-Only > Momentum Theory" to add it to your charts.
1) Determine directional bias on the higher timeframe chart.
2) Identify the cycle and setup pattern on the middle timeframe chart and wait for the momentum timeframe to be triggered.
3) Execute entries when the lower timeframes are aligned. Market is fractal and you can pick whatever timeframe you want for entry. Trade as simple or complex as you want.
⚠️ Trigger bars are an indication of breakout bias alignment at the lowest timeframes. They are NOT signals to be taken blindly without further analysis.
--- 🎞️ LIVE TRADING EXAMPLES ---
Market Analysis with Momentum Theory
Day Trading with Mechanical Setups (using Momentum Theory Scanner)
Momentum Theory Scalping Concepts - Asia Session - GOLD

Awesome_Accelerator_Zone OscillatorExplanation and Usage Guide for AO_AC_ZONE Oscillator
Indicator Overview
The **AO_AC_ZONE** oscillator is based on the concepts introduced by **Bill Williams** in his book *New Trading Dimensions*. This indicator combines the **Awesome Oscillator (AO)**, **Accelerator Oscillator (AC)**, and a custom **Zone Oscillator**, visualizing them together in a clear, color-coded format.
The Zone Oscillator is derived from the relationship between AO and AC, indicating the market's dominant momentum state (bullish, bearish, or neutral). It also integrates real-time candle coloring to visually align price bars with the Zone's momentum.
---
**Components**
1. **Awesome Oscillator (AO)**:
- AO measures the difference between a 5-period and 34-period Simple Moving Average (SMA) applied to the midpoints of candles.
- It reflects market momentum, where:
- Green bars = increasing momentum
- Red bars = decreasing momentum
2. **Accelerator Oscillator (AC)**:
- AC is calculated as the difference between AO and its 5-period SMA.
- It indicates the acceleration or deceleration of market momentum.
- Fuchsia bars = increasing momentum
- Purple bars = decreasing momentum
3. **Zone Oscillator**:
- The Zone combines AO and AC states:
- **Green Zone**: Both AO and AC are positive (bullish momentum).
- **Red Zone**: Both AO and AC are negative (bearish momentum).
- **Gray Zone**: AO and AC have differing signs (neutral/uncertain momentum).
- Candle colors dynamically match the Zone’s state for enhanced visual clarity.
---
**How to Use the Indicator**
**1. Interpreting the Oscillators**
- **AO**: Use it to detect momentum direction and changes. Pay attention to shifts in bar color:
- **Increasing AO (Aqua)**: Bullish momentum gaining strength.
- **Decreasing AO (Navy)**: Bullish momentum weakening or bearish momentum strengthening.
- **AC**: Provides early signals of momentum shifts.
- If AC changes color ahead of AO, it signals potential trend reversals or accelerations.
**2. Using the Zone Oscillator**
- **Green Zone**:
- Both AO and AC are positive.
- Indicates a strong bullish trend. Look for buying opportunities in line with the trend.
- **Red Zone**:
- Both AO and AC are negative.
- Signals strong bearish momentum. Look for shorting opportunities.
- **Gray Zone**:
- AO and AC are in conflict.
- Represents uncertainty; avoid trading or wait for a clear signal.
---
**Real-Time Application**
**Candle Coloring**
- The indicator modifies candle colors to match the Zone Oscillator's state:
- **Green Candles**: Strong bullish momentum.
- **Red Candles**: Strong bearish momentum.
- **Gray Candles**: Neutral momentum.
**Recommended Strategy (Based on New Trading Dimensions)**:
1. **Identify the Zone**:
- Focus on Green Zones for long entries and Red Zones for short entries.
2. **Look for AO/AC Confirmation**:
- Enter trades in the direction of both AO and AC when they align with the Zone.
- For exits, monitor when AO and AC conflict (Gray Zone).
3. **Use in Combination**:
- Combine this oscillator with fractals or trend indicators to confirm signals.
---
**Benefits**
- Visualizes momentum strength, acceleration, and alignment in one chart.
- Simplifies decision-making by integrating price action with oscillator dynamics.
- Supports faster trade identification and execution by highlighting bullish, bearish, and neutral zones.
---
**Disclaimer**
This indicator is a tool to assist in market analysis. Always incorporate proper risk management and avoid trading during uncertain conditions (Gray Zones). For optimal results, use this oscillator in conjunction with other analysis methods like support/resistance, volume analysis, and trend-following systems.

Potential Upcoming Trend ToolThis Script has the specific use of identifying when and how a new trend may start to take form, rather than focusing on how a trend has already formed on a longer term basis.
This Script is useful on it's own and not in conjunction with another. It works by taking on the most recent price data rather than a long term historical string.
It differs from standard trend following indicators because it's use is far less historical, and more present. It requires less pivot points than normal to be validated as a strong trend.
It works by taking local pivot points and fractals to form its parallel basis. The Trend lines will continually move as more recent price action data appears and the the channel will get thinner, until it is clear a trend has arrived and consolidated.
The idea really is to see a constantly evolving picture of a sudden change in movement, allowing you to have an earlier eye on what is potentially to come.
The faint mid-point line gives a reasonable reading of where you would find yourself halfway within a new trend and will also move inline with the shown trendlines.
This allows you to easily track when sentiment and therefore trends are about to change. It's much more useful on lower timeframes because they will often give the first indication something is changing.
Colours are fully customisable.

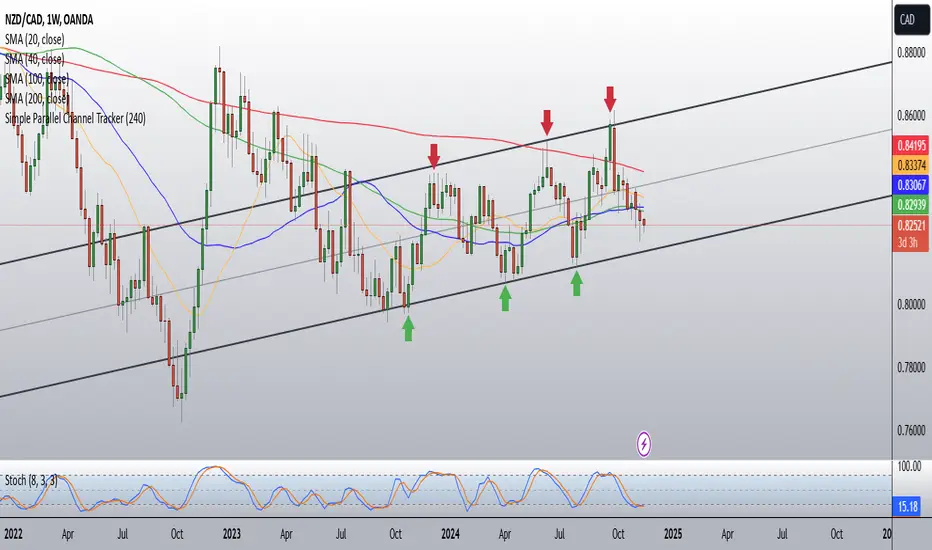
Simple Parallel Channel TrackerThis script will automatically draw price channels with two parallel trends lines, the upper trendline and lower trendline. These lines can be changed in terms of appearance at any time.
The Script takes in fractals from local and historic price action points and connects them over a certain period or amount of candles as inputted by the user. It tracks the most recent highs and lows formed and uses this data to determine where the channel begins.
The Script will decide whether to use the most recent high, or low, depending on what comes first.
Why is this useful?
Often, Traders either have no trend lines on their charts, or they draw them incorrectly. Whichever category a trader falls into, there can only be benefits from having Trend lines and Parallel Channels drawn automatically.
Trends naturally occur in all Markets, all the time. These oscillations when tracked allow for a more reliable following of Markets and management of Market cycles.
Infinity Market Grid -AynetConcept
Imagine viewing the market as a dynamic grid where price, time, and momentum intersect to reveal infinite possibilities. This indicator leverages:
Grid-Based Market Flow: Visualizes price action as a grid with zones for:
Accumulation
Distribution
Breakout Expansion
Volatility Compression
Predictive Dynamic Layers:
Forecasts future price zones using historical volatility and momentum.
Tracks event probabilities like breakout, fakeout, and trend reversals.
Data Science Visuals:
Uses heatmap-style layers, moving waveforms, and price trajectory paths.
Interactive Alerts:
Real-time alerts for high-probability market events.
Marks critical zones for "buy," "sell," or "wait."
Key Features
Market Layers Grid:
Creates dynamic "boxes" around price using fractals and ATR-based volatility.
These boxes show potential future price zones and probabilities.
Volatility and Momentum Waves:
Overlay volatility oscillators and momentum bands for directional context.
Dynamic Heatmap Zones:
Colors the chart dynamically based on breakout probabilities and risk.
Price Path Prediction:
Tracks price trajectory as a moving "wave" across the grid.
How It Works
Grid Box Structure:
Upper and lower price levels are based on ATR (volatility) and plotted dynamically.
Dashed green/red lines show the grid for potential price expansion zones.
Heatmap Zones:
Colors the background based on probabilities:
Green: High breakout probability.
Blue: High consolidation probability.
Price Path Prediction:
Forecasts future price movements using momentum.
Plots these as a dynamic "wave" on the chart.
Momentum and Volatility Waves:
Shows the relationship between momentum and volatility as oscillating waves.
Helps identify when momentum exceeds volatility (potential breakouts).
Buy/Sell Signals:
Triggers when price approaches grid edges with strong momentum.
Provides alerts and visual markers.
Why Is It Revolutionary?
Grid and Wave Synergy:
Combines structural price zones (grid boxes) with real-time momentum and volatility waves.
Predictive Analytics:
Uses momentum-based forecasting to visualize what’s next, not just what’s happening.
Dynamic Heatmap:
Creates a living map of breakout/consolidation zones in real-time.
Scalable for Any Market:
Works seamlessly with forex, crypto, and stocks by adjusting the ATR multiplier and box length.
This indicator is not just a tool but a framework for understanding market dynamics at a deeper level. Let me know if you'd like to take it even further — for example, adding machine learning-inspired probability models or multi-timeframe analysis! 🚀
APF Indicator with Enhanced Machine LearningKey Components:
Physics-Inspired Features:
Fractal Geometry (High/Low Signal): Utilizes pivot points to identify fractal patterns in price movements, which can signal potential market reversals.
Quantum Mechanics (Probabilistic Monte Carlo Signal): Employs Monte Carlo simulations to capture the probabilistic nature of market behavior, reflecting the randomness and uncertainty inherent in financial markets.
Thermodynamics (Efficiency Ratio Signal): Measures the efficiency of price movements over a period, comparing directional change to total volatility to assess trend strength.
Chaos Theory (Normalized ATR Signal): Analyzes market volatility using the Average True Range (ATR) and normalizes price deviations to identify chaotic market conditions.
Network Theory (Correlation Signal with BTC): Examines the correlation between the asset in question and Bitcoin (BTC) to understand interconnected market dynamics and potential influences.
String Theory (Combined RSI & MACD Signal): Combines the Relative Strength Index (RSI) and Moving Average Convergence Divergence (MACD) indicators to evaluate momentum and trend direction.
Fluid Dynamics (Normalized OBV Signal): Uses On-Balance Volume (OBV) to assess the flow of volume in relation to price changes, indicating buying or selling pressure.
Advanced Machine Learning Engine:
Ensemble Learning: Implements an ensemble of five machine learning models to improve predictive performance and reduce overfitting.
Adaptive Learning Rate (Adam Optimizer): Uses the Adam optimization algorithm to adjust learning rates dynamically, enhancing convergence speed and handling of noisy data.
Training Loop: Models are trained over a specified number of epochs, updating weights based on the error between predicted and actual values.
Feature Vector: Combines the physics-inspired signals into a feature vector that serves as input for the machine learning models.
Prediction and Error Calculation: Each ensemble member generates a prediction, and errors are calculated to refine model weights through gradient descent.
Signal Post-Processing:
Signal Smoothing: Applies an Exponential Moving Average (EMA) to smooth the machine learning signal, reducing noise.
Memory Retention Factor: Incorporates a memory factor to blend the smoothed signal with the raw prediction, balancing recent data with historical trends.
Color Coding: Assigns colors to the signal based on percentile ranks, providing visual cues for signal strength (e.g., green for strong signals, red for weak signals).
Market Condition Analysis:
Volatility Assessment: Compares short-term and long-term volatility to determine if the market is experiencing high volatility.
Trend Identification: Uses moving averages to identify bullish or bearish trends.
Background Coloring: Changes the chart background color based on market conditions, offering an at-a-glance understanding of current trends and volatility levels.
Usage and Customization:
Inputs and Parameters: The indicator allows users to customize various parameters, including learning rate, lookback period, memory factor, number of simulations, error threshold, and training epochs, enabling fine-tuning according to individual trading strategies.
Dynamic Adaptation: With adaptive learning rates and ensemble methods, the indicator adjusts to evolving market conditions, aiming to maintain performance over time.
Benefits:
Comprehensive Analysis: By integrating multiple physics-inspired signals, the indicator captures different facets of market behavior, from momentum to volatility to volume flow.
Enhanced Predictive Accuracy: The advanced machine learning engine, particularly the use of ensemble learning and the Adam optimizer, strives to improve prediction accuracy and model robustness.
User-Friendly Visualization: The use of color-coded signals and background shading makes it easier for traders to interpret the data and make informed decisions quickly.
Versatility: Suitable for various timeframes and assets, especially those with significant correlation to Bitcoin, given the inclusion of the network theory component.
Conclusion:
This indicator represents a fusion of advanced technical analysis and machine learning, leveraging complex algorithms to provide traders with potentially more accurate and responsive signals. By combining traditional indicators with innovative computational techniques, it aims to offer a powerful tool for navigating the complexities of financial markets.

ka66: Bar Range BandsThis tool takes a bar's range, and reflects it above the high and below the low of that bar, drawing upper and lower bands around the bar. Repeated for each bar. There's an option to then multiply that range by some multiple. Use a value greater than 1 to get wider bands, and less than one to get narrower bands.
This tool stems out of my frustration from the use of dynamic bands (like Keltner Channels, or Bollinger Bands), in particular for estimating take profit points.
Dynamic bands work great for entries and stop loss, but their dynamism is less useful for a future event like taking profit, in my experience. We can use a smaller multiple, but then we can often lose out on a bigger chunk of gains unnecessarily.
The inspiration for this came from a friend explaining an ICT/SMC concept around estimating the magnitude of a trend, by calculating the Asian Session Range, and reflecting it above or below on to the New York and London sessions. He described this as standard deviation of the Asian Range, where the range can thus be multiplied by some multiple for a wider or narrower deviation.
This, in turn, also reminded me of the Measured Move concept in Technical Analysis. We then consider that the market is fractal in nature, and this is why patterns persist in most timeframes. Traders exist across the spectrum of timeframes. Thus, a single bar on a timeframe, is made up of multiple bars on a lower timeframe . In other words, when we reflect a bar's range above or below itself, in the event that in a lower timeframe, that bar fit a pattern whose take profit target could be estimated via a Measured Move , then the band's value becomes a more valid estimate of a take profit point .
Yet another way to think about it, by way of the fractal nature above, is that it is essentially a simplified dynamic support and resistance mechanism , even simpler than say the various Pivot calculations (e.g. Classical, Camarilla, etc.).
This tool in general, can also be used by those who manually backtest setups (and certainly can be used in an automated setting too!). It is a research tool in that regard, applicable to various setups.
One of the pitfalls of manual backtesting is that it requires more discipline to really determine an exit point, because it's easy to say "oh, I'll know more or less where to exit when I go live, I just want to see that the entry tends to work". From experience, this is a bad idea, because our mind subconsciously knows that we haven't got a trained reflex on where to exit. The setup may be decent, but without an exit point, we will never have truly embraced and internalised trading it. Again, I speak from experience!
Thus, to use this to research take profit/exit points:
Have a setup in mind, with all the entry rules.
Plot your setup's indicators, mark your signals.
Use this indicator to get an idea of where to exit after taking an entry based on your signal.
Credits:
@ICT_ID for providing the idea of using ranges to estimate how far a trend move might go, in particular he used the Asian Range projected on to the London and New York market sessions.
All the technicians who came up with the idea of the Measured Move.

Futures Weekly Open RangeThe weekly opening range ( high to low ) is calculated from the open of the market on Sunday (1800 EST) till the opening of the Bond Market on Monday morning (0800 EST). This is the first and most crucial range for the trading week. As ICT has taught, price is moving through an algorithm and as such is fractal; because price is fractal, the opening range can be calculated and projected to help determine if price is trending or consolidating. As well; this indicator can be used to incorporate his PO3 concept to enter above the weekly opening range for shorts if bearish, or entering below the opening range for longs if bullish.
This indicator takes the high and low of weekly opening range, plots those two levels, plots the opening price for the new week, and calculates the Standard Deviations of the range and plots them both above and below of the weekly opening range. These are all plotted through the week until the start of the new week.
The range is calculated by subtracting the high from the low during the specified time.
The mid-point is half of that range added to the low.
The Standard deviation is multiples of the range (up to 10) added to the high and subtracted
from the low.
At this time the indicator will only plot the Standard deviation lines on the minutes time frame below 1 hour.
Only the range and range lines will be plotted on the hourly chart.

RSI DeviationAn oscillator which de-trends the Relative Strength Index. Rather, it takes a moving average of RSI and plots it's standard deviation from the MA, similar to a Bollinger %B oscillator. This seams to highlight short term peaks and troughs, Indicating oversold and overbought conditions respectively. It is intended to be used with a Dollar Cost Averaging strategy, but may also be useful for Swing Trading, or Scalping on lower timeframes.
When the line on the oscillator line crosses back into the channel, it signals a trade opportunity.
~ Crossing into the band from the bottom, indicates the end of an oversold condition, signaling a potential reversal. This would be a BUY signal.
~ Crossing into the band from the top, indicates the end of an overbought condition, signaling a potential reversal. This would be a SELL signal.
For ease of use, I've made the oscillator highlight the main chart when Overbought/Oversold conditions are occurring, and place fractals upon reversion to the Band. These repaint as they are calculated at close. The earliest trade would occur upon open of the following day.
I have set the default St. Deviation to be 2, but in my testing I have found 1.5 to be quite reliable. By decreasing the St. Deviation you will increase trade frequency, to a point, at the expense of efficiency.
Cheers
DJSnoWMan06

SMC Community [algoat] — Smart Money ConceptsEmpower your trading with the core principles of the Smart Money Concepts through interactive features and highly customizable settings.
The indicator's strength lies in the unique SMC Core algorithm, a calculation based on real price action data, capturing every tick from small intraday fluctuations to significant high timeframe movements.
algoat SMC Core is our continually evolving, specialized structure mapping algorithm, serving as the backbone of our price action related publications.
⭐ Key Features
Swing Market Structure: Change of Character, Break of Structure
Recognize and visualize real-time market structures with swing elements. Identify and mark key structural changes in the market to visually highlight shifts in market trends and patterns. This feature is designed to alert you to significant changes in the market's behavior, signaling a potential shift from accumulation to distribution phases, or vice versa. It helps traders adapt their strategies based on evolving market dynamics.
Order Flow: Structure Fractal
Connect the successive structural high and low levels, visualizing the intricate flow of market movements. This feature highlights fractal structures within the market, enabling traders to detect significant price action patterns.
Structure Range: Determine Discount, Premium, and Equilibrium Zones
This feature provides a unique way of visualizing price areas where a security could be overbought or oversold (premium or discount zones) and where the price is expected to be fair and balanced (equilibrium zone). Distance from the current price is displayed in percentage terms, which can assist traders with crucial data for risk management and strategic planning. The Range function helps you identify the most favorable price zones for entries and set your stop-loss and take-profit levels more accurately.
Liquidity Grabs: Reveal Hidden Manipulation Attempts
Identify uncovered market areas where high liquidity trading may take place. Liquidity Grabs help track "smart money" footprints by identifying levels where large institutional traders may have induced liquidity traps. Understanding these traps can aid in avoiding false market moves and optimizing trade entries.
Institutional Interest Zones: Order Blocks and Fair Value Gaps
Uncover areas where bigger orders may be lined up. Reveal zones of interest ordered by volume strength. Receive warnings about market price imbalances.
▸ Order Blocks pinpoint crucial zones where large institutional investors ("smart money") have shown strong buying or selling interest recently. These blocks can serve as a tool for identifying key areas for potential trade entries or exits.
▸ Fair Value Gaps detect discrepancies between the perceived market value and the actual market price, revealing potential areas for price correction. With its mitigation settings, you can fine-tune the FVG detection according to the magnitude of value misalignment you consider significant.
Mitigation types dictate how price interacts with a zone, with order blocks requiring a close through (indicating stronger price movement) and fair value gaps requiring a wick through (hinting at weak rejection).
══════════════════
⭐ Why SMC?
In the ever-evolving trading landscape, mainstream methods and strategies can quickly become outdated as they are widely adopted. Liquidity is constantly sought after, and the best source for this is exploring and exploiting trading strategies that are widely accepted and applied. Currently, one of these strategies is the SMC (Supply, Demand, and Price Action).
It's no coincidence that our educational materials incorporate concepts such as liquidity grabs (LG) and Smart Money Traps (SMT). As the application of SMC gains popularity among retail traders, trading with this approach becomes more challenging. Therefore, the recent focus has been on reforming the SMC methodology, as it is the only method that relies on real price movements and will always work when applied correctly.
The indicator reflects our personal use and deep comprehension of Smart Money Concepts. It provides streamlined tools for tracking algorithmic trends with modern visualizations, without unnecessary clutter.
▸ What does the proper application of SMC entail?
Many SMC traders associate their key areas of interest with the market structure, which is generally considered acceptable. However, depending solely on a single foundation can lead to significant deviations, which may cause notable impacts on trading results. Moreover, if the basis for the market structure calculation is inaccurate, the consequences can be even more severe. It's akin to risking money on a lottery ticket, believing it will be a winner.
Our methodology is different, and it may ensure longevity in the financial markets. The structure remains crucial, but it is not the sole foundation of everything; instead, it serves as a validation tool. Each calculation, such as order blocks (OB), Fair Value Gaps (FVG), liquidity grabs (LG), range analysis, and more, is independent and unique, separate from the structure. However, validation must ultimately come from the structure itself.
We employ individual and high-quality filters: before a function calculation is validated by the structure, it must undergo rigorous testing based on its own set of validation conditions. This approach aims to enhance robustness and accuracy, providing traders with a reliable framework for making informed trading decisions.
▸ An example of structure validation: Order Block with "Swing Sensitivity"
These order blocks will only be displayed and utilized by the script if there is a swing structure validation with a valid break. In other words, the presence of a confirmed swing Change of Character (ChoCh) or Break of Structure (BoS) is essential for the Order Block to be considered valid and relevant.
This approach ensures that the order blocks are aligned with the overall market structure and are not based on isolated or unreliable price movements. Whether it's Fair Value Gaps (FVG), Liquidity Grabs (LG), Range calculations, or other functionalities, the same underlying principle holds true. The background structure calculation serves as a validation mechanism for the data and insights generated by these functions, ensuring they adhere to the specific criteria and rules established within our methodology. By incorporating this robust validation process, traders can have confidence in the reliability and accuracy of the information provided by the indicator, allowing them to make informed trading decisions based on validated data and analysis.
══════════════════
👉 Usage - the general approach
Determine your trading style and build your basic strategy:
The indicator helps you understand your trading style, whether it's swing trading, scalping or another approach. By analyzing the SMC indicator, you gain valuable information about potential market trends, entry and exit points, and overall market sentiment.
Steps:
Identify Trading Style: Determine whether you are a swing trader, scalper, or long-term investor. This will influence how you use the indicator.
Analyze Market Trends: Use the SMC indicator to observe market trends and identify potential entry and exit points.
Adapt Strategies: Adjust your strategies based on the market dynamics revealed by the SMC indicator, such as changes in order flow or market structure.
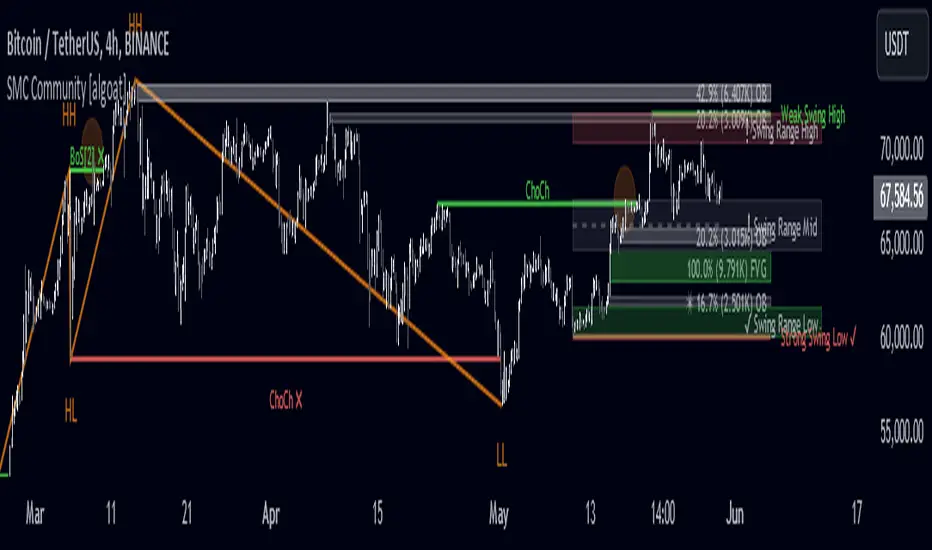
👉 Example of usage
In the following chart, you'll notice how we've utilized the indicator to formulate a strategic trading approach. We've employed Order Blocks equipped with volume parameters to identify crucial market zones. Simultaneously, we've leveraged swing/internal market structures to gain insights into potential long- and short-term market turnarounds. Lastly, we've examined trend line liquidity zones to pinpoint probable impulses and breakouts within ongoing trends.
Now we can see how the price descended to the order block with the highest volume, which we had previously marked as our point of interest for an entry. As the price closed below the median Order Block, we noted its mitigation. After an internal CHoCH, it's directing us towards the main Order Block as a target.
══════════════════
🧠 General advice
Trading effectively requires a range of techniques, experience, and expertise. From technical analysis to market fundamentals, traders must navigate multiple factors, including market sentiment and economic conditions. However, traders often find themselves overwhelmed by market noise, making it challenging to filter out distractions and make informed decisions. By integrating multiple analytical approaches, traders can tailor their strategies to fit their unique trading styles and objectives.
Confirming signals with other indicators
As with all technical indicators, it is important to confirm potential signals with other analytical tools, such as support and resistance levels, as well as indicators like RSI, MACD, and volume. This helps increase the probability of a successful trade.
Use proper risk management
When using this or any other indicator, it is crucial to have proper risk management in place. Consider implementing stop-loss levels and thoughtful position sizing.
Combining with other technical indicators
Integrate this indicator with other technical indicators to develop a comprehensive trading strategy and provide additional confirmation.
Conduct Thorough Research and Backtesting
Ensure a solid understanding of the indicator and its behavior through thorough research and backtesting before making trading decisions. Consider incorporating fundamental analysis and market sentiment into your trading approach.
══════════════════
⭐ Conclusion
We hold the view that the true path to success is the synergy between the trader and the tool, contrary to the common belief that the tool itself is the sole determinant of profitability. The actual scenario is more nuanced than such an oversimplification. A word to the wise is enough: developed by traders, for traders — pioneering innovations for the modern era.
Risk Notice
Everything provided by algoat — from scripts, tools, and articles to educational materials — is intended solely for educational and informational purposes. Past performance does not assure future returns.
SeasonsThis code represents a seasonal indicator that has a number of unique functions to help traders better understand the market and make informed decisions. Let's take a closer look at each of them:
1. **Chart background shading for each season:** This function allows you to visually see seasonal changes in the market. You'll be able to easily track how the market changes in different seasons, thanks to the color labeling: blue for winter, green for summer, orange for autumn, and yellow for spring.
2. **Vertical markings for each month:** Additional markers on the chart help you orient yourself in time and better understand price dynamics throughout the year. This is especially useful when analyzing seasonal changes and identifying market cyclicality.
3. **Halving timers:** Connecting halving timers on the chart allows you to track important events, such as the reduction of bitcoin mining rewards. Knowing the timing of halving can be a key moment for decision-making and can affect asset prices.
These functions help traders better analyze the market, identify trends and cyclicality, and optimize their trading strategy. Use this indicator in your trading practice to unleash its full potential and reach new heights in your trading career. Don't miss the opportunity to improve your results - apply the seasonal indicator today!
The seasonal indicator is a powerful tool for traders, helping them analyze the market and make informed decisions based on seasonal and cyclical changes. Here are a few reasons why using this indicator can be advantageous:
1. **Identifying seasonal trends:** The seasonal indicator helps identify seasonal trends in the market, such as changes in activity during different seasons or months. For example, some markets may be more volatile or predictable at certain times of the year, and knowing these trends can help in making decisions about entering or exiting positions.
2. **Optimizing trading strategy:** Understanding seasonal changes in the market allows traders to optimize their trading strategy based on the time of year. For example, they may adjust their risk management approaches or choose specific types of trades according to the current season.
3. **Predicting market cyclicality:** The seasonal indicator can also help in predicting market cyclicality and identifying recurring price movement patterns. This enables traders to build their strategies based on past market behavior within specific time intervals.
How to use the seasonal indicator:
1. **Study seasonal changes:** Use the indicator to analyze how the market changes throughout the year. Pay attention to changes in volatility, trading volumes, and price directions depending on the season.
2. **Optimize trading strategy:** Use the data obtained to optimize your trading strategy. Consider entering or exiting positions within specific time intervals to account for seasonal factors.
3. **Predict cyclicality:** Analyze past market behavior using the seasonal indicator to identify cyclicality and recurring patterns. This will help you make more informed decisions based on expected price movements in the future.
Ultimately, using the seasonal indicator allows traders to better understand the market, adapt their strategies, and make more informed decisions based on seasonal and cyclical changes.
All elements on the chart of a particular color will be attributed to the corresponding season. For example, trend lines or levels marked in blue will be associated with winter.
______________________________________________________
Winter
Explanation of price movement during the winter season:
1. Number 1 and the blue line denote the maximum price of Bitcoin. Note that they always form at the peaks, which is consistent.
2. Number 2 and the blue line represent the minimum price specifically during the winter period. This is indeed the minimum price and the bottom point in the cycle.
3. Number 3 and the blue line indicate a local maximum after the breakthrough, after which the price starts to rise towards line number 1, which acts as global resistance.
4. Number 4 denotes the last winter cycle before the breakthrough of the global maximum. It should be noted that in 2017, the resistance was not broken immediately - first in spring, and then at the beginning of 2018, the maximum was set, and the asset growth occurred in winter.
Additionally, it's worth noting that numbers 1 form the maximum, numbers 2 form the minimum, and since the trend is descending, I have marked its line in blue.
______________________________________________________
Summer
Now let's consider the price behavior chart for the summer. To make the situation clearer, I've left a descending trend in blue on the graph. I reiterate that the elements shown in green on the graph pertain specifically to the summer period.
1. Number 1 on the graph denotes the first summer period! The price during this period remains within a narrow range 90% of the time; however, it's worth noting that impulsive movements can occur at the beginning, middle, or end. Thus, 90% of the time the price is in a low volatility zone, while the remaining percentage is in a high volatility zone.
2. Number 2 on the graph represents the second summer period, where a pattern is observed: the price tends to rise at the beginning of the summer period and fall towards the end. Therefore, I've marked this time with an arc, and there's a pattern to it. It's worth noting that during the period of the descending trend from 2014 to 2016, the situation after the downward trend differs from the situation in 2018 and 2023, when changes in the arrangement of this situation occur after the breakout of the descending trend based on wave analysis and the price of the asset itself.
3. Number 3 represents the third summer period! During this period, the price movement direction is upward and then downward, forming a correction in the upward trend. It should be noted that in this movement, all lows gradually rise, while highs renew all previous local highs of the asset price. This period exhibits increased volatility and impulsive movements, with the asset price mostly staying within a range of minimal volatility, with volatility not exceeding 1-2% on some stretches.
4. Under number 4, the fourth summer period is indicated, which has an overall upward direction. In this period, the movement is aggressively upward. Starting from the first month until the middle of summer, the price moves downward, forming a correction in the upward trend. Then, during the next month, the price moves aggressively upward, renewing price highs. Volatility in this period is anomalously high, resembling a hot July summer.
Additionally, based on the price movement in the summer period, we can assume that fractals are evident here, which we can use to our advantage for profit.
______________________________________________________
Shark Trading - We urge all traders to delve deeper into this indicator and incorporate it into their trading practices. It can become an invaluable aid in market analysis and help traders reach new heights in their trading endeavors.
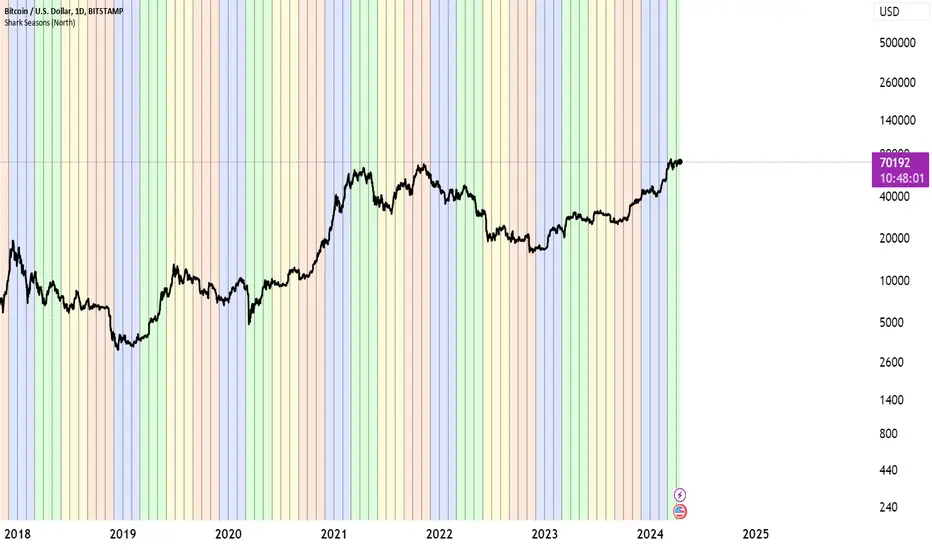
GKD-M Stepped Baseline Optimizer [Loxx]The Giga Kaleidoscope GKD-M Stepped Baseline Optimizer is a Metamorphosis module included in the "Giga Kaleidoscope Modularized Trading System."
█ Introduction
The GKD-M Stepped Baseline Optimizer is an advanced component of the Giga Kaleidoscope Modularized Trading System (GKD), designed to enhance trading strategy development by dynamically optimizing Baseline moving averages. This tool allows traders to evaluate over 65 moving averages, adjusting them across multiple periods to identify which settings yield the highest win rates for their trading strategies. The optimizer systematically tests these moving averages across specified timeframes and intervals, offering insights into net profit, total closed trades, win percentages, and other critical metrics for both long and short positions. Traders can define the initial period and incrementally adjust this value to explore a wide range of periods, thus fine-tuning their strategies with precision. What sets the GKD-M Stepped Baseline Optimizer apart is its unique capability to adapt the baseline moving average according to the highest win rates identified during backtesting, at each trading candle. This win-rate adaptive approach ensures that the trading system is always aligned with the most effective period settings for the selected moving average, enhancing the system's overall performance. Moreover, the 'stepped' aspect of this optimizer introduces a filtering process based ons, significantly reducing market noise and ensuring that identified trends are both significant and reliable. This feature is critical for traders looking to mitigate the risks associated with volatile market conditions and to capitalize on genuine market movements.In essence, the GKD-M Stepped Baseline Optimizer is tailored for traders who utilize the GKD trading system, offering a sophisticated tool to refine their baseline indicators dynamically, ensuring that their trading strategies are continuously optimized for maximum efficacy.
**the backtest data rendered to the chart above uses $5 commission per trade and 10% equity per trade with $1 million initial capital. Each backtest result for each ticker assumes these same inputs. The results are NOT cumulative, they are separate and isolated per ticker and trading side, long or short**
█ Core Features
Stepped Baseline for Noise Reduction
One of the hallmark features of the GKD-M Stepped Baseline Optimizer is its stepped baseline capability. This advanced functionality employs volatility filters to refine the selection of moving averages, significantly reducing market noise. The optimizer ensures that only substantial and reliable trends are considered, eliminating the false signals often caused by minor price fluctuations. This stepped approach to baseline optimization is critical for traders aiming to develop strategies that are both resilient and responsive to genuine market movements.
Dynamic Win Rate Adaptive Capability
Another cornerstone feature is the optimizer’s dynamic win rate adaptive capability. This unique aspect allows the optimizer to adjust the moving average period settings in real-time, based on the highest win rates derived from backtesting over a predefined range. At every trading candle, the optimizer evaluates a comprehensive set of backtesting data to ascertain the optimal period settings for the moving average in use. To perform the backtesting, the trader selects an initial period input (default is 60) and a skip value that increments the initial period input up to seven times. For instance, if a skip value of 5 is chosen, the Baseline Optimizer will run the backtest for the selected moving average on periods such as 60, 65, 70, 75, and so on, up to 90. If the user selects an initial period input of 45 and a skip value of 2, the Baseline Optimizer will conduct backtests for the chosen moving average on periods like 45, 47, 49, 51, and so forth, up to 57. The GKD-M Stepped Baseline Optimizer then exports the baseline with the highest cumulative win rate per candle to any baseline-enabled GKD backtest. This ensures that the baseline indicator remains continually aligned with the most efficacious parameters, dynamically adapting to changing market conditions.
Comprehensive Moving Averages Evaluation
The optimizer’s ability to test over 65 different moving averages across multiple periods stands as a testament to its comprehensive analytical capability. Traders have the flexibility to explore a wide array of moving averages, from traditional ones like the Simple Moving Average (SMA) and Exponential Moving Average (EMA) to more complex types such as the Hull Moving Average (HMA) and Adaptive Moving Average (AMA). This extensive evaluation allows traders to pinpoint the moving average that best aligns with their trading strategy and market conditions, further enhancing the system’s adaptability and effectiveness.
Volatility Filtering and Ticker Volatility Types
Incorporating a wide range of volatility types, including the option to utilize external volatility tickers like the VIX for filtering, adds another layer of sophistication to the optimizer. This feature allows traders to calibrate their baseline according to externals, providing an additional dimension of customization. Whether using standard deviation, ATR, or external volatility indices, traders can fine-tune their strategies to be responsive to the broader market sentiment and volatility trends.
█ Key Inputs
Baseline Settings
• Baseline Source: Determines the price data (Open, High, Low, Close) used for moving average calculations.
• Baseline Period: The starting period for moving average calculation.
• Backtest Skip: Incremental steps for period adjustments in the optimization process.
• Baseline Filter Type: Selection from over 65 moving averages for baseline calculation.
Volatility and Filter Settings
• Price Filter Type & Moving Average Filter Type: Defines thement applied to the price or the moving average, enhancing filter specificity.
• Filter Options: Allows users to select the application area of the volatility filter (price, moving average, or both).
• Filter Multiplier & Period: Configures the intensity and temporal scope of the filter, fine-tuning sensitivity to market volatility.
Backtest Configuration
• Window Period: Specifies the length of the backtesting window in days.
• Backtest Type: Chooses between a fixed window or cumulative data approach for backtesting.
• Initial Capital, Order Size, & Type: Sets the financial parameters for backtesting, including starting equity and the scale of trades.
• Commission per Order: Accounts for trading costs within backtest profitability calculations.
Date and Time Range
• From/Thru Year/Month/Day: Defines the historical period for strategy testing.
• Entry Time: Specifies the time frame during which trades can be initiated, crucial for strategies sensitive to market timing.
Volatility Measurements for Goldie Locks Volatility Qualifiers
• Mean Type & Period: Chooses the moving average type and period for volatility assessment.
• Inner/Outer Volatility Qualifier Multipliers: Adjusts the boundaries for volatility-based trade qualification.
• Activate Qualifier Boundaries: Enables or disables the upper and lower volatility qualifiers.
Advanced Volatility Inputs
• Volatility Ticker Selection & Trading Days: Incorporates external volatility indices (e.g., VIX) into the strategy, adjusting for market volatility.
• Static Percent, MAD Internal Filter Period, etc.: Provides fixed or adaptive volatility thresholds for filtering.
UI Customization
• Baseline Width & Table Display Options: Customizes the visual representation of the baseline and the display of optimization results.
• Table Header/Content Color & Text Size: Enhances readability and user interface aesthetics.
Export Options
• Export Data: Selects the specific metric to be exported from the script, such as net profit or average profit per trade.
Moving Average Specific Parameters
Specific inputs tailored to the characteristics of selected moving averages (e.g., Fractal Adjusted (FRAMA), Least Squares Moving Average (LSMA), T3, etc.), allowing users to fine-tune the behavior of these averages based on unique formula requirements.
█ Indicator UI
• Long and Short Baselines: The optimizer differentiates trends through two distinct baselines: a green line for long (uptrend) baselines and a red line for short (downtrend) baselines. These baselines alternate activation based on the current trend direction as determined by the moving average plus length combination for the candle in view.
Ambiguity in market direction, when an uptrend and downtrend are concurrently indicated, is visually represented by yellow lines.
• Stepping Mechanism for Trend Visualization: Adjusting the source input and the moving average output based on volatility, the indicator exhibits a stepped appearance on the chart. This mechanism ensures that only substantial market movements, surpassing a specified volatility threshold, are recognized as trend changes.
Stepping Activated
• Goldilocks Zone: Beyond the long and short baselines, the Goldilocks zone introduces a distinct moving average that closely follows the selected price or source input, aiming to strike the perfect balance between not too much and not too little market movement for trading. The upper limit of the Goldilocks zone indicates a market stretch too far for advantageous trading (overextension), while the lower limit suggests inadequate market movement for entry (underextension). Trading within the Goldilocks zone is deemed optimal, as it signifies sufficient but not excessive volatility for entering trades, aligning with either the long or short baseline recommendations. Moreover, the mean of the Goldilocks zone serves as a critical indicator, offering a median reference point that aligns closely with the market's current state. This mean is pivotal for traders, as it represents a 'just right' condition for market entry, embodying the essence of the Goldilocks principle in financial trading strategies.
• Signal Indicators and Entry Points: The chart includes with green or red dots to signify valid price points within the Goldilocks zone, indicative of conducive trading conditions. Furthermore, small directional arrows at the chart's bottom highlight potential long or short entry points, validated by the Goldilocks zone's parameters.
• Data Table: A table presenting real-time statistics from the current candle backward through the chosen range offers insights into win rates and other relevant data, aiding in informed decision-making. This table adapts with each new candle, highlighting the most favorable win rates for both long and short positions.
█ Optimizing Strategy with Backtesting
Optimizing a trading strategy with backtesting involves rigorously testing the strategy on historical data to evaluate its performance and robustness before applying it in live markets. The GKD-M Stepped Baseline Optimizer incorporates advanced backtesting capabilities, offering both cumulative and rolling window types of backtests. Here's how each backtest type operates and the insights they provide for refining trading strategies:
Cumulative Backtest
• Overview: A cumulative backtest evaluates a strategy's performance over a continuous period without resetting the strategy parameters or the simulated trading capital at the beginning of each new period.
• Utility: This type is useful for understanding a strategy's long-term viability, assessing how it adapts to different market conditions over an extended timeframe.
• Interpreting Statistics: Cumulative backtest results often focus on overall return, drawdowns, win rate, and the Sharpe ratio. A strategy with consistent returns, manageable drawdowns, a high win rate, and a favorable Sharpe ratio is considered robust.
Rolling Window Backtest
• Overview: Unlike the cumulative approach, a rolling window backtest divides the historical data into smaller, overlapping or non-overlapping periods (windows), running the strategy separately on each. After each window, the strategy parameters and simulated trading capital are reset.
• Utility: This method is invaluable for assessing a strategy's consistency and adaptability to various market phases. It helps identify if the strategy's performance is dependent on specific market conditions.
• Interpreting Statistics: For rolling window backtests, consistency is key. Look for similar performance metrics (returns, drawdowns, win rate) across different windows. Variability in performance indicates sensitivity to market conditions, suggesting the need for strategy adjustments.
Strategy Refinement Through Backtest Statistics
• Net Profit and Loss: Measures the strategy’s overall effectiveness. Consistent profitability across different market conditions is a positive indicator.
• Win Rate and Profit Factor: High win rates and profit factors indicate a strategy's efficiency in capturing gains over losses.
• Average Profit per Trade: Understanding the strategy's ability to generate profit on a per-trade basis can highlight its operational efficiency.
• Average Number of Bars in Trade: This metric helps understand the strategy's market exposure and timing efficiency.
█ Exporting Data and Integration with GKD Backtests
The GKD-M Stepped Baseline Optimizer seamlessly integrates with the broader GKD trading system, allowing traders to export the optimization data and leverage it within the various GKD backtest modules. This feature allows users to forward the GKD-M Stepped Baseline Optimizer adaptive signals to a GKD backtest to be used as a Baseline component in a GKD trading system.
█ Moving Averages included in the Stepped Baseline Optimizer
The GKD-M Stepped Baseline Optimizer incorporates an extensive array of over 65 moving averages, each with unique characteristics and implications for trading strategy development. This comprehensive suite enables traders to conduct nuanced analysis and optimization, ensuring the selection of the most effective moving average for Baseline input into their GKD trading system.
Adaptive Moving Average - AMA
ADXvma - Average Directional Volatility Moving Average
Ahrens Moving Average
Alexander Moving Average - ALXMA
Coral
Deviation Scaled Moving Average - DSMA
Donchian
Double Exponential Moving Average - DEMA
Double Smoothed Exponential Moving Average - DSEMA
Double Smoothed FEMA - DSFEMA
Double Smoothed Range Weighted EMA - DSRWEMA
Double Smoothed Wilders EMA - DSWEMA
Double Weighted Moving Average - DWMA
Ehlers Optimal Tracking Filter - EOTF
Exponential Moving Average - EMA
Fast Exponential Moving Average - FEMA
Fractal Adaptive Moving Average - FRAMA
Generalized DEMA - GDEMA
Generalized Double DEMA - GDDEMA
Geometric Mean Moving Average
Hull Moving Average (Type 1) - HMA1
Hull Moving Average (Type 2) - HMA2
Hull Moving Average (Type 3) - HMA3
Hull Moving Average (Type 4) - HMA4
IE/2 - Early T3 by Tim Tilson
Integral of Linear Regression Slope - ILRS
Instantaneous Trendline
Kalman Filter
Kaufman Adaptive Moving Average - KAMA
Laguerre Filter
Leader Exponential Moving Average
Linear Regression Value - LSMA (Least Squares Moving Average)
Linear Weighted Moving Average - LWMA
McGinley Dynamic
McNicholl EMA
Non-Lag Moving Average
Ocean NMA Moving Average - ONMAMA
One More Moving Average - OMA
Parabolic Weighted Moving Average
Probability Density Function Moving Average - PDFMA
Quadratic Regression Moving Average - QRMA
Range Filter
Range Weighted EMA - RWEMA
Recursive Moving Trendline
Regularized EMA - REMA
Simple Decycler - SDEC
Simple Loxx Moving Average - SLMA
Simple Moving Average - SMA
Sine Weighted Moving Average
Smoothed LWMA - SLWMA
Smoothed Moving Average - SMMA
Smoother
Super Smoother
T3
Tether Lines
Three-pole Ehlers Butterworth
Three-pole Ehlers Smoother
Triangular Moving Average - TMA
Triangle Moving Average Generalized
Triple Exponential Moving Average - TEMA
Two-pole Ehlers Butterworth
Two-pole Ehlers smoother
Ultimate Smoother
Variable Index Dynamic Average - VIDYA
Variable Moving Average - VMA
Volume Weighted EMA - VEMA
Volume Weighted Moving Average - VWMA
Zero-Lag DEMA - Zero Lag Double Exponential Moving Average
Zero-Lag Moving Average
Zero Lag TEMA - Zero Lag Triple Exponential Moving Average
█ Volatility Types and Filtering
The GKD-M Stepped Baseline Optimizer features a comprehensive selection of over 15 volatility types, each tailored to capture different aspects of market behavior and risk.
Volatility Ticker Selection: Enables direct incorporation of external volatility indicators like VIX and EUVIX into the script for market sentiment analysis, signal filtering enhancement, and real-time risk management adjustments.
Standard Deviation of Logarithmic Returns: Quantifies asset volatility using the standard deviation applied to logarithmic returns, capturing symmetric price movements and financial returns' compound nature.
Exponential Weighted Moving Average (EWMA) for Volatility: Focuses on recent market information by applying exponentially decreasing weights to squared logarithmic returns, offering a dynamic view of market volatility.
Roger-Satchell Volatility Measure: Estimates asset volatility by analyzing the high, low, open, and close prices, providing a nuanced view of intraday volatility and market dynamics.
Close-to-Close Volatility Measure: Calculates volatility based on the closing prices of stocks, offering a streamlined but limited perspective on market behavior.
Parkinson Volatility Measure: Enhances volatility estimation by including high and low prices of the trading day, capturing a more accurate reflection of intraday market movements.
Garman-Klass Volatility Measure: Incorporates open, high, low, and close prices for a comprehensive daily volatility measure, capturing significant price movements and market activity.
Yang-Zhang Volatility Measure: Offers an efficient estimation of stock market volatility by combining overnight and intraday price movements, capturing opening jumps and overall market dynamics.
Garman-Klass-Yang-Zhang Volatility Measure: Merges the benefits of Garman-Klass and Yang-Zhang measures, providing a fuller picture of market volatility including opening market reactions.
Pseudo GARCH(2,2) Volatility Model: Mimics a GARCH(2,2) process using exponential moving averages of squared returns, highlighting volatility shocks and their future impact.
ER-Adaptive Average True Range (ATR): Adjusts the ATR period length based on market efficiency, offering a volatility measure that adapts to changing market conditions.
Adaptive Deviation: Dynamically adjusts its calculation period to offer a nuanced measure of volatility that responds to the market's intrinsic rhythms.
Median Absolute Deviation (MAD): Provides a robust measure of statistical variability, focusing on deviations from the median price, offering resilience against outliers.
Mean Absolute Deviation (MAD): Measures the average magnitude of deviations from the mean price, facilitating a straightforward understanding of volatility.
ATR (Average True Range): Finds the average of true ranges over a specified period, indicating the expected price movement and market volatility.
True Range Double (TRD): Offers a nuanced view of volatility by considering a broader range of price movements, identifying significant market sentiment shifts.

Market Structure (Range) & Internal Liquidity
This indicator will simplify the price-action reading of any trader/investor by decluttering his/her charts from un-important & confusing candles to highlight the true momentum candles which are usually formed by institutional buying/selling .
The indicator will be a good tool in the arsenal of the following styles of Trading/Investing
Smart Money / Liquidity Concepts
Price Action Concepts
Demand & Supply Concepts
Support & Resistance Concepts
UNIQUE FEATURES:
1. Market Structure - Range & Internal Liquidity:
Unlike other liquidity indicators, this indicator only highlights liquidity levels of significant importance. Not every intermediate high & low in a chart are worthy of noticing, hence by enabling the 'Swings' & 'Range (BoS)' feature in the indicator settings, the structure highs and lows (external liquidity) in a chart can be identified.
Any other liquidity levels within a market range (Range between structural High & Low) is known as internal liquidity which price targets to collect enough orders before heading towards the external liquidity levels.
2. Gaps (Fair Value Gaps / Imbalance):
Not every imbalance / gap between candles are important & trade-worthy. This feature of the indicator is different from the other widely available imbalance indicators & only highlights gaps formed by true momentum candles. Gaps between unimportant inside bars are not highlighted, as these bars occur in the absence of momentum.
3. True Price Action:
Looking at the two charts below, we can clearly observe the difference between price action of a confusing normal chart & the simplified price action highlighted by the indicator. This feature declutters the charts by only highlighting the candles a trader / investor should notice in a chart.
This feature when used in confluence with the liquidity levels feature & gap feature of the indicator, helps identify the true demand & supply zones (order blocks) in a chart.
Before
After
4. Zig Zag Lines:
This unique feature which is useful to Identify & Backtest different entry types taught by Smart Money Traders . This feature helps the trader understand the True Fractal Nature of price. This can also be seen as an alternate to the default line chart feature.
Examples of Entry Types taken by Smart Money Traders
ADDITIONAL FEATURES:
(These features are essential addons to trade liquidity. However, these are derived from publicly available indicators from the Tradingview library, but with a different interpretation for a better visualization of charts & or to time better trade entries without cluttering the charts)
a. Inside Bar & Outside Bars:
Identify not just a single Inside Bar as highlighted by other indicators, but to highlight a series of candles which are within a master candle range and are exhibiting unimportant sideways price action.
Outside Bars only relevant to momentum candles are highlighted, ignoring candles that occur within a master candle range. Highs & Lows of such Outside Bars are used by aggressive traders to identify liquidity levels in the charts.
b. Highs & Lows of previous Monthly / Weekly / Daily & Hourly Candles:
This feature draws Highs & Lows of previous Monthly / Weekly / Daily & Hourly Candles on the extreme right hand side of the chart to keep the charts clean.
Additionally for Hourly time frame, the indicator includes a setting to select the hourly candle time frame (60 min / 75 min / 240 min), which are personal and different for each trader.
UNDERLYING CONCEPT:
In the image below we see how a large majority of Traders / Investors incorrectly mark Structure markings, mistaking a raid of internal liquidity as a Break of Structure, thereby taking trades opposite to the broader trend of the markets
However, this indicator has a higher accuracy of identifying the correct price structure by only marking a structure high or low, when a subsequently opposite side liquidity is taken/raided. Further the broader trend of the markets can be easily identified by looking as to which side the Break of Structure has happened. (This is visible in the indicator in the form of 'Range' feature, so if a Range High is broken then it is understood to be in an uptrend & vice versa)
The underlying core functionality of the indicator is best displayed by the image below
USECASE OF THE INDICATOR:
Before taking any Buying/Selling position in the markets, a Trader / Investor must analyze the price action on the following parameters
HTF & LTF Trend Identification (To judge if trade is Pro-Trend or Counter-Trend)
Is Price at a High Probability Area of Interest?
Is Price satisfying the trade entry conditions?
Let us see how this indicator can be used as a complete trading system in itself and addresses each of the above parameters
Disclaimer: Illustrations shown below are just for understanding the features of the indicator & does not guarantee profitability. Every trader must back test their setups to arrive at a setup with an edge (positive expectancy) before they start actively trading the setup.
1. HTF & LTF Trend Identification (Pro-Trend / Counter-Trend) using 'Range (BoS)' feature of the indicator
Let's assume a Day Trader, uses hourly chart (75 min) to frame his Higher Time Frame (HTF) ideas & 15min charts (LTF) for trade entries
Looking at the chart below the Trader concludes that the HTF has most recently broken the structure to the downside and is considered Bearish till price action is below the range high of 48600 levels. It can also be concluded that the price is currently in a Bullish retracement.
The Trader can choose to take both Pro-Trend or Counter-Trend Trades, timing the trade entries using the LTF charts.
Looking at the LTF chart below, it is evident that price on LTF has also broken structure to the downside and is now aligned with the HTF Bearish Trend. The Trader will now look to get into short trades, to take trades both in line with HTF & LTF trend.
2. Let's identify if Price is at a High Probability Area of Interest, using either single or combination of the 'Swings' / 'Gaps' / 'Outside Bars' / 'HL of previous M,W,D, H candles' features of the indicator
Definition of High Probability Level / Area differs from each Traders perspective depending upon which of the Trading Styles (mentioned in the beginning) does one use.
Smart Money Traders
SMC Traders are known to get into trades early and their high R:R trades are taken mostly at a High Probability Area of Interest which are identified by them on HTF, by looking for candles with imbalance (gaps) & or candles which have taken out a previous liquidity and then having creating imbalance (gaps).
Also Turtle Soups is one of the favorite setups for SMC traders, where a trader enters a trade on LTF (typically 1 min/3min & 5min) after grabbing HTF liquidity lying at H/L of outside bar / previous monthly, weekly, daily or hourly candles.
Demand & Supply Traders
Some of the Best Demand & Supply Traders have the patience to wait for trades and take trades at the extreme Demand & Supply Zones within a market Range.
As illustrated below, the extreme hourly supply zone just below the structure high, which has the confluence of imbalance and Bearish HTF confirmation resulted in a good R:R trade.
Price Action Traders & Support & Resistance Traders
From the illustration below we can see how the 15 min Range breakdown confirms the breakdown of the Inverted Cup Pattern for Price Action Traders & Support & Resistance Traders using the same area of breakdown as the new Resistance to enter Short trades
3. Let's identify if Price is satisfying the Trade Entry Conditions using the 'Zig-Zag Lines' feature
Statistics say that majority (> 80%) of Traders blow up their accounts multiple times or completely give up and never achieve profitability.
One of the primary reasons for this is Traders punching trades randomly and without having proper Setup or rules for entering Trades.
Also in order to arrive at rules or execute the different entry models (couple of examples highlighted earlier) taught by different Trainers, a Trader needs to learn to visualize charts in a similar format to what the trainers are teaching.
The Zig-Zag lines feature is a form of line chart that joins the swing high points to the swing low points on the chart to represent the True Price action & a proper fractal nature of the markets, unlike the line chart which is formed by only by joining the closing value of each candle.
From the image below we can see that the Zig-Zag lines feature eliminates the randomness visible in the line chart and is a more smoother chart. Using this feature one can back test the various entry models widely available on the internet or arrive at a user specific model which he/she is comfortable with.
CONCLUSION:
Trading with a deeper understanding of Price Action allows a Trader/Investor to enter or exit trades with ease. Price Action trading allows individuals to keep their charts clean and stay away from the other lagging technical indicators and enter trades much earlier than other technical indicators.
This indicator attempts in simplifying the understanding of price action for every one and identify potential high probability areas / levels where one should enter / exit trades.
This indicator will be an important tool in the arsenal of any Trader / Investor to take better informed trades, however it does not guarantee profitability of a Trader, due to the randomness of the markets & external factors that influence each trader.
GET ACCESS:
Refer Author's instructions below to get access to the indicator

itradesize /\ IPDA Look Back - for any timeframeThe script automatically calculates the 20-40-60 look-back periods and their premium and discount ranges.
The base concept is from ICT’s IPDA which should be applied to the daily timeframe but now you can use that same concept on the lower timeframes .
The higher the timeframes you use the more reliable it will be ( when we are talking about lower timeframes than Daily ).
- With the use of the indicator you can apply it on any timeframe with ease.
- You can customize the coloring of premium & discount, frame lines, and even the look of it.
- Hide or show the EQ levels
Below the IPDA texts the indicator shows the actual percentage of the selected range based on the current price fluctuations.
The script handles the 20-40-60 days look-back as fractals so it can be applied on lower timeframes.
The basics:
- The Interbank Price Delivery Algorithm (IPDA): The algorithm creates a shift on the daily chart every 20, 40, and 60 trading days.
- These are the IPDA look-back periods. Every 20 trading days or so there is a new liquidity pool forming on both sides of the market based on ICT concepts.
- Determine the IPDA Data Range of the land 20 trading days.
- Note the highest high & lowest low in the past 20 trading days. Identify the institutional order flow and mark the relevant PD arrays in the selected IPDA look-back period we deemed useful for our trading style.
- This is your current dealing range.
- If the price consolidates for 20 days, consider switching to a 40-day look back.
Inside this dealing range, we look for the next draw on liquidity. Is it reaching for a liquidity pool or is it looking to rebalance at a particular PD Array. This is going to the Bias.
Which IPDA data range should you use?
IPDA20 can be our Short Term range - fit for intraday traders at most
IPDA40 can be our Swing Trade range - have a clear indication of the market profile
IPDA60 can be our range for position trading - have a clear indication of the market profile

[AIO] Multi Collection Moving Averages 140 MA TypesAll In One Multi Collection Moving Averages.
Since signing up 2 years ago, I have been collecting various Сollections.
I decided to get it into a decent shape and make it one of the biggest collections on TV, and maybe the entire internet.
And now I'm sharing my collection with you.
140 Different Types of Moving Averages are waiting for you.
Specifically :
"
AARMA | Adaptive Autonomous Recursive Moving Average
ADMA | Adjusted Moving Average
ADXMA | Average Directional Moving Average
ADXVMA | Average Directional Volatility Moving Average
AHMA | Ahrens Moving Average
ALF | Ehler Adaptive Laguerre Filter
ALMA | Arnaud Legoux Moving Average
ALSMA | Adaptive Least Squares
ALXMA | Alexander Moving Average
AMA | Adaptive Moving Average
ARI | Unknown
ARSI | Adaptive RSI Moving Average
AUF | Auto Filter
AUTL | Auto-Line
BAMA | Bryant Adaptive Moving Average
BFMA | Blackman Filter Moving Average
CMA | Corrected Moving Average
CORMA | Correlation Moving Average
COVEMA | Coefficient of Variation Weighted Exponential Moving Average
COVNA | Coefficient of Variation Weighted Moving Average
CTI | Coral Trend Indicator
DEC | Ehlers Simple Decycler
DEMA | Double EMA Moving Average
DEVS | Ehlers - Deviation Scaled Moving Average
DONEMA | Donchian Extremum Moving Average
DONMA | Donchian Moving Average
DSEMA | Double Smoothed Exponential Moving Average
DSWF | Damped Sine Wave Weighted Filter
DWMA | Double Weighted Moving Average
E2PBF | Ehlers 2-Pole Butterworth Filter
E2SSF | Ehlers 2-Pole Super Smoother Filter
E3PBF | Ehlers 3-Pole Butterworth Filter
E3SSF | Ehlers 3-Pole Super Smoother Filter
EDMA | Exponentially Deviating Moving Average (MZ EDMA)
EDSMA | Ehlers Dynamic Smoothed Moving Average
EEO | Ehlers Modified Elliptic Filter Optimum
EFRAMA | Ehlers Modified Fractal Adaptive Moving Average
EHMA | Exponential Hull Moving Average
EIT | Ehlers Instantaneous Trendline
ELF | Ehler Laguerre filter
EMA | Exponential Moving Average
EMARSI | EMARSI
EPF | Edge Preserving Filter
EPMA | End Point Moving Average
EREA | Ehlers Reverse Exponential Moving Average
ESSF | Ehlers Super Smoother Filter 2-pole
ETMA | Exponential Triangular Moving Average
EVMA | Elastic Volume Weighted Moving Average
FAMA | Following Adaptive Moving Average
FEMA | Fast Exponential Moving Average
FIBWMA | Fibonacci Weighted Moving Average
FLSMA | Fisher Least Squares Moving Average
FRAMA | Ehlers - Fractal Adaptive Moving Average
FX | Fibonacci X Level
GAUS | Ehlers - Gaussian Filter
GHL | Gann High Low
GMA | Gaussian Moving Average
GMMA | Geometric Mean Moving Average
HCF | Hybrid Convolution Filter
HEMA | Holt Exponential Moving Average
HKAMA | Hilbert based Kaufman Adaptive Moving Average
HMA | Harmonic Moving Average
HSMA | Hirashima Sugita Moving Average
HULL | Hull Moving Average
HULLT | Hull Triple Moving Average
HWMA | Henderson Weighted Moving Average
IE2 | Early T3 by Tim Tilson
IIRF | Infinite Impulse Response Filter
ILRS | Integral of Linear Regression Slope
JMA | Jurik Moving Average
KA | Unknown
KAMA | Kaufman Adaptive Moving Average & Apirine Adaptive MA
KIJUN | KIJUN
KIJUN2 | Kijun v2
LAG | Ehlers - Laguerre Filter
LCLSMA | 1LC-LSMA (1 line code lsma with 3 functions)
LEMA | Leader Exponential Moving Average
LLMA | Low-Lag Moving Average
LMA | Leo Moving Average
LP | Unknown
LRL | Linear Regression Line
LSMA | Least Squares Moving Average / Linear Regression Curve
LTB | Unknown
LWMA | Linear Weighted Moving Average
MAMA | MAMA - MESA Adaptive Moving Average
MAVW | Mavilim Weighted Moving Average
MCGD | McGinley Dynamic Moving Average
MF | Modular Filter
MID | Median Moving Average / Percentile Nearest Rank
MNMA | McNicholl Moving Average
MTMA | Unknown
MVSMA | Minimum Variance SMA
NLMA | Non-lag Moving Average
NWMA | Dürschner 3rd Generation Moving Average (New WMA)
PKF | Parametric Kalman Filter
PWMA | Parabolic Weighted Moving Average
QEMA | Quadruple Exponential Moving Average
QMA | Quick Moving Average
REMA | Regularized Exponential Moving Average
REPMA | Repulsion Moving Average
RGEMA | Range Exponential Moving Average
RMA | Welles Wilders Smoothing Moving Average
RMF | Recursive Median Filter
RMTA | Recursive Moving Trend Average
RSMA | Relative Strength Moving Average - based on RSI
RSRMA | Right Sided Ricker MA
RWMA | Regressively Weighted Moving Average
SAMA | Slope Adaptive Moving Average
SFMA | Smoother Filter Moving Average
SMA | Simple Moving Average
SSB | Senkou Span B
SSF | Ehlers - Super Smoother Filter P2
SSMA | Super Smooth Moving Average
STMA | Unknown
SWMA | Self-Weighted Moving Average
SW_MA | Sine-Weighted Moving Average
TEMA | Triple Exponential Moving Average
THMA | Triple Exponential Hull Moving Average
TL | Unknown
TMA | Triangular Moving Average
TPBF | Three-pole Ehlers Butterworth
TRAMA | Trend Regularity Adaptive Moving Average
TSF | True Strength Force
TT3 | Tilson (3rd Degree) Moving Average
VAMA | Volatility Adjusted Moving Average
VAMAF | Volume Adjusted Moving Average Function
VAR | Vector Autoregression Moving Average
VBMA | Variable Moving Average
VHMA | Vertical Horizontal Moving Average
VIDYA | Variable Index Dynamic Average
VMA | Volume Moving Average
VSO | Unknown
VWMA | Volume Weighted Moving Average
WCD | Unknown
WMA | Weighted Moving Average
XEMA | Optimized Exponential Moving Average
ZEMA | Zero Lag Moving Average
ZLDEMA | Zero-Lag Double Exponential Moving Average
ZLEMA | Ehlers - Zero Lag Exponential Moving Average
ZLTEMA | Zero-Lag Triple Exponential Moving Average
ZSMA | Zero-Lag Simple Moving Average
"
Don't forget that you can use any Moving Average not only for the chart but also for any of your indicators without affecting the code as in my example.
But remember that some MAs are not designed to work with anything other than a chart.
All MA and Code lists are sorted strictly alphabetically by short name (A-Z).
Each MA has its own number (ID) by which you can display the Moving Average you need.
Next to the ID selection there are tooltips with short names and their numbers. Use them.
The panel below will help you to read the Name of the selected MA.
Because of the size of the collection I think this is the optimal and most convenient use. Correct me if this is not the case.
Unknown - Some MAs I collected so long ago that I lost the full real name and couldn't find the authors. If you recognize them, please let me know.
I have deliberately simplified all MAs to input just Source and Length.
Because the collection is so large, it would be quite inconvenient and difficult to customize all MA functions (multipliers, offset, etc.).
If you need or like any MA you will still have to take it from my collection for your code.
I tried to leave the basic MA settings inside function in first strings.
I have tried to list most of the authors, but since the bulk of the collection was created a long time ago and was not intended for public publication I could not find all of them.
Some of the features were created from scratch or may have been slightly modified, so please be careful.
If you would like to improve this collection, please write to me in PM.
Also Credits, Likes, Awards, Loves and Thanks to :
@alexgrover
@allanster
@andre_007
@auroagwei
@blackcat1402
@bsharpe
@cheatcountry
@CrackingCryptocurrency
@Duyck
@ErwinBeckers
@everget
@glaz
@gotbeatz26107
@HPotter
@io72signals
@JacobAmos
@JoshuaMcGowan
@KivancOzbilgic
@LazyBear
@loxx
@LuxAlgo
@MightyZinger
@nemozny
@NGBaltic
@peacefulLizard50262
@RicardoSantos
@StalexBot
@ThiagoSchmitz
@TradingView
— 𝐀𝐧𝐝 𝐎𝐭𝐡𝐞𝐫𝐬 !
So just a Big Thank You to everyone who has ever and anywhere shared their codes.
