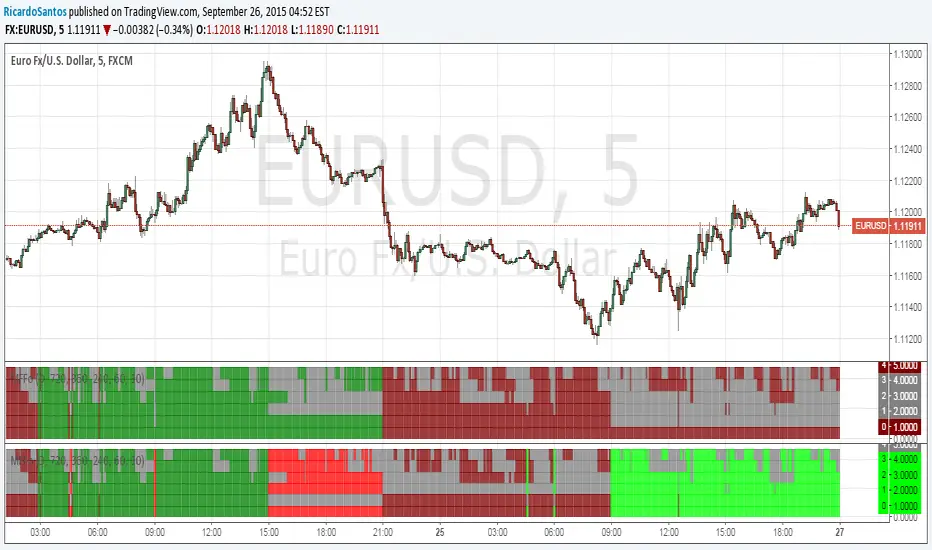
Elliott strategyIt uses Elliott teory to shift two moving averages 8 positions (based on 5-3 fractal), and the crossing is close to reversions. And it keeps an eye on RSI level to be sure it is on hot level to sell/buy
ابحث في النصوص البرمجية عن "Fractal"

CHOP_LRSI_V1RSI in Laguerre Time with Embedded Fractal Energy
Includes all features of the CHOP_LRSI indicator
Added possibility to select 5x or 25x factor for HTF
All advanced features deactivated by default
Added LRSI crossover/crossunder alert conditions

Retention-Acceleration FilterAnother Adaptive Filter
This indicator share the same structure as a classic adaptive filter using an exponential window with a smoothing constant.
However the smoothing constant used is different than any previously made (Kalman Gain, Efficiency ratio, Scaled Fractal Dimension Index) ,
here the smoothing constant is inspired by the different formulations for parameters resolution used in HPLC S. Said (J. High Resolution Chromatograpy &Chromatography Communciations, (1979) 193).
Different assumptions can be made which lead to different expressions for resolution in chromatographic parameters, therefore we will use highest's and lowest's in order to estimate an optimal smoothing constant based on if the market is trending or not. It can be complicated at first but the goal is to provide both smoothness at the right time and a fast estimation of the market center.
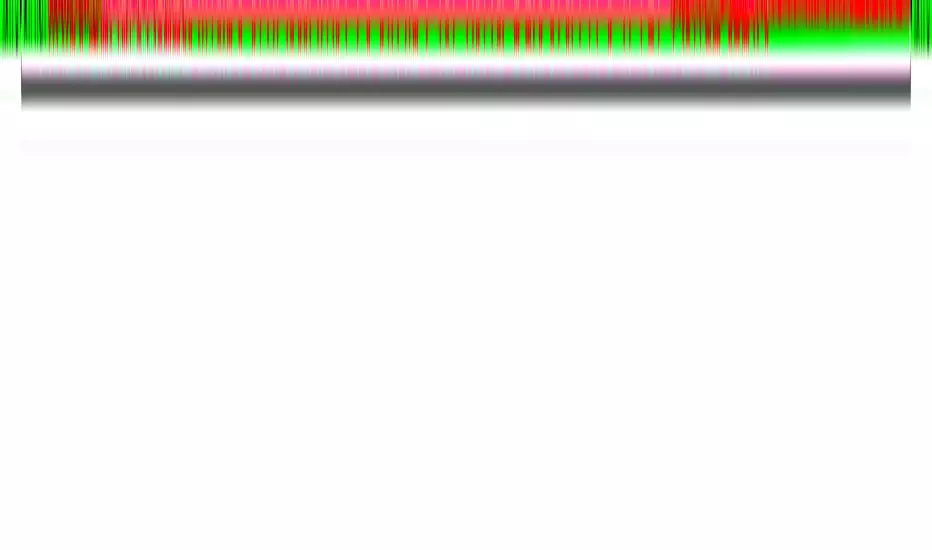
Handling Noise
In Red a Pure Sinewave. In White Sinewave + Noise. In Blue our filter of Period 3
Handling stationary signals is not the best thing to do since we need highest's and lowest's and for that non stationary signals with trend + cycle + noise are more suitable.
It is also possible to make it act faster by quiting the pow() function of AltK with sqrt(length) and smoothing the remaining constant.

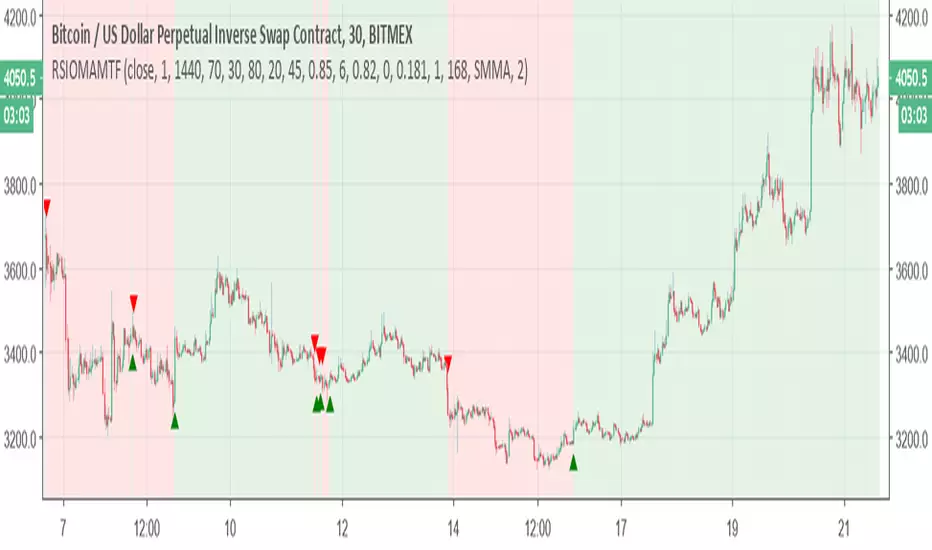
Relative Strength Index of Moving Average MTF alertsAll credit to this study is for chris jhoncic , this is MTF version with alert of his study
basic idea is hybrid of RSI and different MA
You can choose which MA from the following list:
Tillson Moving Average (T3)
Double Exponential Moving Average ( DEMA )
Arnaud Legoux Moving Average ( ALMA )
Least Squares Moving Average ( LSMA )
Simple Moving Average ( SMA )
Exponential Moving Average ( EMA )
Weighted Moving Average ( WMA )
Smoothed Moving Average ( SMMA )
Triple Exponential Moving Average ( TEMA )
Hull Moving Average ( HMA )
Adaptive moving average (AMA)
Fractal Adaptive Moving Average (FAMA)
Variable Index Dynamic Average ( VIDYA )
Triangular Moving Average (TRIMA)
to change the time frame change int2 to what you desire
Adaptive Least SquaresAn adaptive filtering technique allowing permanent re-evaluation of the filter parameters according to price volatility. The construction of this filter is based on the formula of moving ordinary least squares or lsma , the period parameter is estimated by dividing the true range with its highest. The filter will react faster during high volatility periods and slower during low volatility ones.
High smooth parameter will create smoother results, values inferior to 3 are recommended.
You can easily replace the parameter estimation method as long as the one used fluctuate in a range of , for example you can use the efficiency ratio
ER = abs(change(close,length))/sum(abs(change(close)),length)
Or the Fractal Dimension Index , in fact any values will work as long as they are rescaled (stoch(value,value,value,length)/100)
For any suggestions/questions feel free to send me a message :)


Relative Strength Index of Moving AveragePine script version 3
Author CryptoJoncis
RSIOMA is the abbreviation for Relative Strength index (RSI) of moving averages (MA). This custom built indicator is based on calculating the relative strength of two moving averages and the smoothes out the RSI using a moving average. Combined, the RSIOMA oscillator depicts trend changes in prices relative to the time frame. The RSIOMA can be used as a signal generator by itself. (www.ProfitF.com)
There are some minor things which you can use to modify this version of RSIOMA:
Choose 2 levels of Over Sold and Over Bought for RSI
Set the middle level to easier visualize the trend
Set x% wider MA line to avoid too many fake signals and gain higher precision
You can choose which MA would you like to use from the following list:
Tillson Moving Average (T3)
Double Exponential Moving Average ( DEMA )
Arnaud Legoux Moving Average ( ALMA )
Least Squares Moving Average ( LSMA )
Simple Moving Average ( SMA )
Exponential Moving Average ( EMA )
Weighted Moving Average ( WMA )
Smoothed Moving Average ( SMMA )
Triple Exponential Moving Average ( TEMA )
Hull Moving Average ( HMA )
Adaptive moving average (AMA)
Fractal Adaptive Moving Average (FAMA)
Variable Index Dynamic Average ( VIDYA )
Triangular Moving Average (TRIMA)
Any questions/suggestions/errors or spelling mistakes? Please leave a comment and let me know.
You can use,publish,modify this code in any way as you wish, but only if you reference me after.
You are not allowed to sell it as it is.
If this code is useful to you, then consider to buy me a coffee 2.17% (or better a pint of beer) by donating Bitcoin 0.64% or Etherium to:
BTC: 3FiBnveHo3YW6DSiPEmoCFCyCnsrWS3JBR
ETH: 0xac290B4A721f5ef75b0971F1102e01E1942A4578
References:
www.profitf.com

All Moving averagesI have added an option to turn on or off any Moving average by choice and if needed, Heikin-ashi used as source (instead of close)
List of Moving Averages which you can use
T3 - Tillson Moving Average
DEMA - Double Exponential Moving Average
ALMA - Arnaud Legoux moving average
LSMA - Least Squares Moving Average
MA - Simple Moving Average
EMA - Exponential Moving Average
WMA - Weighted Moving Average
SMMA -The Smoothed Moving Average
TEMA - triple exponential moving average
HMA - The Hull Moving Average
AMA - Adaptive Moving Average
FAMA - Fractal Adaptive Moving Average
VIDYA - Variable Index Dynamic Average
TRIMA - Triangular Moving Average
Consider a tip in ETH to
0xac290B4A721f5ef75b0971F1102e01E1942A4578
Thank you and have a nice day
CryptoJoncis
BAHbO - multi indicators and signals SMA,BB,RSI,Engulfing,Signal4 SMAs - 9,21,55,200
Bollinger Bands - 21
Engulfing patterns
Fractal Support Resistance
Bullish and Bearish Engulfing signals
Engulfing Candles
Bollinger Bands + RSI combined indicator with signals

CMYK XIAM OPEN◊ Introduction
This is project XIAM, a work in progress.
Recently i came across the repainting problem.
Since then i haven't seen any bot-code that makes > 5% profit in two weeks with 0.25% fees/trade.
People who make good bots either bluff or don't share the code.
they let you rent it.
I aim to understand, learn it, write it myself. And share my findings with whoever shares with me.
◊ Origin
Based on RMI (RSI with momentum) and SMA, and values derived from those.
◊ Usage
Currently an investigative script.
◊ Theoretical Approaches
Philosophy α :: Cleansignal
:: Cleaning up the signal, from irregularities that cause unpredictable results.
Merging available tickers of a pair into one.
Merging available tickers of different coins into one in the correct proportion. (eg. Crypto market cap)
Removing Jitter, and smoothing signal without delay.
Philosophy β :: Rythmic
:: Syncing into the rythm's, to never miss the que, and trade on every theoretical low/high
Searching Amplitude, Period, Phase Shift, Frequency's of the carrier waves.
Marking Acrivity/inactivity of the carrier waves.
Partial Fractal repetition asses-able with above data?
Philosophy γ :: consequential
:: Seeking for Indicatory events and causal relations
Probability / reward.
Confirmation and culmination.
...
◊ Community
Wanna share your findings ? or need help resolving a problem ?
CMYK :: discord.gg
AUTOTVIEW :: discordapp.com

Multi-Bollinger [DW]This is an experimental study designed to visualize trend activity and volatility using a set of two Bollinger Bands calculated with a basis moving average type of your choice.
The available moving averages in this script are:
-Exponential Moving Average
-Simple Moving Average
-Weighted Moving Average
-Volume Weighted Moving Average
-Hull Moving Average
-Least Squares Moving Average
-Arnaud Legoux Moving Average
-Coefficient of Variation Weighted Moving Average
-Fractal Adaptive Moving Average
-Kaufman's Adaptive Moving Average
In addition, a middle filter is calculated by taking the median of the two basis lines.
Multi-Timeframe functionality is included. You can choose any timeframe that Tradingview supports as the basis resolution for the bands.
Custom bar color scheme is included with four options to choose from.

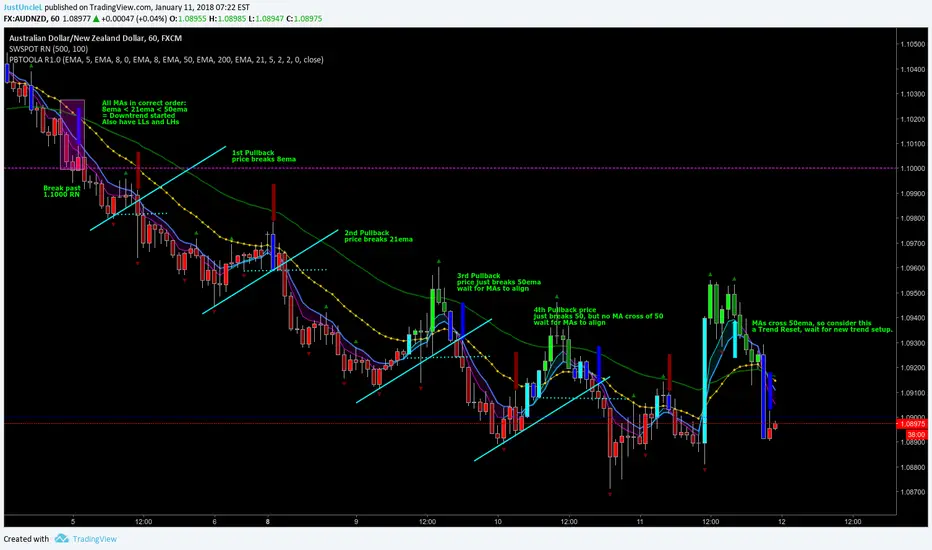
Pullback Trading Tool ALT R1.0 by JustUncleLThis study is an alternative Pullback Tool to my previous versions "Pullback Trading Tool R#.# by JustUncleL". This version aims to provide a cleaner but powerful trading tool. It incorporates the majority of the indicators needed to analyse trade Trends for Pullbacks and Reversals. You can optionally use Heikin Ashi candle or Renko charts. The notes here are mainly in reference to using standard Candlestick 60min signal chart (or Anchor chart time frame), other higher time frames can be used instead as Anchor Time Frames such as 240min(4hr) or 1440min(Daily).
NOTE: A Pullback is synomous to Retracement, generally a Pullback refers to a large Retracement of 100pips or more. In the context of this Tool and any comments related to it, a Pullback will be the same as a Retracement.
Incorporated within this tool are the following indicators:
1. Three Moving Averages (EMA by default) that can optionally be Anchored to a Higher Time Frame:
DodgerBlue = EMA08 (default)
Green = EMA50 (default)
Gray = EMA200 (default), disabled by default.
2. One Anchored Signal Moving Average line Yellow EMA21 (default).
3. Two Un-Anchored Moving Averages as Ribbon, can be disabled.
Aqua = EMA03 (default)
Fuchsia = EMA08 (default)
4. Display Pivots and optional Pivot Levels. By default Pivot is set to : 2 candles RHS of Pivot and 2 candles LHS of Pivot; this is the setting required to show standard Fractal points.
5. Optional HH, LH, LL, HL finder to help with drawing Trend lines and mini Trend Lines.
6. Coloured coded Bar based on the signal MA:
the Standard candle colours:
Blue = candle open and closed above signal MA.
Red = candle open and closed below signal MA.
Yellow = Candle stradle across signal MA.
the Grab candles scheme:
Lime = Bull candle open and closed above signal MA.
Green = Bear candle open and closed above signal MA.
Red = Bull candle open and closed below signal MA.
DarkRed = Bear candle open and closed below signal MA.
Aqua = Bull candle closed across signal MA.
Blue = Bear candle stradle across signal MA.
7. Alert entry arrows generated within a Trend or at the start of a new trend.
An Uptrend is defined as anchored fast (8ema) above anchored signal (21ema) above anchored medium (50ema).
A Downtrend is defined as anchored fast (8ema) below anchored signal (21ema) below anchored medium (50ema).
A Pullback generates an red (short entry) or green (long entry) arrow when price crosses anchored fast or signal MAs and then crosses back to return to trend direction.
A Trend Break, which is defined as any of the MAs crossing breaking trend, generates a blue (short) or aqua (long) arrow and then make new trend (in same or new trend direction).
Super Guppy R1.0 by JustUncleLThis indicator is a Super Guppy version of standard Guppy GMMA as used in "CM_GUPPY_EMA Revised R2 by JustUncleL". Guppy MAs are designed to capture the inferred behaviour of traders and investors by using two groups of averages.
In this version of Super Guppy Traders Group of EMAs are:
EMA3 to EMA23 step 2 (Aqua=Uptrend, Blue=downtrend)
and Investors Group EMAs are:
EMA25 to EMA70 step 3 (Lime=Uptrend, Red=downtrend)
(Gray=Trend not established or in a Pull Back).
The idea of Guppy EMAs is to use fractal repetitions to identify points of agreement and disagreement which precede significant trend changes. For further info on how Guppy/Super Guppy can be used in trading please refer to
www.guppytraders.com
and many other articles available on the subject.
This indicator provides the following :
Swing Arrow Alerts (Red for Sell and Green for Buy) to indicate PullBack entries after new trend has been established. Also have option to wait for both fast and slow to completely separate (Confluence). Another option is to show alerts when show arrows when Candle colour changes, this is handy when using Heikin Ashi or Renko Charts.
Trend Break Arrow Alerts (Blue for Sell and Aqua for Buy) to indicate entries for aggressive trend swing point and is calculated by cross over of the average Traders EMA with the average Investors EMA. This was suggested option by Guppy.
Anchor Time frame (0=current), is the time frame that the Guppy EMAs are calculated for. In this way the 60min Guppy can be viewed on say 15min chart and help with setting up tighter Stop Loss conditions.
Alert conditions are also created for the TradingView Alarm subsystem. Only alerts for the selected alert options are generated.

Fibonacci Time Moving Average Ribbons [DW]This is an experimental study that takes a moving average of price, then offsets the average by up to 11 consecutive Fibonacci numbers from 1 to 144.
Choose between Kaufman's Adaptive Moving Average, Hull Moving Average, Fractal Adaptive Moving Average, Geometric Moving Average, or Exponential Moving Average.

Linear Regression TrendChannel Lines based on linear regression combined with fractal divergence indicator bands.
Taylor

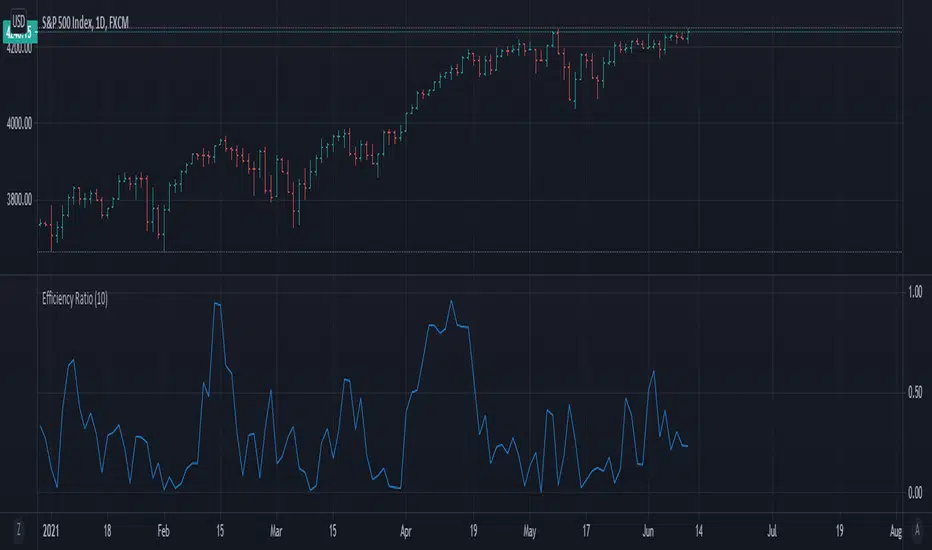
Efficiency Ratio (Kaufman)or "Generalized fractal efficiency"
Measures price trend effectiveness. Where 1.00 is trending and 0.00 not.
Calculation:
ER = Change / Sum of absolute changes
where "Change" is a price change over specified period and "Sum of Changes" sum of absolute price movements within that period
As an example, to calculate 5-day ER you have to calculate 5-day change and then calculate absolute sum of each day movements:
5-day ER = 5-day change / (|day 1 change| + |day 2 change| + |day 3 change| + |day 4 change| + |day 5 change|)
Source: www.marketvolume.com


UCS_Murrey's Math Oscillator_V2Hello, Murrey Math lovers, Thanks for those who showed interest on this. Based on a request, I have updated the plot / candle coloring, for Version - 2.
This has been in the queue for a while.
There was a Glitch found with the Multiplier. Will Fix in the next version. The Current Version (and the previous version) only supports 1/8 fractions. Will not support 0.25. The code needs to be updated, to automate the fractal line glitches for other ratios, Planned for future update.
Good Luck and Enjoy the Colorful Oscillator. Please keep your suggestions flowing. Lets make it better.

Indicators: MMA and 3 oscillatorsGuppy Multiple Moving Averages
---------------------------------
Developed by Daryl Guppy, the basic idea of Multiple moving average(MMA) is to view the trend as two band of moving averages – short term band and long term band.
Shortterm averages capture the inferred behaviour of traders and long term represents the investors. Uses fractal repetition to identify points of agreement and disagreement which precede significant trend changes.
Short intro on interpreting the signals:
drive.google.com
More info:
www.guppytraders.com
Guppy Oscillator
---------------------------------
The Guppy MMA Oscillator, developed by Leon Wilson, is an oscillator representation of difference between GMMA ribbons. Look for signal crosses for the triggers.
Linda Raschke (3/10) Oscillator
---------------------------------
This oscillator is similar to having a MACD of (3,10,16), the nuances are explained by Linda Raschke in her manual "Professional Trading Techniques":
www.lbrgroup.com
Ian Oscillator
---------------------------------
Simple EMA difference converted to an oscillator. Use the signal crosses as triggers.
