Williams Fractals BW - Flechas + Breakoutsfractal con velas en la direccion hacia donde va para menos conficion
ابحث في النصوص البرمجية عن "Fractal"
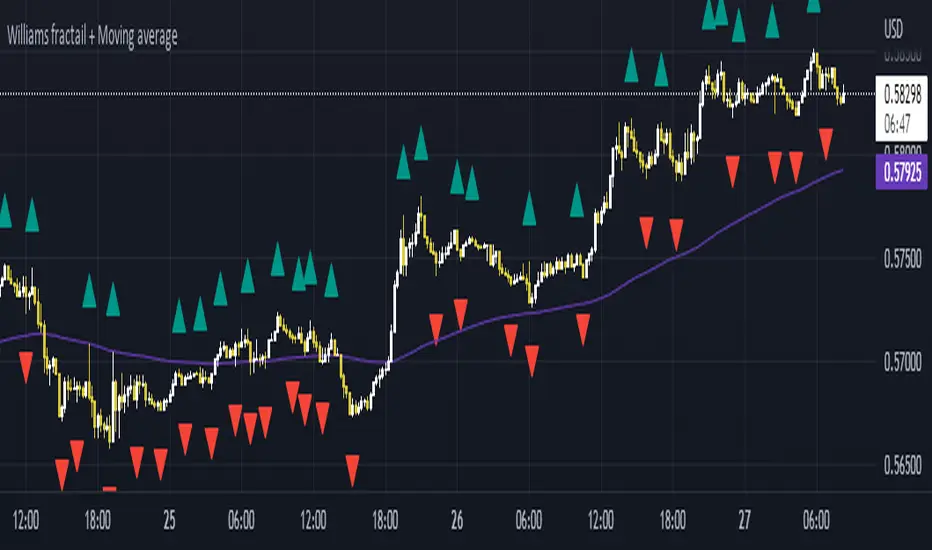
Williams Fractals + SMMAwilliams fractail + moving average. Is for educational . combined indicator of williams fractails and smmothed moving average
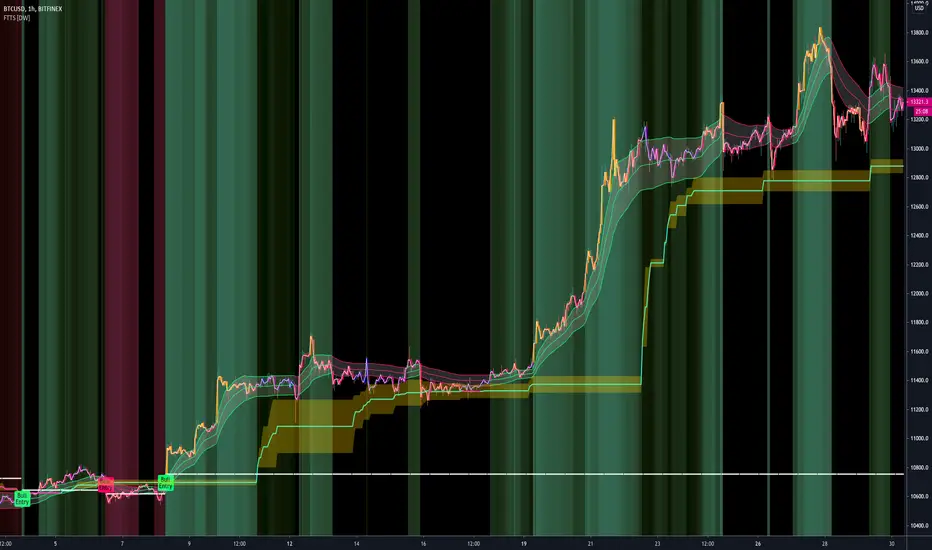
RS30 ModuleWhat is this?
This module will helps you to sell faster (profit taking) when price reserve without waiting price drop too much.
The Indicators & strategies?
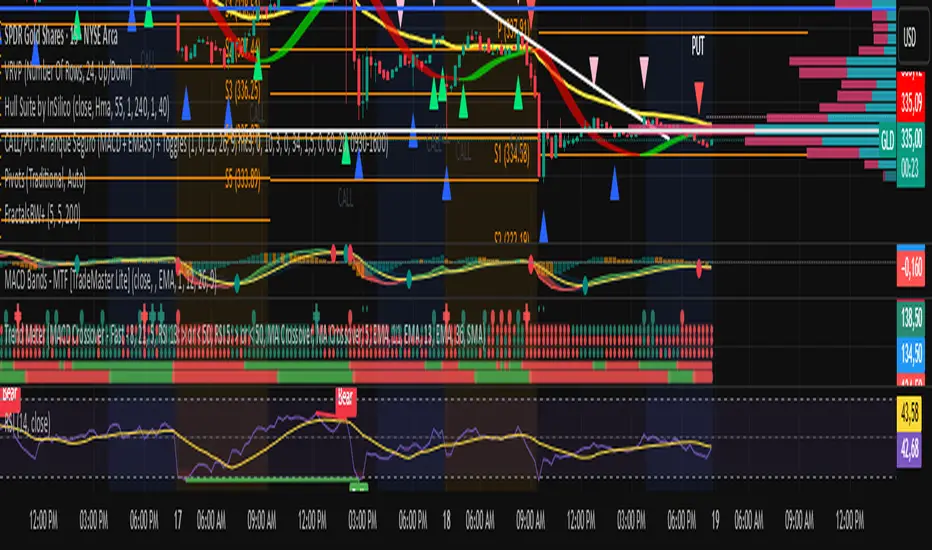
This module consist of short term resist and support (R/S). This R/S is based on price fractals, modified to a simpler visualization, we called: RS30 which used in 30 minutes chart.
This RS30 (the blue (R) & red (S) lines) works when price move in bullish mode on daily basis, but you want to take profit on intraday basis. As price rally, 30minutes chart will keep going up and the support (red) line. You can watch this indicator, if the 30minutes chart go down and breaks S (red line), ist the best time to sell, means a better profit compared if you wait a daily chart reverse.
Benefit For You
You'll have a guidance how to follow the trend while the major trend is as you expected and sell better to take profit before the major top reversal.

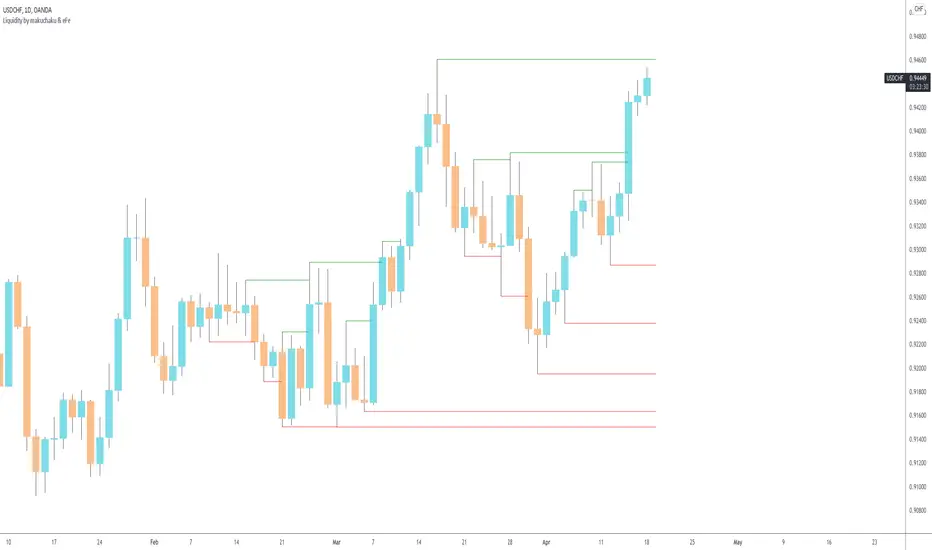
Makuchaku's trading tools - Liquidity visualizerThis indicator plots those pivots/fractals which have not been taken out by price, whereby showing where are the clusters of highs/lows where stop orders (or liquidity) could be hiding.
This is a fantastic tool for taking reversal trades.
Fractal Fire Zones/Wave RiderMulti timeframe confluence reader: This indicator plots fractals on any specific timeframe selected, multi time frame ema cross that changes color with the trend, multi timeframe 200ema and a calculation that shows potential turning points with a multi timeframe stochastic oscillator confluence. The fire zones are preferred in a ranging market or for potential scalps while the ema trend is designed to keep you with the main trend in any given session. The accumulation/distribution candles can be used to gauge pull backs for re entry or exits based on time or multiple confirmations.

Fractal lines multi time framePlot lines using last two William's fractals to find trends, it supports different resolutions and alerts

RSX FracticalityA little project I was working on to avoid studying for finals. Using LazyBear's RSX code for a smoother RSI, then taking the RSX of fib number lengths. Take the average of that, then the JMA of that from the same fib numbers. The average of that is then treated as the trend, take the average of the trend values from the main time frames, the script calls pretty far back so adding a W or M TF I think would throw the calculations off. Then I smoothed that value using the jma's to create the overall trend. I got the idea from Ehler's Empirical Mode Decomposition about identifying peaks and valleys and creating an average of that to create a range. The idea is that if the trend is above the Average Peak then it is a bull trend, less than the average valley it's a bear trend, in between it's ranging. It looks like it turned out alright, I'll be working on this idea of fractals a lot this summer to see if I can improve it or build something better off of the idea.

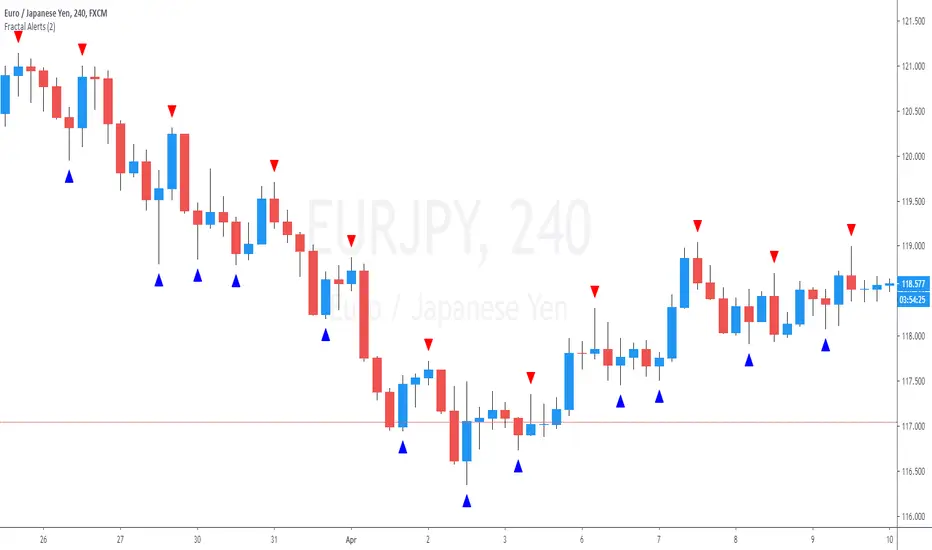
Fractals and Pattern MandelbrotThis indicator show classic fractals and patterns of force long or short if they are on the top or on the low of a x candles, so they try to anticipate the inversion of the trend.
The purple arrow indicate the fractals and the blue indicate the pattern for the inversion of the trend.
For the targets and the stop we need to use Fibonacci extentions modificate with this values:
-1.64
-0.64
1.5563
2.422
3.5699
4.669
5.8664
9.1299
14.208
and use this A,B,C points:
For long positions A is the LAST RED CLOSE, B is the GREEN CLOSE just before the blue arrow, C is B.
the -1.64 is the stop loss, if price close under that
the -0.64 is the best level to enter long
For short positions A is the LAST GREEN CLOSE, B is the RED CLOSE just before the blue arrow, C is B.
the -1.64 is the stop loss, if price close above that
the -0.64 is the best level to enter short

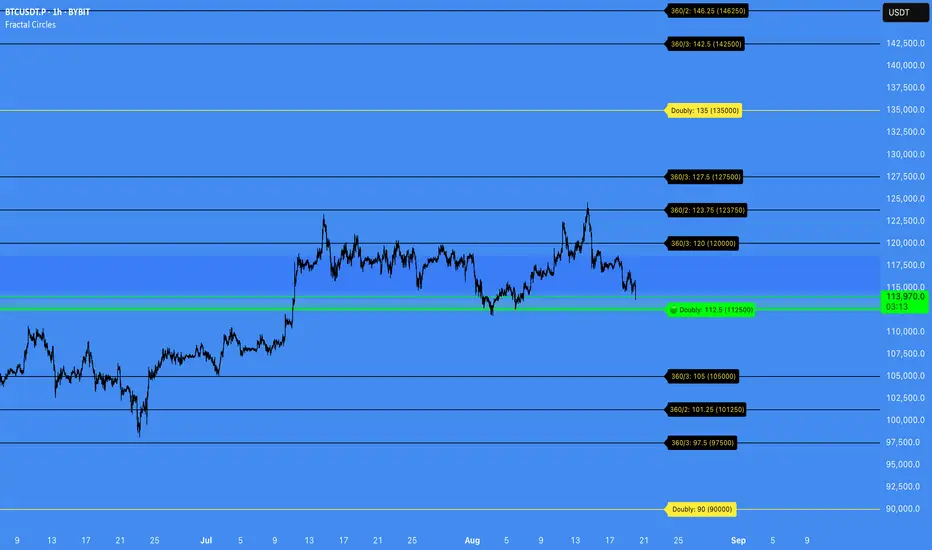
Fractal Circles#### FRACTAL CIRCLES ####
I combined 2 of my best indicators Fractal Waves (Simplified) and Circles.
Combining the Fractal and Gann levels makes for a very simple trading strategy.
Core Functionality
Gann Circle Levels: This indicator plots mathematical support and resistance levels based on Gann theory, including 360/2, 360/3, and doubly strong levels. The system automatically adjusts to any price range using an intelligent multiplier system, making it suitable for forex, stocks, crypto, or any market.
Fractal Wave Analysis: Integrates real-time trend analysis from both current and higher timeframes. Shows the current price range boundaries (high/low) and trend direction through dynamic lines and background fills, helping traders understand market structure.
Key Trading Benefits
Active Level Detection: The closest Gann level to current price is automatically highlighted in green with increased line thickness. This eliminates guesswork about which level is most likely to act as immediate support or resistance.
Real-Time Price Tracking: A customizable line follows current price with an offset to the right, projecting where price sits relative to upcoming levels. A gradient-filled box visualizes the exact distance between current price and the active Gann level.
Multi-Timeframe Context: View fractal waves from higher timeframes while maintaining current timeframe precision. This helps identify whether short-term moves align with or contradict longer-term structure.
Smart Alert System: Comprehensive alerts trigger when price crosses any Gann level, with options to monitor all levels or focus only on the active level. Reduces the need for constant chart monitoring while ensuring you never miss significant level breaks.
Practical Trading Applications
Entry Timing: Use active level highlighting to identify the most probable support/resistance for entries. The real-time distance box helps gauge risk/reward before entering positions.
Risk Management: Set stops based on Gann level breaks, particularly doubly strong levels which tend to be more significant. The gradient visualization makes it easy to see how much room price has before hitting key levels.
Trend Confirmation: Fractal waves provide immediate context about whether current price action aligns with broader market structure. Bullish/bearish background fills offer quick visual confirmation of trend direction.
Multi-Asset Analysis: The auto-scaling multiplier system works across all markets and timeframes, making it valuable for traders who monitor multiple instruments with vastly different price ranges.
Confluence Trading: Combine Gann levels with fractal wave boundaries to identify high-probability setups where multiple technical factors align.
This tool is particularly valuable for traders who appreciate mathematical precision in their technical analysis while maintaining the flexibility to adapt to real-time market conditions.
Fractal Breakout Trend Following System█ OVERVIEW
The Fractal Breakout Trend Following System is a custom technical analysis tool designed to pinpoint significant fractal pivot points and breakout levels. By analyzing price action through configurable pivot parameters, this indicator dynamically identifies key support and resistance zones. It not only marks crucial highs and lows on the chart but also signals potential trend reversals through real-time breakout detections, helping traders capture shifts in market momentum.
█ KEY FEATURES
Fractal Pivot Detection
Utilizes user-defined left and right pivot lengths to detect local highs (pivot highs) and lows (pivot lows). This fractal-based approach ensures that only meaningful price moves are considered, effectively filtering out minor market noise.
Dynamic Line Visualization
Upon confirmation of a pivot, the system draws a dynamic line representing resistance (from pivot highs) or support (from pivot lows). These lines extend across the chart until a breakout occurs, offering a continuous visual guide to key levels.
Trend Breakout Signals
Monitors for price crossovers relative to the drawn pivot lines. A crossover above a resistance line signals a bullish breakout, while a crossunder below a support line indicates a bearish move, thus updating the prevailing trend.
Pivot Labelling
Assigns labels such as "HH", "LH", "LL", or "HL" to detected pivots based on their relative values.
It uses the following designations:
HH (Higher High) : Indicates that the current pivot high is greater than the previous pivot high, suggesting continued upward momentum.
LH (Lower High) : Signals that the current pivot high is lower than the previous pivot high, which may hint at a potential reversal within an uptrend.
LL (Lower Low) : Shows that the current pivot low is lower than the previous pivot low, confirming sustained downward pressure.
HL (Higher Low) : Reveals that the current pivot low is higher than the previous pivot low, potentially indicating the beginning of an upward reversal in a downtrend.
These labels provide traders with immediate insight into the market structure and recent price behavior.
Customizable Visual Settings
Offers various customization options:
• Adjust pivot sensitivity via left/right pivot inputs.
• Toggle pivot labels on or off.
• Enable background color changes to reflect bullish or bearish trends.
• Choose preferred colors for bullish (e.g., green) and bearish (e.g., red) signals.
█ UNDERLYING METHODOLOGY & CALCULATIONS
Fractal Pivot Calculation
The script employs a sliding window technique using configurable left and right parameters to identify local highs and lows. Detected pivot values are sanitized to ensure consistency in subsequent calculations.
Dynamic Line Plotting
When a new pivot is detected, a corresponding line is drawn from the pivot point. This line extends until the price breaks the level, at which point it is reset. This method provides a continuous reference for support and resistance.
Trend Breakout Identification
By continuously monitoring price interactions with the pivot lines, the indicator identifies breakouts. A price crossover above a resistance line suggests a bullish breakout, while a crossunder below a support line indicates a bearish shift. The current trend is updated accordingly.
Pivot Label Assignment
The system compares the current pivot with the previous one to determine if the move represents a higher high, lower high, higher low, or lower low. This classification helps traders understand the underlying market momentum.
█ HOW TO USE THE INDICATOR
1 — Apply the Indicator
• Add the Fractal Breakout Trend Following System to your chart to begin visualizing dynamic pivot points and breakout signals.
2 — Adjust Settings for Your Market
• Pivot Detection – Configure the left and right pivot lengths for both highs and lows to suit your desired sensitivity:
- Use shorter lengths for more responsive signals in fast-moving markets.
- Use longer lengths to filter out minor fluctuations in volatile conditions.
• Visual Customization – Toggle the display of pivot labels and background color changes. Select your preferred colors for bullish and bearish trends.
3 — Interpret the Signals
• Support & Resistance Lines – Observe the dynamically drawn lines that represent key pivot levels.
• Pivot Labels – Look for labels like "HH", "LH", "LL", and "HL" to quickly assess market structure and trend behavior.
• Trend Signals – Watch for price crossovers and corresponding background color shifts to gauge bullish or bearish breakouts.
4 — Integrate with Your Trading Strategy
• Use the identified pivot points as potential support and resistance levels.
• Combine breakout signals with other technical indicators for comprehensive trade confirmation.
• Adjust the sensitivity settings to tailor the indicator to various instruments and market conditions.
█ CONCLUSION
The Fractal Breakout Trend Following System offers a robust framework for identifying critical fractal pivot points and potential breakout opportunities. With its dynamic line plotting, clear pivot labeling, and customizable visual settings, this indicator equips traders with actionable insights to enhance decision-making and optimize entry and exit strategies.

Fractal Model [Pro+] (TTrades)Introduction:
Crafted with TTrades, the Fractal Model empowers traders with a refined approach to Algorithmic Price Delivery. Specifically designed for those aiming to capitalize on expansive moves, this model anticipates momentum shifts, swing formations, orderflow continuations, as well as helping analysts highlight key areas to anticipate price deliveries.
Description:
The Fractal Model° is rooted in the cyclical nature of price movements, where price alternates between large and small ranges. Expansion occurs when price moves consistently in one direction with momentum. By combining higher Timeframe closures with the confirmation of the change in state of delivery (CISD) on the lower Timeframe, the model reveals moments when expansion is poised to occur.
Thanks to TTrades' extensive research and years of studying these price behaviors, the Fractal Model° is a powerful, adaptive tool that seamlessly adjusts to any asset, market condition, or Timeframe, translating complex price action insights into an intuitive and responsive system.
The TTrades Fractal Model remains stable and non-repainting, offering traders reliable, unchanged levels within the given Time period. This tool is meticulously designed to support analysts focus on price action and dynamically adapt with each new Time period.
Key Features:
Custom History: Control the depth of your historical view by selecting the number of previous setups you’d like to analyze on your chart, from the current setup only (0) to a history of up to 40 setups. This feature allows you to tailor the chart to your specific charting style, whether you prefer to see past setups or the current view only.
Fractal Timeframe Pairings: This indicator enables users to observe and analyze lower Timeframe (LTF) movements within the structure of a higher Timeframe (HTF) candle. By examining LTF price action inside each HTF candle, analysts can gain insight into micro trends, structure shifts, and key entry points that may not be visible on the higher Timeframe alone. This approach provides a layered perspective, allowing analysts to closely monitoring how the LTF movements unfold within the overarching HTF context.
For a more dynamic and hands-off user experience, the Automatic feature autonomously adjusts the higher Timeframe pairing based the current chart Timeframe, ensuring accurate alignment with the Fractal Model, according to TTrades and his studies.
Bias Selection: This feature allows analysts complete control over bias and setup detection, allowing one to view bullish or bearish formations exclusively, or opt for a neutral bias to monitor both directions. Easily toggle the bias filter on Fractal Model to align with your higher Timeframe market draw.
Indicator Notice for Timeframe Pairing Limitations: This indicator supports Timeframe pairings (e.g., 5m-1H, 15m-4H). If you select a timeframe, grater than the lower Timeframe (LTF) view (e.g., viewing a 15m chart when 5m-1H is enabled), the indicator will display an warning message within the table. Although the higher Timeframe (HTF) candle plotting will remain visible, note that the LTF’s CISD and associated projections will not render in this view.
Customizable Time Filters: Further synchronize Time and price studies by selecting up to three custom Time windows, filtering model formations that fall outside these specified ranges. This provides clarity and focus on relevant price action signatures within defined Time windows, at the discretion of the analyst.
Higher Time Frame Candles (PO3): The Fractal Model° integrates the HTF Power of Three framework, enabling traders to visualize and spot critical turning points live. By incorporating this structure, traders can observe key phases of price delivery and market transitions on lower Timeframes, while monitoring higher Timeframe candle development.
Info Table: Display a customizable information table that includes key details such as timeframe pairing, Time until the next higher Timeframe candle close, analyst bias, and applied Time filter preferences. Options for size, location, and border give analysts full control over the table’s appearance on the chart.
TTrades Framework Customization :
TTFM Lables (C2/C3/C4): When a setup remains valid, the label will display in gray, signifying stable conditions for the setup.
If the setup fails—defined by price returning to the initial high or low without forming a higher Timeframes swing point—the indicator will stop plotting projections, Equilibrium (EQ), Liquidity Sweep, and the T-spot. In this case, the labels for key points (C2, C3, C4) will remain on the chart but turn red, clearly indicating the failure of the setup.
If the setup does not fail within the next higher Timeframes candle, which defines the setup’s formation, the label will turn orange. This orange color signals potential consolidation, or slowdown, suggesting that the market may enter a range or pause in trend movement within the setup.
Candle 1 Liquidity: Highlight important liquidity levels at each swing point with horizontal rays, marking sweeps of liquidity and potential reversals.
Change in State of Delivery (CISD): Mark the series of candles making up significant highs or lows. A close beyond the opening price signals a change from bullish to bearish or vice versa, confirming a trend reversal.
Candle Equilibrium: Indicates 50% levels of higher time frame ranges, displaying discount and premium zones that provide additional context for potential entries and exits.
T-Spot Identification: The T-Spot marks anticipated points of the higher Timeframe candles where price wicks are expected to form, based on TTrades’ refined analysis and methodology. This level is invaluable for identifying high-probability reversal or continuation points within lower Timeframes, remaining aligned with the higher Timeframe narrative.
Projections: Leverage projected levels based on the shifts in delivery as per TTrades’ analysis. These user-defined levels serve as future points of interest for price to redeliver, rebalance, and exhaust. Analysts can add, or remove, desired projection levels – default projections being .
Formation Liquidity: Identify previous candles' highs and lows as critical liquidity points appertaining to the current developing formation. These zones are marked to provide easy visualization of engineered liquidity pools, serving as key reference points for future price action.
Fully Automated Framework: all these components, when put together in the Fractal Model° , yield TTrades' fully automated system. Each component is customizable to the analyst's liking to match their unique visual preferences and model Timeframes.
Usage Guidance:
Add Fractal Model (TTrades) to your TradingView chart.
Select your preferred Time pairings, model history, Time filers.
Automate your analysis process with Fractal Model (TTrades) and leverage it into your existing strategies to fine-tune your view through TTrades' lens.
Terms and Conditions
Our charting tools are products provided for informational and educational purposes only and do not constitute financial, investment, or trading advice. Our charting tools are not designed to predict market movements or provide specific recommendations. Users should be aware that past performance is not indicative of future results and should not be relied upon for making financial decisions. By using our charting tools, the purchaser agrees that the seller and the creator are not responsible for any decisions made based on the information provided by these charting tools. The purchaser assumes full responsibility and liability for any actions taken and the consequences thereof, including any loss of money or investments that may occur as a result of using these products. Hence, by purchasing these charting tools, the customer accepts and acknowledges that the seller and the creator are not liable nor responsible for any unwanted outcome that arises from the development, the sale, or the use of these products. Finally, the purchaser indemnifies the seller from any and all liability. If the purchaser was invited through the Friends and Family Program, they acknowledge that the provided discount code only applies to the first initial purchase of the Toodegrees Premium Suite subscription. The purchaser is therefore responsible for cancelling – or requesting to cancel – their subscription in the event that they do not wish to continue using the product at full retail price. If the purchaser no longer wishes to use the products, they must unsubscribe from the membership service, if applicable. We hold no reimbursement, refund, or chargeback policy. Once these Terms and Conditions are accepted by the Customer, before purchase, no reimbursements, refunds or chargebacks will be provided under any circumstances.
By continuing to use these charting tools, the user acknowledges and agrees to the Terms and Conditions outlined in this legal disclaimer.
سكربت مدفوع

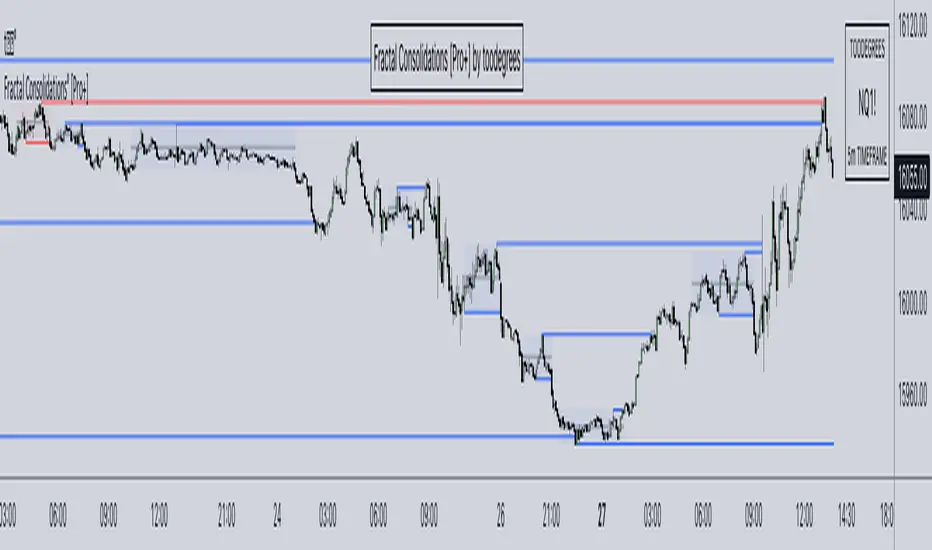
Fractal Consolidations [Pro+]Introduction:
Fractal Consolidations Pro+ pushes the boundaries of Algorithmic Price Delivery Analysis. Tailored for traders seeking precision and efficiency to unlock hidden insights, this tool empowers you to dissect market Consolidations on your terms, live, in all asset classes.
What is a Fractal Consolidation?
Consolidations occur when price is trading in a range. Normally, Consolidation scripts use a static number of "lookback candles", checking whether price is continuously trading inside the highest and lowest price points of said Time window.
After years spent studying price action and numerous programming attempts, this tool succeeds in veering away from the lookback candle approach. This Consolidation script harnesses the delivery mechanisms and Time principles of the Interbank Price Delivery Algorithm (IPDA) to define Fractal Consolidations – solely based on a Timeframe Input used for context.
Description:
This concept was engineered around price delivery principles taught by the Inner Circle Trader (ICT). As per ICT, it's integral for an Analyst to understand the four phases of price delivery: Consolidation , Expansion , Retracement , and Reversal .
According to ICT, any market movement originates from a Consolidation, followed by an Expansion .
When Consolidation ranges begin to break and resting liquidity is available, cleaner Expansions will take place. This tool's value is to visually aid Analysts and save Time in finding Consolidations in live market conditions, to take advantage of Expansion moves.
CME_MINI:ES1! 15-Minute Consolidation setting up an Expansion move, on the 10 Minute Chart:
Fractal Consolidations Pro+ doesn't only assist in confirming Higher Timeframe trend continuations and exposing opportunities on Lower Timeframes. It's also designed for both advanced traders and new traders to save Time and energy in navigating choppy or rangebound environments.
CME_MINI:ES1! 30 Minute Consolidation forming Live, on the 5 Minute Chart:
By analyzing past price action, traders will find algorithmic signatures when Consolidations are taking place, therefore providing a clearer view of where and when price is likely to contract, continue consolidating, breakout, retrace, or reverse. A prominent signature to consider when using this script is ICT's Market Maker Buy/Sell Models. These signatures revolve around the engineering of Consolidations to manipulate price in a specific direction, to then reverse at the appropriate Time. Each stage of the Market Maker Model can be identified and taken advantage of using Fractal Consolidations.
CME_MINI:NQ1! shift of the Delivery Curve from a Sell Program to a Buy Program, Market Maker Buy Model
Key Features:
Tailored Timeframes: choose the Timeframe that suits your model. Whether you're a short-term enthusiast eyeing 1 Hour Consolidations or a long-term trend follower analyzing 4 Hour Consolidations, this tool gives you the freedom to choose.
FOREXCOM:EURUSD Fractal Consolidations on a 15 Minute Chart:
Auto-Timeframe Convenience: for those who prefer a more dynamic and adaptive approach, our Auto Timeframe feature effortlessly adjusts to the most relevant Timeframe, ensuring you stay on top of market consolidations without manually adjusting settings.
Consolidation Types: define consolidations as contractions of price based on either its wick range or its body range.
COMEX:GC1! 4 Hour Consolidation differences between Wick-based and Body-based on a 1 Hour Chart:
Filtering Methods: combine previous overlapping Consolidations, merging them into one uniform Consolidation. This feature is subject to repainting only while a larger Consolidation is forming , as smaller Consolidations are confirmed. However once established, the larger Consolidation will not repaint .
FOREXCOM:GBPUSD 15 Minute Consolidation Differences between Filter Consolidations ON and OFF:
IPDA Data Range Filtering: this feature gives the Analyst control for selective visibility of Consolidations in the IPDA Data Range Lookback . The Analyst can choose between 20, 40, and 60 days as per ICT teachings, or manually adjust through Override.
INDEX:BTCUSD IPDA40 Data Range vs. IPDA20 Data Range:
Extreme Float: this feature provides reference points when the price is outside the highest or lowest liquidity levels in the chosen IPDA Data Range Lookback. These Open Float Extremes offer critical insights when the market extends beyond the Lookback Consolidation Liquidity Levels . This feature helps identify liquidity extremes of interest that IPDA will consider, which is crucial for traders in understanding market movements beyond the IPDA Data Ranges.
INDEX:ETHUSD Extreme Float vs. Non-Extreme Float Liquidity:
IPDA Override: the Analyst can manually override the default settings of the IPDA Data Range Lookback, enabling more flexible and customized analysis of market data. This is particularly useful for focusing on recent price actions in Lower Timeframes (like viewing the last 3 days on a 1-minute timeframe) or for incorporating a broader data range in Higher Timeframes (like using 365 days to analyze Weekly Consolidations on a daily timeframe).
Liquidity Insight: gain a deeper understanding of market liquidity through customizable High Resistance Liquidity Run (HRLR) and Low Resistance Liquidity Run (LRLR) Consolidation colors. This feature helps distinguishing between HRLR (high resistance, delayed price movement) and LRLR (low resistance, smooth price movement) Consolidations, aiding in quick assessment of market liquidity types.
TVC:DXY Low Resistance vs. High Resistance Consolidation Liquidity Behaviour and Narrative:
Liquidity Raid Type: decide whether to categorize a Consolidation liquidity raid by a wick or body trading through a level.
CBOT:ZB1! Wick vs. Body Liquidity Raid Type:
Customizable User Interface: tailor the visual representation to align with your preferences. Personalize your trading experience by adjusting the colors of consolidation liquidity (highs and lows) and equilibrium, as well as line styles.
سكربت مدفوع
Fractal Dimension Index The Fractal Dimension Index is a technical indicator that gauges the amount of volatility currently present in the market.
The theory behind this indicator is that a value of 1.5 suggests the market is acting in a completely random fashion. As the market deviates from 1.5, the opportunity for earning profits is increased in proportion to the amount of deviation.
Keep in mind that the indicator does not show the direction of trends ! Although you can try to test it as a trend-following indicator that gives trend-following signals, that isn't the intended use of the indicator.
The Fractal Dimension Index is red when the market is in a trend. And it is blue when there is high volatility. When the Fractal Dimension Index changes its color from red to blue , it means that a trend is finishing. The market becomes erratic and high in volatility when the Fractal Dimension Index is blue . Usually, these "blue periods" do not go on for a long time, they come before a new trend.
So, look for trend-following signals while the Fractal Dimension Index is blue since this indicates high volatility before a potential trend, and avoid trend-following signals when the Fractal Dimension Index is red since this indicates a ranging/non-trending market or a trend that started long ago.

Fractal Trend Trading System [DW]This is an advanced utility that uses fractal dimension and trend information to generate useful insights about price activity and potential trade signals.
In this script, my Advanced FDI algorithm is used to estimate the fractal dimension of the dataset over a user defined period.
Fractal dimension, unlike spatial or topological dimension, measures how complexity or detail in an "object" changes as its unit of measurement changes, rather than the number of axes it occupies.
Many forms of time series data (seismic data, ECG data, financial data, etc.) have been theoretically shown to have limited fractal properties.
Consequently, we can estimate the fractal dimension from this data to get an approximate measure of how rough or convoluted the data stream is.
Financial data's fractal dimension is limited to between 1 and 2, so it can also be used to roughly approximate the Hurst Exponent by the relationship H = 2 - D.
When D=1.5, data statistically behaves like a random walk. D above 1.5 can be considered more rough or "mean reverting" due to the increase in complexity of the series.
D below 1.5 can be considered more prone to trending due to the decrease in complexity of the series.
In this script, you are given the option to apply my Band Shelf EQ algorithm to the dataset before estimating dimension.
This enables you to transform your data and observe how its newly measured complexity changes the outputs.
Whether you want to give emphasis to some frequencies, isolate specific bands, or completely alter the shape of your waveform, EQ filtration makes for an interesting experience.
The default EQ preset in this script removes the low shelf, then attenuates low end and high end oscillations.
The dominant cyclical components (bands 3 - 5 on default settings) are passed at 100%, keeping emphasis on 8 to 64 sample per cycle oscillations.
The estimated dimension is then used to calculate the High Dimension Zone and the Error Bands.
Both of these components are great for analyzing trends and for estimating support and resistance values.
The High Dimension Zone is composed of a high line, low line, and midline that update their values when D is at or above the user defined zone activation threshold.
The zone is then averaged over a user defined amount of updates and zone width is multiplied by a user defined value.
The Error Bands are composed of a high, low, and middle band that are calculated using an error adjusted adaptive filter algorithm that utilizes dimension as the smoothing constant modulator.
The basis filter for the error bands has two calculation types built in:
-> MA - Calculates the filters as adaptive moving averages modulated by D.
-> WAP - Calculates the filters as adaptive weighted average prices modulated by D.
The WAP starting point can be based on the High Dimension Zone being moved or a user defined interval.
You can also define the WAP's minimum and maximum periods for additional control of the initial and decayed sensitivity states.
The alpha (smoothing constant) modulator can be fine tuned using the designated dimension thresholds.
When D is at or below the low dimension threshold, the filter is most responsive, and vice-versa for the high dimension threshold.
Alpha is then multiplied by a user defined amount for additional control of sensitivity.
Band width is then multiplied by a user defined value.
A Hull transformation can be optionally performed on the zone averaging and band filter algorithms as well, which will alter the frequency and phase responses at the cost of some overshoot.
This transformation is the same as a typical Hull equation, but with custom filters being used instead of WMA.
The calculated outputs are then used to gauge the trend for signal and color scheme calculations.
First, a dominant trend indication is selected from its designated dropdown tab.
The available built in indications to choose from are:
-> Band Trend (Outer) - Detects band breakouts and saves their direction to gauge trend.
-> Band Trend (Median) - Uses disparity between source and the band median to gauge trend.
-> Zone Trend (Expansion) - Detects when the high fractal zone expands and saves its direction to gauge trend.
-> Zone Trend (Outer Levels) - Detects zone breakouts and saves their direction to gauge trend.
-> Zone Trend (Median) - Uses disparity between source and the zone median to gauge trend.
Then the trend output is optionally filtered before triggering signals.
There are multiple trend filtration options built into this script that can be used individually or in unison:
-> Filter Trend With High Fractal Zone - Filters the trend using the specified zone level or combination of levels with either disparity or crossover conditions.
There is a set of options for bullish and bearish trends.
-> Filter Trend With Error Bands - Filters the trend using the specified band level or combination of levels with either disparity or crossover conditions.
There is a set of options for bullish and bearish trends.
-> Filter Trend With Band - Zone Disparity Condition - Filters the trend using the specified band level, zone level, and disparity direction.
There is a set of options for bullish and bearish trends.
-> Filter By Zone That Moves With The Trend - Filters the specified trend by detecting when the high fractal zone’s direction correlates.
-> Filter By Bands That Move With The Trend - Filters the specified trend by detecting when the error bands’ direction correlates.
-> Filter Using Wave Confirmation - Filters the specified trend by detecting when source is in a correlating wave with user defined length.
You can also choose separate lengths for bullish and bearish trends.
-> Filter By Bars With Decreasing Dimension - Filters the specified trend by detecting when fractal dimension is decreasing, suggesting source is approaching more linear movement.
The filtered trend output is then used to generate entry and exit signals.
There are multiple options included to fine tune how these signals behave.
For entries, you have the following options built in:
-> Limit Entry Dimension - Limits the range of dimensional values that are acceptable for entry with user defined thresholds.
This can be incredibly useful for filtering out entries taken when price is moving in a more complex pattern,
or when price is approaching a peak and you’re a little late to the party.
-> Enable Position Increase Signals - Enables more entry signals to fire up to a user defined number of times when a position is active.
This is helpful for those who incrementally increase their positions, or for those who want to see additional signals as reference.
-> Limit Number Of Consecutive Trades - Limits the number of consecutive trades that can be opened in a single direction to a user defined maximum.
This is especially useful for markets that only trend for brief durations.
By limiting the amount of trades you take in one direction, you have more control over your market exposure.
There is a set of these options for both bullish and bearish entries.
For exits, you have the following options built in:
-> Include Exit Signals From High Fractal Zone - Enables exit signals generated from either crossover or disparity conditions between price and a specified zone level.
-> Include Exit Signals From Error Bands - Enables exit signals generated from either crossover or disparity conditions between price and a specified zone level.
-> Include Inactive Trend Output For Exits - Triggers exit signals when the filtered trend output is an inactive value.
-> Dimension Target Exit Method - Triggers exit signals based on fractal dimension hitting a user defined threshold.
You can either choose for the exit to trigger instantly, or after dimension reverts from the target by a user specified amount.
-> Exit At Maximum Entry Dimension - Triggers exit signals when dimension exceeds the maximum entry limit.
-> Number Of Signals Required For 100% Exit - Controls the number of exit signals required to close the position.
You can also choose whether or not to include partial exits.
Enabling them will fire a partial signal when an exit occurs, but the position is not 100% closed.
Of course, there is a set of these options for bullish and bearish exits.
In my opinion, no system is complete without some sort of risk management protocol in place.
So in this script, bullish and bearish trades come equipped with optional protective SL and TP levels with signals.
The levels can be fixed or trailing, and are calculated with a user defined scale.
The available scales for SL and TP distances are ticks, pips, points, % of price, ATR, band range, zone range, or absolute numerical value.
Now what if you have some awesome signals of your own that you’d like to use in conjunction with this script?
Well good news. You can!
In addition to all of the customizable features built into the script, you can integrate your own signals into the system using the external data inputs and linking your script.
This adds a whole new layer of customization to the system.
With external signals, you can use your own custom dominant trend indication, filter the dominant trend, and trigger exits and protective stops using custom signals.
The signal input is an integer format. 1=Bull Signal, -1=Bear Signal, 2=Bull Exit, -2=Bear Exit, 3=Bull SL Hit, -3=Bear SL Hit, 4=Bull TP Hit, -4=Bear TP Hit.
You can also use the external input as a custom source value for either dimension or global sources to further tailor the system to your liking.
The color scheme in this script utilizes two custom gradients that can be chosen for bar and background colors:
-> Trend (Dominant or Filtered) - A polarized gradient that shows green scaled values for bullish trend and red scaled values for bearish trend.
The colors are brighter and more vibrant as perceived trend strength increases.
-> Dimension - A thermal gradient that shows cooler colors when dimension is higher, and hotter colors when dimension is lower.
Both color schemes are dependent on the designated dimension thresholds.
The script comes equipped with alerts for entries, additional entries, exits, partial exits, and protective stops so you can automate more and stare at your charts less.
And lastly, the script comes equipped with additional external outputs to further your analysis:
-> Entry And Exit Signals - Outputs in the same format as the external signal input with these additions: 5=Bull Increase, -5=Bear Increase, 6=Bull Reduce, -6=Bear Reduce.
You can use these to send to other scripts, including strategy types so you can backtest your performance on TV’s engine.
-> Dominant Trend - Outputs 1 for bullish and -1 for bearish. Can be used to send trend signals to another script.
I designed this tool with individuality in mind.
Every trader has a different situation. We trade on different schedules, markets, perspectives, etc.
Analytical systems of basically any type are very seldom (if ever) “one size fits all” and usually require a fair amount of modification to achieve desirable results.
That’s why this system is so freely customizable.
Your system should be flexible enough to be tailored to your analytical style, not the other way around.
When a system is limited in what you can control, it limits your experience, analytical potential, and possibly even profitability.
This is not your typical pre-set system. If you're looking for just another "buy, sell" script that requires minimal thought, look elsewhere.
If you’re ready to dive into a powerful technical system that allows you to tailor the experience to your style, welcome!
-----------------------------------------------------------------------------------------------------------------------------------------------------------------
This is a premium script, and access is granted on an invite-only basis.
To gain access, get a copy of the system overview, or for additional inquiries, send me a direct message.
I look forward to hearing from you!
-----------------------------------------------------------------------------------------------------------------------------------------------------------------
General Disclaimer:
Trading stocks, futures, Forex, options, ETFs, cryptocurrencies or any other financial instrument has large potential rewards, but also large potential risk.
You must be aware of the risks and be willing to accept them in order to invest in stocks, futures, Forex, options, ETFs or cryptocurrencies.
Don’t trade with money you can’t afford to lose.
This is neither a solicitation nor an offer to Buy/Sell stocks, futures, Forex, options, ETFs, cryptocurrencies or any other financial instrument.
No representation is being made that any account will or is likely to achieve profits or losses of any kind.
The past performance of any trading system or methodology is not necessarily indicative of future results.
Fractals With Alerts For SwingsThis is a Fractals script with the capacity to provide alerts when two candles have completed after the swing point.
The alert can be placed after the swing point has been identified on a 3 candle formation and alerts when the a 5 candle formation is complete, ie; two closed candles after the swing point
Fractal Chaos Bands Strategy Stock market moves in a highly chaotic way, but at a larger scale, the movements
follow a certain pattern that can be applied to shorter or longer periods of time
and we can use Fractal Chaos Bands Indicator to identify those patterns. Basically,
the Fractal Chaos Bands Indicator helps us to identify whether the stock market is
trending or not. When a market is trending, the bands will have a slope and if market
is not trending the bands will flatten out. As the slope of the bands decreases, it
signifies that the market is choppy, insecure and variable. As the graph becomes more
and more abrupt, be it going up or down, the significance is that the market becomes
trendy, or stable. Fractal Chaos Bands Indicator is used similarly to other bands-indicator
(Bollinger bands for instance), offering trading opportunities when price moves above or
under the fractal lines.
The FCB indicator looks back in time depending on the number of time periods trader selected
to plot the indicator. The upper fractal line is made by plotting stock price highs and the
lower fractal line is made by plotting stock price lows. Essentially, the Fractal Chaos Bands
show an overall panorama of the price movement, as they filter out the insignificant fluctuations
of the stock price.
WARNING:
- This script to change bars colors.

Fractal Chaos Bands Stock market moves in a highly chaotic way, but at a larger scale, the movements
follow a certain pattern that can be applied to shorter or longer periods of time
and we can use Fractal Chaos Bands Indicator to identify those patterns. Basically,
the Fractal Chaos Bands Indicator helps us to identify whether the stock market is
trending or not. When a market is trending, the bands will have a slope and if market
is not trending the bands will flatten out. As the slope of the bands decreases, it
signifies that the market is choppy, insecure and variable. As the graph becomes more
and more abrupt, be it going up or down, the significance is that the market becomes
trendy, or stable. Fractal Chaos Bands Indicator is used similarly to other bands-indicator
(Bollinger bands for instance), offering trading opportunities when price moves above or
under the fractal lines.
The FCB indicator looks back in time depending on the number of time periods trader selected
to plot the indicator. The upper fractal line is made by plotting stock price highs and the
lower fractal line is made by plotting stock price lows. Essentially, the Fractal Chaos Bands
show an overall panorama of the price movement, as they filter out the insignificant fluctuations
of the stock price.

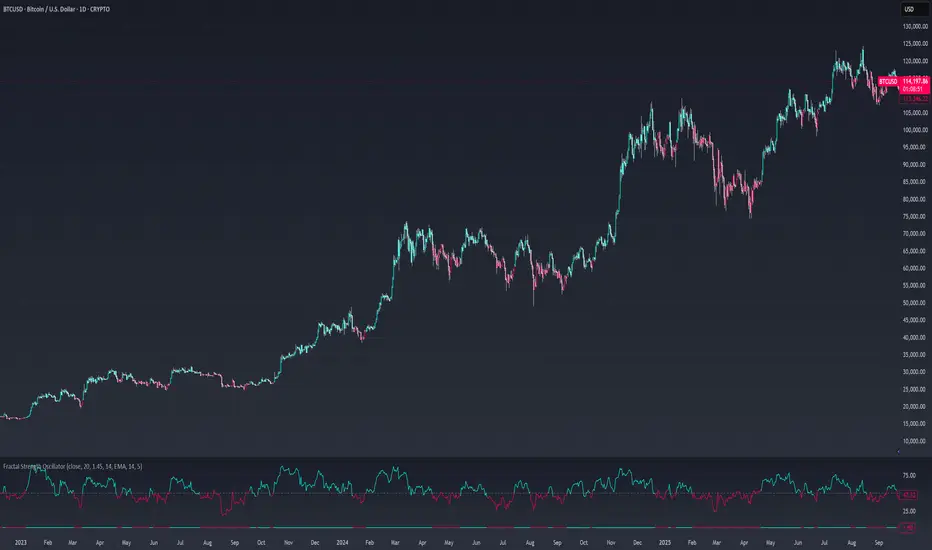
Fractal Strength OscillatorThe Fractal Strength Oscillator Indicator combines the Relative Strength Index (RSI) and Fractal Dimension Index (FDI) to identify market momentum and trend direction. By integrating RSI's momentum signals with FDI's fractal-based trend analysis, this indicator provides clear visual cues for bullish and bearish conditions through colored plots and price bars.
How It Works
RSI Calculation: Computes RSI based on a user-selected price source (default: Close) over a configurable period. Optional smoothing with various moving average types (e.g., SMA, EMA, ALMA) enhances signal clarity.
FDI Calculation: Measures market complexity using a fractal dimension over a user-defined period (default: 20). A threshold (default: 1.45) determines trend strength.
Trend Logic
Bullish Signal: RSI > 55 or FDI < threshold indicates upward momentum
Bearish Signal: RSI < 45 or FDI > threshold indicates downward momentum
Customization & Parameters
RSI Parameters: RSI length, smoothing option , MA type, MA length, ALMA sigma
FDI Parameters: FDI length, trend threshold.
Trading Applications
Momentum Trading: Use RSI and FDI signals for entry/exit points.
Trend Confirmation: Bar coloring aligns with trend signals.
Reversal Detection: Identify shifts when RSI or FDI crosses thresholds
Final Note
The Fractal Strength Oscillator Indicator is a straightforward tool for traders seeking momentum and trend insights. Its combination of RSI, FDI, and visual cues supports informed trading decisions. Backtest thoroughly and use within a broader strategy. This indicator is for educational purposes and not financial advice.
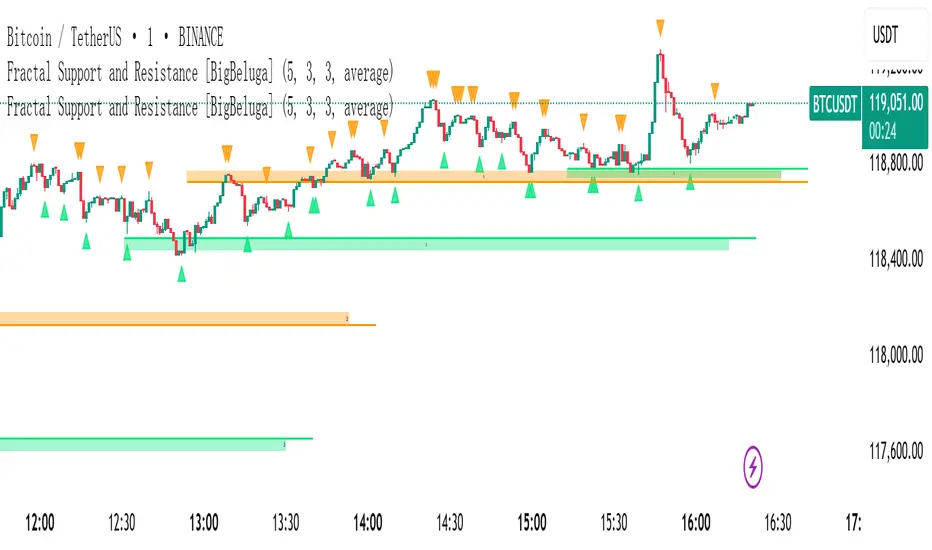
Fractal Support and Resistance -shaoThe Fractal Support and Resistance indicator automatically identifies high-probability support and resistance zones based on repeated fractal touches. When a defined number of fractal highs or lows cluster around the same price zone, the indicator plots a clean horizontal level and shaded zone, helping traders visualize structurally important areas where price may react.
Fractal Pullback Market StructureFractal Pullback Market Structure
Author: The_Forex_Steward
License: Mozilla Public License 2.0
The Fractal Pullback Market Structure indicator is a sophisticated price action tool designed to visualize internal structure shifts and break-of-structure (BoS) events with high accuracy. It leverages fractal pullback logic to identify market swing points and confirm whether a directional change has occurred.
This indicator detects swing highs and lows based on fractal behavior, drawing zigzag lines to connect these key pivot points. It classifies and labels each structural point as either a Higher High (HH), Higher Low (HL), Lower High (LH), or Lower Low (LL). Internal shifts are marked using triangle symbols on the chart, distinguishing bullish from bearish developments.
Break of Structure events are confirmed when price closes beyond the most recent swing high or low, and a horizontal line is drawn at the breakout level. This helps traders validate when a structural trend change is underway.
Users can configure the lookback period that defines the sensitivity of the pullback detection, as well as a timeframe multiplier to align the logic with higher timeframes such as 4H or Daily. There are visual customization settings for the zigzag lines and BoS markers, including color, width, and style (solid, dotted, or dashed).
Alerts are available for each key structural label—HH, HL, LH, LL—as well as for BoS events. These alerts are filtered through a selectable alert mode that separates signals by timeframe category: Low Timeframe (LTF), Medium Timeframe (MTF), and High Timeframe (HTF). Each mode allows the user to receive alerts only when relevant to their strategy.
This indicator excels in trend confirmation and reversal detection. Traders can use it to identify developing structure, validate internal shifts, and anticipate breakout continuation or rejection. It is particularly useful for Smart Money Concept (SMC) traders, swing traders, and those looking to refine entries and exits based on price structure rather than lagging indicators.
Visual clarity, adaptable timeframe logic, and precise structural event detection make this tool a valuable addition to any price action trader’s toolkit.

Fractal Wave MarkerFractal Wave Marker is an indicator that processes relative extremes of fluctuating prices within 2 periodical aspects. The special labeling system detects and visually marks multi-scale turning points, letting you visualize fractal echoes within unfolding cycles dynamically.
What This Indicator Does
Identifies major and minor swing highs/lows based on adjustable period.
Uses Phi in power exponent to compute a higher-degree swing filter.
Labels of higher degree appear only after confirmed base swings — no phantom levels, no hindsight bias. What you see is what the market has validated.
Swing points unfold in a structured, alternating rhythm . No two consecutive pivots share the same hierarchical degree!
Inspired by the Fractal Market Hypothesis, this script visualizes the principle that market behavior repeats across time scales, revealing structured narrative of "random walk". This inherent sequencing ensures fractal consistency across timeframes. "Fractal echoes" demonstrate how smaller price swings can proportionally mirror larger ones in both structure and timing, allowing traders to anticipate movements by recursive patterns. Cycle Transitions highlight critical inflection points where minor pivots flip polarity such as a series of lower highs progress into higher highs—signaling the birth of a new macro trend. A dense dense clusters of swing points can indicate Liquidity Zones, acting as footprints of institutional accumulation or distribution where price action validates supply and demand imbalances.
Visualization of nested cycles within macro trend anchors - a main feature specifically designed for the chartists who prioritize working with complex wave oscillations their analysis.

_D4X_Fractal StructureThis script will show up to three different timeframe structure based on fractal formation (combination of three candles where the middle one is the highest).
You can modify each of the timeframes (called factors in the script). These factors emulate the fractal formations on the timeframe specified (in minutes). I found that at least for me a combination of 1-10-100 works well if you use the 1 minute timeframe, but you can try different combinations to see long term structures o more short term structures.
There are a couple of things I would like to add later on, for example, to select dots instead of lines to show structure or adding orderblocks based on the fractal formations (as this would emulate higher timeframe OBs). As soon as I can, I will add these.
Let me know if you like it!!!

Fractal Break Imbalance / Fair Value Gap (FVG) / Liquidity VoidFractal Break Imbalance / Fair Value Gap (FVG) / Liquidity Void
Order imbalances in either direction, either excess buy or sell orders, reduce liquidity. The market will seek to fill gaps sooner or later. The script marks an imbalance / FVG after a fractal break. It also marks any other imbalance.
Default Colours:
Green - Imbalance after fractal break to the upside
Red - Imbalance after fractal break to the downside
Yellow - Other imbalances
How To Use:
Gaps can be used to determine possible entries and targets. Those familiar with liquidity raids, supply and demand, and ICT concepts may realise it's potential.
Indicator in use:
