Indicator Functions with Factor and HeikinAshiHello all,
This indicator returns below selected indicators values with entered parameters.
Also you can add factorization, functions candles, function HeikinAshi and more to the plot.
VERSION:
Version 1: returns series only source and Length with already defined default values
Version 2: returns series with source, Length, p1 and p2 parameters according to the indicator definition (ex: )
PARAMETERS p1 p2
for defining multi arguments (See indicators list) indicator input value usable with verison=V2 selected.. ex: for alma( src , len ,offset=0.85,sigma=6), set source=source, len=length, p1=0.85 an p2=6
FACTOR:
Add double triple, Quadruple factors to selected indicator (like converting EMA to 2-DEMA, 3-TEMA, 4-QEMA...)
1-Original
2-Double
3-Triple
4-Quadruple
LOG
Log: Use log, log10 on function entries
PLOTTING:
PType: Plotting type of the function on the screen
Original :use original values
Org. Range (-1,1): usable for indicators between range -1 and 1
Stochastic: Convert indicator values by using stochastic calculation between -1 & 1. (use AT/% length to better view)
PercentRank: Convert indicator values by using Percent Rank calculation between -1 & 1. (use AT/% length to better view)
ST/%: length for plotting Type for stochastic and Percent Rank options
Smooth: Use SWMA for smoothing the function
DISPLAY TYPES
Plot Candles: Display the selected indicator as candle by implementing values
Plot Ind: Display result of indicator with selected source
HeikinAshi: Display Selected indicator candles with Heikin Ashi calculation
INDICATOR LIST:
hide = 'DONT DISPLAY', //Dont display & calculate the indicator. (For my framework usage)
alma = 'alma( src , len ,offset=0.85,sigma=6)', // Arnaud Legoux Moving Average
ama = 'ama( src , len ,fast=14,slow=100)', //Adjusted Moving Average
acdst = 'accdist()', // Accumulation/distribution index.
cma = 'cma( src , len )', //Corrective Moving average
dema = 'dema( src , len )', // Double EMA (Same as EMA with 2 factor)
ema = 'ema( src , len )', // Exponential Moving Average
gmma = 'gmma( src , len )', //Geometric Mean Moving Average
hghst = 'highest( src , len )', //Highest value for a given number of bars back.
hl2ma = 'hl2ma( src , len )', //higest lowest moving average
hma = 'hma( src , len )', // Hull Moving Average .
lgAdt = 'lagAdapt( src , len ,perclen=5,fperc=50)', //Ehler's Adaptive Laguerre filter
lgAdV = 'lagAdaptV( src , len ,perclen=5,fperc=50)', //Ehler's Adaptive Laguerre filter variation
lguer = 'laguerre( src , len )', //Ehler's Laguerre filter
lsrcp = 'lesrcp( src , len )', //lowest exponential esrcpanding moving line
lexp = 'lexp( src , len )', //lowest exponential expanding moving line
linrg = 'linreg( src , len ,loffset=1)', // Linear regression
lowst = 'lowest( src , len )', //Lovest value for a given number of bars back.
pcnl = 'percntl( src , len )', //percentile nearest rank. Calculates percentile using method of Nearest Rank.
pcnli = 'percntli( src , len )', //percentile linear interpolation. Calculates percentile using method of linear interpolation between the two nearest ranks.
rema = 'rema( src , len )', //Range EMA (REMA)
rma = 'rma( src , len )', //Moving average used in RSI . It is the exponentially weighted moving average with alpha = 1 / length.
sma = 'sma( src , len )', // Smoothed Moving Average
smma = 'smma( src , len )', // Smoothed Moving Average
supr2 = 'super2( src , len )', //Ehler's super smoother, 2 pole
supr3 = 'super3( src , len )', //Ehler's super smoother, 3 pole
strnd = 'supertrend( src , len ,period=3)', //Supertrend indicator
swma = 'swma( src , len )', //Sine-Weighted Moving Average
tema = 'tema( src , len )', // Triple EMA (Same as EMA with 3 factor)
tma = 'tma( src , len )', //Triangular Moving Average
vida = 'vida( src , len )', // Variable Index Dynamic Average
vwma = 'vwma( src , len )', // Volume Weigted Moving Average
wma = 'wma( src , len )', //Weigted Moving Average
angle = 'angle( src , len )', //angle of the series (Use its Input as another indicator output)
atr = 'atr( src , len )', // average true range . RMA of true range.
bbr = 'bbr( src , len ,mult=1)', // bollinger %%
bbw = 'bbw( src , len ,mult=2)', // Bollinger Bands Width . The Bollinger Band Width is the difference between the upper and the lower Bollinger Bands divided by the middle band.
cci = 'cci( src , len )', // commodity channel index
cctbb = 'cctbbo( src , len )', // CCT Bollinger Band Oscilator
chng = 'change( src , len )', //Difference between current value and previous, source - source.
cmo = 'cmo( src , len )', // Chande Momentum Oscillator . Calculates the difference between the sum of recent gains and the sum of recent losses and then divides the result by the sum of all price movement over the same period.
cog = 'cog( src , len )', //The cog (center of gravity ) is an indicator based on statistics and the Fibonacci golden ratio.
cpcrv = 'copcurve( src , len )', // Coppock Curve. was originally developed by Edwin "Sedge" Coppock (Barron's Magazine, October 1962).
corrl = 'correl( src , len )', // Correlation coefficient . Describes the degree to which two series tend to deviate from their ta. sma values.
count = 'count( src , len )', //green avg - red avg
dev = 'dev( src , len )', //ta.dev() Measure of difference between the series and it's ta. sma
fall = 'falling( src , len )', //ta.falling() Test if the `source` series is now falling for `length` bars long. (Use its Input as another indicator output)
kcr = 'kcr( src , len ,mult=2)', // Keltner Channels Range
kcw = 'kcw( src , len ,mult=2)', //ta.kcw(). Keltner Channels Width. The Keltner Channels Width is the difference between the upper and the lower Keltner Channels divided by the middle channel.
macd = 'macd( src , len )', // macd
mfi = 'mfi( src , len )', // Money Flow Index
nvi = 'nvi()', // Negative Volume Index
obv = 'obv()', // On Balance Volume
pvi = 'pvi()', // Positive Volume Index
pvt = 'pvt()', // Price Volume Trend
rise = 'rising( src , len )', //ta.rising() Test if the `source` series is now rising for `length` bars long. (Use its Input as another indicator output)
roc = 'roc( src , len )', // Rate of Change
rsi = 'rsi( src , len )', // Relative strength Index
smosc = 'smi_osc( src , len ,fast=5, slow=34)', //smi Oscillator
smsig = 'smi_sig( src , len ,fast=5, slow=34)', //smi Signal
stdev = 'stdev( src , len )', //Standart deviation
trix = 'trix( src , len )' , //the rate of change of a triple exponentially smoothed moving average .
tsi = 'tsi( src , len )', //True Strength Index
vari = 'variance( src , len )', //ta.variance(). Variance is the expectation of the squared deviation of a series from its mean (ta. sma ), and it informally measures how far a set of numbers are spread out from their mean.
wilpc = 'willprc( src , len )', // Williams %R
wad = 'wad()', // Williams Accumulation/Distribution .
wvad = 'wvad()' //Williams Variable Accumulation/Distribution
I will update the indicator list when I will update the library
Thanks to tradingview, @RodrigoKazuma for their open source indicators
ابحث في النصوص البرمجية عن "KELTNER"

lib_Indicators_v2_DTULibrary "lib_Indicators_v2_DTU"
This library functions returns included Moving averages, indicators with factorization, functions candles, function heikinashi and more.
Created it to feed as backend of my indicator/strategy "Indicators & Combinations Framework Advanced v2 " that will be released ASAP.
This is replacement of my previous indicator (lib_indicators_DT)
I will add an indicator example which will use this indicator named as "lib_indicators_v2_DTU example" to help the usage of this library
Additionally library will be updated with more indicators in the future
NOTES:
Indicator functions returns only one series :-(
plotcandle function returns candle series
INDICATOR LIST:
hide = 'DONT DISPLAY', //Dont display & calculate the indicator. (For my framework usage)
alma = 'alma(src,len,offset=0.85,sigma=6)', //Arnaud Legoux Moving Average
ama = 'ama(src,len,fast=14,slow=100)', //Adjusted Moving Average
acdst = 'accdist()', //Accumulation/distribution index.
cma = 'cma(src,len)', //Corrective Moving average
dema = 'dema(src,len)', //Double EMA (Same as EMA with 2 factor)
ema = 'ema(src,len)', //Exponential Moving Average
gmma = 'gmma(src,len)', //Geometric Mean Moving Average
hghst = 'highest(src,len)', //Highest value for a given number of bars back.
hl2ma = 'hl2ma(src,len)', //higest lowest moving average
hma = 'hma(src,len)', //Hull Moving Average.
lgAdt = 'lagAdapt(src,len,perclen=5,fperc=50)', //Ehler's Adaptive Laguerre filter
lgAdV = 'lagAdaptV(src,len,perclen=5,fperc=50)', //Ehler's Adaptive Laguerre filter variation
lguer = 'laguerre(src,len)', //Ehler's Laguerre filter
lsrcp = 'lesrcp(src,len)', //lowest exponential esrcpanding moving line
lexp = 'lexp(src,len)', //lowest exponential expanding moving line
linrg = 'linreg(src,len,loffset=1)', //Linear regression
lowst = 'lowest(src,len)', //Lovest value for a given number of bars back.
pcnl = 'percntl(src,len)', //percentile nearest rank. Calculates percentile using method of Nearest Rank.
pcnli = 'percntli(src,len)', //percentile linear interpolation. Calculates percentile using method of linear interpolation between the two nearest ranks.
rema = 'rema(src,len)', //Range EMA (REMA)
rma = 'rma(src,len)', //Moving average used in RSI. It is the exponentially weighted moving average with alpha = 1 / length.
sma = 'sma(src,len)', //Smoothed Moving Average
smma = 'smma(src,len)', //Smoothed Moving Average
supr2 = 'super2(src,len)', //Ehler's super smoother, 2 pole
supr3 = 'super3(src,len)', //Ehler's super smoother, 3 pole
strnd = 'supertrend(src,len,period=3)', //Supertrend indicator
swma = 'swma(src,len)', //Sine-Weighted Moving Average
tema = 'tema(src,len)', //Triple EMA (Same as EMA with 3 factor)
tma = 'tma(src,len)', //Triangular Moving Average
vida = 'vida(src,len)', //Variable Index Dynamic Average
vwma = 'vwma(src,len)', //Volume Weigted Moving Average
wma = 'wma(src,len)', //Weigted Moving Average
angle = 'angle(src,len)', //angle of the series (Use its Input as another indicator output)
atr = 'atr(src,len)', //average true range. RMA of true range.
bbr = 'bbr(src,len,mult=1)', //bollinger %%
bbw = 'bbw(src,len,mult=2)', //Bollinger Bands Width. The Bollinger Band Width is the difference between the upper and the lower Bollinger Bands divided by the middle band.
cci = 'cci(src,len)', //commodity channel index
cctbb = 'cctbbo(src,len)', //CCT Bollinger Band Oscilator
chng = 'change(src,len)', //Difference between current value and previous, source - source .
cmo = 'cmo(src,len)', //Chande Momentum Oscillator. Calculates the difference between the sum of recent gains and the sum of recent losses and then divides the result by the sum of all price movement over the same period.
cog = 'cog(src,len)', //The cog (center of gravity) is an indicator based on statistics and the Fibonacci golden ratio.
cpcrv = 'copcurve(src,len)', //Coppock Curve. was originally developed by Edwin "Sedge" Coppock (Barron's Magazine, October 1962).
corrl = 'correl(src,len)', //Correlation coefficient. Describes the degree to which two series tend to deviate from their ta.sma values.
count = 'count(src,len)', //green avg - red avg
dev = 'dev(src,len)', //ta.dev() Measure of difference between the series and it's ta.sma
fall = 'falling(src,len)', //ta.falling() Test if the `source` series is now falling for `length` bars long. (Use its Input as another indicator output)
kcr = 'kcr(src,len,mult=2)', //Keltner Channels Range
kcw = 'kcw(src,len,mult=2)', //ta.kcw(). Keltner Channels Width. The Keltner Channels Width is the difference between the upper and the lower Keltner Channels divided by the middle channel.
macd = 'macd(src,len)', //macd
mfi = 'mfi(src,len)', //Money Flow Index
nvi = 'nvi()', //Negative Volume Index
obv = 'obv()', //On Balance Volume
pvi = 'pvi()', //Positive Volume Index
pvt = 'pvt()', //Price Volume Trend
rise = 'rising(src,len)', //ta.rising() Test if the `source` series is now rising for `length` bars long. (Use its Input as another indicator output)
roc = 'roc(src,len)', //Rate of Change
rsi = 'rsi(src,len)', //Relative strength Index
smosc = 'smi_osc(src,len,fast=5, slow=34)', //smi Oscillator
smsig = 'smi_sig(src,len,fast=5, slow=34)', //smi Signal
stdev = 'stdev(src,len)', //Standart deviation
trix = 'trix(src,len)' , //the rate of change of a triple exponentially smoothed moving average.
tsi = 'tsi(src,len)', //True Strength Index
vari = 'variance(src,len)', //ta.variance(). Variance is the expectation of the squared deviation of a series from its mean (ta.sma), and it informally measures how far a set of numbers are spread out from their mean.
wilpc = 'willprc(src,len)', //Williams %R
wad = 'wad()', //Williams Accumulation/Distribution.
wvad = 'wvad()' //Williams Variable Accumulation/Distribution.
}
f_func(string, float, simple, float, float, float, simple) f_func Return selected indicator value with different parameters. New version. Use extra parameters for available indicators
Parameters:
string : FuncType_ indicator from the indicator list
float : src_ close, open, high, low,hl2, hlc3, ohlc4 or any
simple : int length_ indicator length
float : p1 extra parameter-1. active on Version 2 for defining multi arguments indicator input value. ex: lagAdapt(src_, length_,LAPercLen_=p1,FPerc_=p2)
float : p2 extra parameter-2. active on Version 2 for defining multi arguments indicator input value. ex: lagAdapt(src_, length_,LAPercLen_=p1,FPerc_=p2)
float : p3 extra parameter-3. active on Version 2 for defining multi arguments indicator input value. ex: lagAdapt(src_, length_,LAPercLen_=p1,FPerc_=p2)
simple : int version_ indicator version for backward compatibility. V1:dont use extra parameters p1,p2,p3 and use default values. V2: use extra parameters for available indicators
Returns: float Return calculated indicator value
fn_heikin(float, float, float, float) fn_heikin Return given src data (open, high,low,close) as heikin ashi candle values
Parameters:
float : o_ open value
float : h_ high value
float : l_ low value
float : c_ close value
Returns: float heikin ashi open, high,low,close vlues that will be used with plotcandle
fn_plotFunction(float, string, simple, bool) fn_plotFunction Return input src data with different plotting options
Parameters:
float : src_ indicator src_data or any other series.....
string : plotingType Ploting type of the function on the screen
simple : int stochlen_ length for plotingType for stochastic and PercentRank options
bool : plotSWMA Use SWMA for smoothing Ploting
Returns: float
fn_funcPlotV2(string, float, simple, float, float, float, simple, string, simple, bool, bool) fn_funcPlotV2 Return selected indicator value with different parameters. New version. Use extra parameters fora available indicators
Parameters:
string : FuncType_ indicator from the indicator list
float : src_data_ close, open, high, low,hl2, hlc3, ohlc4 or any
simple : int length_ indicator length
float : p1 extra parameter-1. active on Version 2 for defining multi arguments indicator input value. ex: lagAdapt(src_, length_,LAPercLen_=p1,FPerc_=p2)
float : p2 extra parameter-2. active on Version 2 for defining multi arguments indicator input value. ex: lagAdapt(src_, length_,LAPercLen_=p1,FPerc_=p2)
float : p3 extra parameter-3. active on Version 2 for defining multi arguments indicator input value. ex: lagAdapt(src_, length_,LAPercLen_=p1,FPerc_=p2)
simple : int version_ indicator version for backward compatibility. V1:dont use extra parameters p1,p2,p3 and use default values. V2: use extra parameters for available indicators
string : plotingType Ploting type of the function on the screen
simple : int stochlen_ length for plotingType for stochastic and PercentRank options
bool : plotSWMA Use SWMA for smoothing Ploting
bool : log_ Use log on function entries
Returns: float Return calculated indicator value
fn_factor(string, float, simple, float, float, float, simple, simple, string, simple, bool, bool) fn_factor Return selected indicator's factorization with given arguments
Parameters:
string : FuncType_ indicator from the indicator list
float : src_data_ close, open, high, low,hl2, hlc3, ohlc4 or any
simple : int length_ indicator length
float : p1 parameter-1. active on Version 2 for defining multi arguments indicator input value. ex: lagAdapt(src_, length_,LAPercLen_=p1,FPerc_=p2)
float : p2 parameter-2. active on Version 2 for defining multi arguments indicator input value. ex: lagAdapt(src_, length_,LAPercLen_=p1,FPerc_=p2)
float : p3 parameter-3. active on Version 2 for defining multi arguments indicator input value. ex: lagAdapt(src_, length_,LAPercLen_=p1,FPerc_=p2)
simple : int version_ indicator version for backward compatibility. V1:dont use extra parameters p1,p2,p3 and use default values. V2: use extra parameters for available indicators
simple : int fact_ Add double triple, Quatr factor to selected indicator (like converting EMA to 2-DEMA, 3-TEMA, 4-QEMA...)
string : plotingType Ploting type of the function on the screen
simple : int stochlen_ length for plotingType for stochastic and PercentRank options
bool : plotSWMA Use SWMA for smoothing Ploting
bool : log_ Use log on function entries
Returns: float Return result of the function
fn_plotCandles(string, simple, float, float, float, simple, string, simple, bool, bool, bool) fn_plotCandles Return selected indicator's candle values with different parameters also heikinashi is available
Parameters:
string : FuncType_ indicator from the indicator list
simple : int length_ indicator length
float : p1 parameter-1. active on Version 2 for defining multi arguments indicator input value. ex: lagAdapt(src_, length_,LAPercLen_=p1,FPerc_=p2)
float : p2 parameter-2. active on Version 2 for defining multi arguments indicator input value. ex: lagAdapt(src_, length_,LAPercLen_=p1,FPerc_=p2)
float : p3 parameter-3. active on Version 2 for defining multi arguments indicator input value. ex: lagAdapt(src_, length_,LAPercLen_=p1,FPerc_=p2)
simple : int version_ indicator version for backward compatibility. V1:dont use extra parameters p1,p2,p3 and use default values. V2: use extra parameters for available indicators
string : plotingType Ploting type of the function on the screen
simple : int stochlen_ length for plotingType for stochastic and PercentRank options
bool : plotSWMA Use SWMA for smoothing Ploting
bool : log_ Use log on function entries
bool : plotheikin_ Use Heikin Ashi on Plot
Returns: float

Bull Call Spread Entry StrategyThis strategy script uses the "Spread Entry Strength" overlay indicator script I designed to show entry timing optimized for an Option Bull
Call Spread.
As for this strategy...
The defaults for the strategy itself are as follows:
Period for strategy: 1/1/18 to 12/1/2021. This can be changed to a different period using the settings.
Condition for entry:
Bull Spread Entry Strength >= "Overlay Signal Strength Level"
Limit entry is used, price must be <= close when signaled
Entry occurs by next day or the order is cancelled
Condition for exit (uses a timed exit):
Bars passed since order entry >= 30 (6 weeks..~42 calendar days)
Thursday (day before "option" expiration date... assuming weekly options exist)
All of the user settings from the overlay are pulled into this for customization purposes. Details of the actual Spread Entry Strength overlay are as follows (copied from my shared indicator):
2 background shadings will occur:
The background will shade blue if the ticker is prime for a Bullish Call spread.
The background will shade purple if the the ticker is prime for a Bearish Put spread.
In theory, if the SE Strength is at one of the extremes of the Bear or Bull side, then a spread is prime for entry.
To calculate this, 8 conditions receive a 1 or zero dependent on whether the condition is true (1) or false (0), and then all of those are summed. The primary gist of the strength comes from Nishant's book, or my interpretation thereof, with some additives that limits what I need to review (such as condition 8 below.)
The 8 Bull Conditions are:
1) Bollinger Bands are outside of the Keltner Channels
2) ADX is trending up
3) RSI is trending up
4) -DI is trending down
5) RSI is under 30
6) Price is below the lower Keltner Channel
7) Price is between the lower Bollinger Band and the Bollinger basis.
8) Price at one point within the last 5 bars was below the lower Bollinger Band
The 8 Bear Conditions are the inverse conditions (except the first):
1) Bollinger Bands are outside of the Keltner Channels
2) ADX is trending down
3) RSI is trending down
4) +DI is trending up
5) RSI is over 70
6) Price is above the upper Keltner Channel
7) Price is between the upper Bollinger Band and the Bollinger basis.
8) Price at one point within the last 5 bars was above the upper Bollinger Band
There is a "market noise" filter that will filter out shading when another market move is considered, i.e. if you don't want to see the potential trade when QQQ moves more than 1% then do the following in the settings:
Check "Market Filter"
Enter QQQ in the "Market Ticker To Use"
Enter 1 in the "Market Too Hot Level"
Press Ok
Obviously, the same holds true for the "Market Too Cool Filter."
Second release notes:
Overlay Signal Strength Level - You can set your own "level" for the overlay in the settings, instead of having to change the script code itself. I have the default set to 6. A lower number shows more overlays, a higher number shows fewer (i.e. more conditions have been met.).
Provide Narrative (Troubleshooting) - Narrative label created with several outputs that will show after the last bar. This narrative needs to be turned on in the settings, as the default is "off" ... unchecked.
Remove Strength Indicator When Squeezed - when checked no overlays will be produced regardless of "scoring." Default is off.
Show Squeezes (Will Override Indicator When Concurrent) - overlays an orange background when the ticker is in a squeeze. I am still working on the accuracy here, but it's usable. This will override the strength indicator as well. This needs to be turned on, if you want it.
Short SMA Period - period used to calculate the short SMA, used in the narrative only, at this point in time.
Medium SMA Period - period used to calculate the medium SMA, used in the narrative only, at this point in time.
Long SMA Period - period used to calculate the medium SMA, used in the narrative only, at this point in time.
Outside of the settings... a few calculation adjustments here and there have occurred and some color shading adjustments to allow for the adjustable level setting.

Penguin Volatility State StrategyThe Penguin Volatility State Strategy is a comprehensive technical analysis framework designed to identify the underlying "state" or "regime" of the market. Instead of just providing simple buy or sell signals, its primary goal is to classify the market into one of four distinct states by combining trend, momentum, and volatility analysis.
The core idea is to trade only when these three elements align, focusing on periods of volatility expansion (a "squeeze breakout") that occur in the direction of a confirmed trend and are supported by strong momentum.
Key Components
The strategy is built upon two main engines
The Volatility Engine (Bollinger Bands vs. Keltner Channels)
This engine detects periods of rapidly increasing volatility. It measures the percentage difference (diff) between the upper bands of Bollinger Bands (which are based on standard deviation) and Keltner Channels (based on Average True Range). During a volatility "squeeze," both bands are close. When price breaks out, the Bollinger Band expands much faster than the Keltner Channel, causing the diff value to become positive. A positive diff signals a volatility breakout, which is the moment the strategy becomes active.
The Trend & Momentum Engine (Multi-EMA System)
This engine determines the market's direction and strength. It uses:
A Fast EMA (e.g., 12-period) and a Slow EMA (e.g., 26-period): The crossover of these two moving averages defines the primary, underlying trend (similar to a MACD).
An Ultra-Fast EMA (e.g., 2-period of ohlc4): This is used to measure the immediate, short-term momentum of the price.
The Four Market States
By combining the Trend and Momentum engines, the strategy categorizes the market into four visually distinct states, represented by the chart's background color. This is the most crucial aspect of the system.
💚 Green State: Strong Bullish
The primary trend is UP (Fast EMA > Slow EMA) AND the immediate momentum is STRONG (Price > Fast EMA).
Interpretation: This represents a healthy, robust uptrend where both the underlying trend and short-term price action are aligned. It is considered the safest condition for taking long positions.
❤️ Red State: Strong Bearish
Condition: The primary trend is DOWN (Fast EMA < Slow EMA) AND the immediate momentum is WEAK (Price < Fast EMA).
Interpretation: This represents a strong, confirmed downtrend. It is considered the safest condition for taking short positions.
💛 Yellow State: Weakening Bullish / Pullback
Condition: The primary trend is UP (Fast EMA > Slow EMA) BUT the immediate momentum is WEAK (Price < Fast EMA).
Interpretation: This is a critical warning signal for bulls. While the larger trend is still up, the short-term price action is showing weakness. This could be a minor pullback, a period of consolidation, or the very beginning of a trend reversal. Caution is advised.
💙 Blue State: Weakening Bearish / Relief Rally
Condition: The primary trend is DOWN (Fast EMA < Slow EMA) BUT the immediate momentum is STRONG (Price > Fast EMA).
Interpretation: This signals that a downtrend is losing steam. It often represents a short-covering rally (a "bear market rally") or the first potential sign of a market bottom. Bears should be cautious and consider taking profits.
How the Strategy Functions
The strategy uses these four states as its foundation for making trading decisions. The entry and exit arrows (Long, Short, Close) are generated based on a set of rules that can be customized by the user. For instance, a trader can configure the strategy to
Only take long trades during the Green State.
Require a confirmed volatility breakout (diff > 0) before entering a trade.
Use the "RSI on Diff" indicator to ensure that the breakout is supported by accelerating momentum.
Summary
In essence, the Penguin Volatility State Strategy provides a powerful "dashboard" for viewing the market. It moves beyond simple indicators to offer a contextual understanding of price action. By waiting for the alignment of Trend (the State), Volatility (the Breakout), and Momentum (the Acceleration), it helps traders to identify higher-probability setups and, just as importantly, to know when it is better to stay out of the market.
License / disclaimer
© waranyu.trkm — MIT License. Educational use only; not financial advice.

Penguin Trend with RSI on DiffVisualizes volatility regime via the percent spread between the upper Bollinger Band and the upper Keltner Channel, with bar colors from a lightweight trend engine and an RSI computed on the Diff signal. Supports SMA/EMA/WMA/RMA/HMA/VWMA/VWAP and an optional calculation timeframe. Defaults preserve the original look and behavior.
Penguin Trend with RSI on Diff shows expansion vs. compression in price action by comparing two classic volatility envelopes. It computes:
Diff% = (UpperBB − UpperKC) / UpperKC × 100
• Diff > 0: Bollinger Bands are wider than Keltner Channels → expansion / momentum regime
• Diff < 0: BB narrower than KC → compression / squeeze regime
A white “Average Diff” line smooths Diff% (default: SMA(5)) to highlight regime shifts. Bars are colored only when Diff > 0 to focus on expansion phases. A lightweight trend engine defines four states from a fast/slow MA bias and a short “thrust” MA on ohlc4:
• Green: Bullish bias and thrust > fast MA (healthy upside thrust)
• Red: Bearish bias and thrust < fast MA (healthy downside thrust)
• Yellow: Bullish bias but thrust ≤ fast MA (pullback/weakness)
• Blue: Bearish bias but thrust ≥ fast MA (bear rally/short squeeze)
RSI on Diff:
The indicator adds an RSI applied to Diff% to gauge momentum of the expansion/compression signal itself. Choose between Built-in RSI or a manual RMA-based computation, and optionally smooth it. Default OB/OS lines are 70/30.
How it works:
• Bollinger Bands (BB): Basis = selected MA of src (default SMA(20)); Width = StdDev × Mult (default 2.0)
• Keltner Channels (KC): Basis = selected MA of src (default SMA(20)); Width = ATR(kcATR) × Mult (defaults 20 and 2.0)
• Diff%: Safe division guards against division-by-zero
• MA engine: Select SMA / EMA / WMA / RMA / HMA / VWMA / VWAP for BB/KC bases, Average Diff, and trend components (VWAP is session-anchored)
• Calculation timeframe: Compute internals on a chosen TF via request.security() while viewing any chart TF
Inputs (key):
• Calculation timeframe: Empty = chart TF; set e.g., 60/240 to compute on that TF
• BB: Length, StdDev Mult, MA Type
• KC: Basis Length, ATR Length, Multiplier, MA Type
• Average Diff: Length and MA Type
• RSI on Diff: RSI Length, Method (Built-in or Manual RMA), Smoothing Length, OB/OS levels, show/hide
• Trend Engine: Fast/Slow lengths & MA type, Signal (kept for completeness), Thrust MA length & type
• Display/Visibility: Paint bars only when Diff > 0; show zero line; “true Blue” color toggle; show/hide Diff columns and Average Diff
How to use:
1. Regime changes: Watch Diff% or Average Diff crossing 0. Above zero favors momentum/continuation setups; below zero suggests compression and potential breakout conditions.
2. State confirmation: During expansion (Diff > 0), prioritize Green/Red for aligned thrust; treat Yellow/Blue as cautionary/contrarian.
3. RSI on Diff: Use OB/OS and crossovers for timing entries/exits or for confirming/negating expansion strength.
Alerts:
• Diff crosses above/below 0
• Average Diff crosses above/below 0
• RSI(Diff) crosses above OB / below OS
• State changes: GREEN / RED / YELLOW / BLUE
Notes & limitations:
• VWAP is session-anchored and best on intraday data. If not applicable on the selected calculation TF, the script automatically falls back to EMA.
• Defaults (SMA(20) for BB/KC, multipliers 2.0, SMA(5) Average Diff, original trend coloring and bar painting) preserve the original appearance.
• RSI on Diff is plotted in the same pane for a compact workflow; you can hide it or split into a separate indicator if desired.
Release notes:
v6.0 — Upgraded to Pine v6. Added multi-MA options (SMA/EMA/WMA/RMA/HMA/VWMA/VWAP), calculation timeframe, RSI on Diff (Built-in or Manual RMA) with smoothing, safe division guard, optional zero line, and optional true Blue color. Defaults retain the original behavior.
License / disclaimer:
© waranyu.trkm — MIT License. Educational use only; not financial advice.

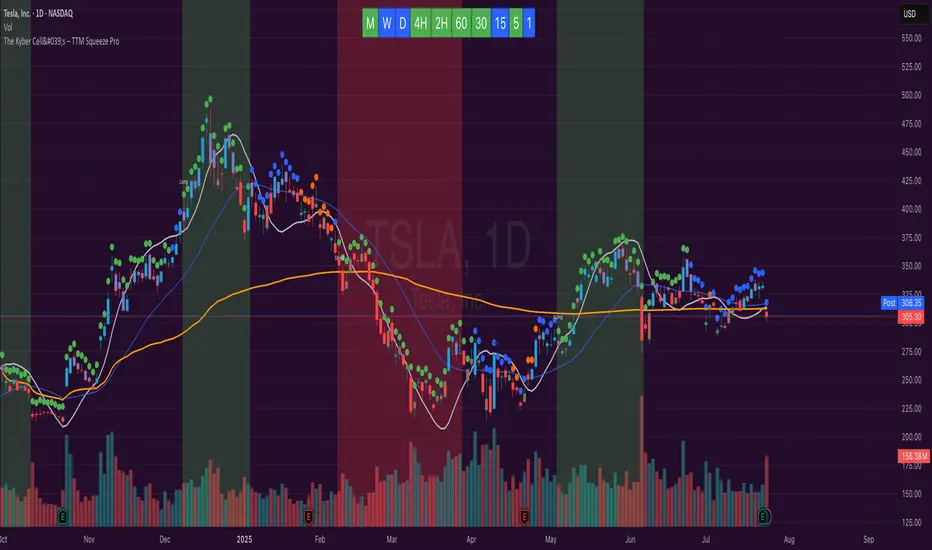
The Kyber Cell's – TTM Squeeze ProThe Kyber Cell’s TTM Squeeze Pro
TTM Squeeze + ALMA + VWAP for Precision Trade Timing
⸻
1. Introduction
Kyber Cell’s Squeeze Pro is a comprehensive, all-in-one overlay indicator built on top of John Carter’s famous TTM Squeeze concept. It integrates advanced momentum and trend analysis using Arnaud Legoux Moving Averages (ALMA), a scroll-aware VWAP with optional deviation bands, and a clean, user-friendly visual system. The goal is simple: give traders a clear and configurable chart that identifies price compression, detects release moments, confirms direction, and helps manage risk and reward visually and effectively.
This tool is intended for traders of all styles — scalpers, swing traders, or intraday strategists — looking for cleaner signals, better visual cues, and more confidence in entry/exit timing.
⸻
2. Core Concepts
At its heart, the Squeeze Pro builds an in-chart visualization of the TTM Squeeze, a strategy that identifies when price volatility compresses inside a Bollinger Band that is narrower than a Keltner Channel. These moments often precede explosive breakouts. This version categorizes squeezes into three levels of compression:
• Blue Dot – Low Compression
• Orange Dot – Medium Compression
• Red Dot – High Compression
When the squeeze “fires” (i.e., the Bollinger Bands expand beyond all Keltner thresholds), the indicator flips to a Green Dot, signaling potential entry if confirmed by trend direction.
The indicator also includes a momentum model using linear regression on smoothed price deviation to determine directional bias. Momentum is further reinforced by a customizable trend engine, allowing you to switch between EMA-21 or HMA 34/144 logic.
An ALMA ribbon is plotted across the chart to represent smoothed trend strength with minimal lag, and a scroll-aware VWAP (Volume-Weighted Average Price) line, optionally with ±σ bands, helps confirm mean-reversion or momentum continuation setups.
⸻
3. Visual Components
Squeeze Pro replaces the traditional histogram with bar coloring logic based on your selected overlay mode:
• Momentum Mode colors bars based on whether momentum is rising or falling and in which direction (aqua/blue for bullish, red/yellow for bearish).
• Trend Mode colors bars using EMA or HMA logic to identify whether price is in a bullish, bearish, or neutral trend state.
A colored backdrop is triggered when a squeeze fires and momentum direction is confirmed. It remains green for bullish runs and red for bearish runs. The background disappears when the trend exhausts or reverses.
Each squeeze level (low, medium, high) is plotted as tiny dots above or below candles, with configurable colors. On the exact bar where the squeeze fires, the indicator optionally plots entry markers — either arrows or triangles — which can be placed with adjustable padding using ATR. These provide an at-a-glance signal of possible long or short entries.
EXPERIMENTAL : For risk and reward management, protective stop lines and limit targets can be toggled on. Stops are calculated using either recent swing highs/lows or a fixed ATR multiple, depending on user preference. Limit targets are calculated from entry price using ATR-based projections.
All colors are customizable.
⸻
4. Multi-Timeframe Squeeze Panel
An optional MTF Squeeze Panel appears in the top-right corner of the chart, displaying the squeeze status across multiple timeframes — from 1-minute to Monthly. Each timeframe is color-coded:
• Red for High Compression
• Orange for Medium Compression
• Blue for Low Compression
• Yellow for Open/No Compression
This provides rapid context for whether multiple timeframes are simultaneously compressing (a common precursor to explosive moves), helping traders align higher- and lower-timeframe signals. Colors are customizable.
The MTF panel dynamically adjusts to chart space and only renders the selected intervals for clarity and performance.
⸻
5. Inputs and Configuration Options
Squeeze Pro offers a rich configuration suite:
• Squeeze Settings: Control the Bollinger Band standard deviation, and three separate Keltner Channel multipliers (for low, medium, and high compression zones).
• ALMA Controls: Adjust the smoothing length, offset, and σ factor to control ribbon sensitivity.
• VWAP Options: Toggle VWAP on/off and optionally show ±σ bands for mean reversion signals.
• Entry Markers: Customize marker shape (arrow or triangle), size (tiny to huge), color, and padding using ATR multipliers.
• Stops and Targets:
• Choose between Swing High/Low or ATR-based stop logic.
• Define separate ATR lengths and multipliers for stops and targets.
• Independently toggle their visibility and color.
• Bar Coloring Mode: Select either Momentum or Trend logic for bar overlays.
• Trend Engine: Choose between EMA-21 or HMA 34/144 for identifying trend direction.
• Squeeze Dot Colors: Customize the colors for each compression level and release state.
• MTF Panel: Toggle visibility per timeframe — from 1m to Monthly.
This high degree of customization ensures that the indicator can adapt to nearly any trading style or preference.
⸻
6. Trade Workflow Suggestions
To get the most out of this tool, traders can follow a consistent workflow:
1. Watch Dot Progression: Blue → Orange → Red indicates increasing compression and likelihood of breakout.
2. Enter on Green Dot: When the squeeze fires (green dot), confirm entry direction with bar color and backdrop.
3. Use Confirmation Tools:
• ALMA should slope in the trade direction.
• VWAP should support the price move or confirm expansion away from mean.
4. Manage Risk and Reward (experimental):
• Respect stop-loss placements (Swing/ATR).
• Use ATR-based limit targets if enabled.
5. Exit:
• Consider exiting when momentum crosses zero.
• Or exit when the background color disappears, signaling potential trend exhaustion.
⸻
7. Alerts
Includes built-in alert conditions to notify you when a squeeze fires in either direction:
• “Squeeze Long”: Triggers when a green dot appears and momentum is bullish.
• “Squeeze Short”: Triggers when a green dot appears and momentum is bearish.
You can use these alerts for automation or to stay notified of new setups even when away from the screen.
⸻
8. Disclaimer
This indicator is designed for educational purposes only and should not be interpreted as financial advice. Trading is inherently risky, and any decisions based on this tool should be made with full awareness of personal risk tolerance and capital exposure.
Bober XM v2.0# ₿ober XM v2.0 Trading Bot Documentation
**Developer's Note**: While our previous Bot 1.3.1 was removed due to guideline violations, this setback only fueled our determination to create something even better. Rising from this challenge, Bober XM 2.0 emerges not just as an update, but as a complete reimagining with multi-timeframe analysis, enhanced filters, and superior adaptability. This adversity pushed us to innovate further and deliver a strategy that's smarter, more agile, and more powerful than ever before. Challenges create opportunity - welcome to Cryptobeat's finest work yet.
## !!!!You need to tune it for your own pair and timeframe and retune it periodicaly!!!!!
## Overview
The ₿ober XM v2.0 is an advanced dual-channel trading bot with multi-timeframe analysis capabilities. It integrates multiple technical indicators, customizable risk management, and advanced order execution via webhook for automated trading. The bot's distinctive feature is its separate channel systems for long and short positions, allowing for asymmetric trade strategies that adapt to different market conditions across multiple timeframes.
### Key Features
- **Multi-Timeframe Analysis**: Analyze price data across multiple timeframes simultaneously
- **Dual Channel System**: Separate parameter sets for long and short positions
- **Advanced Entry Filters**: RSI, Volatility, Volume, Bollinger Bands, and KEMAD filters
- **Machine Learning Moving Average**: Adaptive prediction-based channels
- **Multiple Entry Strategies**: Breakout, Pullback, and Mean Reversion modes
- **Risk Management**: Customizable stop-loss, take-profit, and trailing stop settings
- **Webhook Integration**: Compatible with external trading bots and platforms
### Strategy Components
| Component | Description |
|---------|-------------|
| **Dual Channel Trading** | Uses either Keltner Channels or Machine Learning Moving Average (MLMA) with separate settings for long and short positions |
| **MLMA Implementation** | Machine learning algorithm that predicts future price movements and creates adaptive bands |
| **Pivot Point SuperTrend** | Trend identification and confirmation system based on pivot points |
| **Three Entry Strategies** | Choose between Breakout, Pullback, or Mean Reversion approaches |
| **Advanced Filter System** | Multiple customizable filters with multi-timeframe support to avoid false signals |
| **Custom Exit Logic** | Exits based on OBV crossover of its moving average combined with pivot trend changes |
### Note for Novice Users
This is a fully featured real trading bot and can be tweaked for any ticker — SOL is just an example. It follows this structure:
1. **Indicator** – gives the initial signal
2. **Entry strategy** – decides when to open a trade
3. **Exit strategy** – defines when to close it
4. **Trend confirmation** – ensures the trade follows the market direction
5. **Filters** – cuts out noise and avoids weak setups
6. **Risk management** – controls losses and protects your capital
To tune it for a different pair, you'll need to start from scratch:
1. Select the timeframe (candle size)
2. Turn off all filters and trend entry/exit confirmations
3. Choose a channel type, channel source and entry strategy
4. Adjust risk parameters
5. Tune long and short settings for the channel
6. Fine-tune the Pivot Point Supertrend and Main Exit condition OBV
This will generate a lot of signals and activity on the chart. Your next task is to find the right combination of filters and settings to reduce noise and tune it for profitability.
### Default Strategy values
Default values are tuned for: Symbol BITGET:SOLUSDT.P 5min candle
Filters are off by default: Try to play with it to understand how it works
## Configuration Guide
### General Settings
| Setting | Description | Default Value |
|---------|-------------|---------------|
| **Long Positions** | Enable or disable long trades | Enabled |
| **Short Positions** | Enable or disable short trades | Enabled |
| **Risk/Reward Area** | Visual display of stop-loss and take-profit zones | Enabled |
| **Long Entry Source** | Price data used for long entry signals | hl2 (High+Low/2) |
| **Short Entry Source** | Price data used for short entry signals | hl2 (High+Low/2) |
The bot allows you to trade long positions, short positions, or both simultaneously. Each direction has its own set of parameters, allowing for fine-tuned strategies that recognize the asymmetric nature of market movements.
### Multi-Timeframe Settings
1. **Enable Multi-Timeframe Analysis**: Toggle 'Enable Multi-Timeframe Analysis' in the Multi-Timeframe Settings section
2. **Configure Timeframes**: Set appropriate higher timeframes based on your trading style:
- Timeframe 1: Default is now 15 minutes (intraday confirmation)
- Timeframe 2: Default is 4 hours (trend direction)
3. **Select Sources per Indicator**: For each indicator (RSI, KEMAD, Volume, etc.), choose:
- The desired timeframe (current, mtf1, or mtf2)
- The appropriate price type (open, high, low, close, hl2, hlc3, ohlc4)
### Entry Strategies
- **Breakout**: Enter when price breaks above/below the channel
- **Pullback**: Enter when price pulls back to the channel
- **Mean Reversion**: Enter when price is extended from the channel
You can enable different strategies for long and short positions.
### Core Components
### Risk Management
- **Position Size**: Control risk with percentage-based position sizing
- **Stop Loss Options**:
- Fixed: Set a specific price or percentage from entry
- ATR-based: Dynamic stop-loss based on market volatility
- Swing: Uses recent swing high/low points
- **Take Profit**: Multiple targets with percentage allocation
- **Trailing Stop**: Dynamic stop that follows price movement
## Advanced Usage Strategies
### Moving Average Type Selection Guide
- **SMA**: More stable in choppy markets, good for higher timeframes
- **EMA/WMA**: More responsive to recent price changes, better for entry signals
- **VWMA**: Adds volume weighting for stronger trends, use with Volume filter
- **HMA**: Balance between responsiveness and noise reduction, good for volatile markets
### Multi-Timeframe Strategy Approaches
- **Trend Confirmation**: Use higher timeframe RSI (mtf2) for overall trend, current timeframe for entries
- **Entry Precision**: Use KEMAD on current timeframe with volume filter on mtf1
- **False Signal Reduction**: Apply RSI filter on mtf1 with strict KEMAD settings
### Market Condition Optimization
| Market Condition | Recommended Settings |
|------------------|----------------------|
| **Trending** | Use Breakout strategy with KEMAD filter on higher timeframe |
| **Ranging** | Use Mean Reversion with strict RSI filter (mtf1) |
| **Volatile** | Increase ATR multipliers, use HMA for moving averages |
| **Low Volatility** | Decrease noise parameters, use pullback strategy |
## Webhook Integration
The strategy features a professional webhook system that allows direct connectivity to your exchange or trading platform of choice through third-party services like 3commas, Alertatron, or Autoview.
The webhook payload includes all necessary parameters for automated execution:
- Entry price and direction
- Stop loss and take profit levels
- Position size
- Custom identifier for webhook routing
## Performance Optimization Tips
1. **Start with Defaults**: Begin with the default settings for your timeframe before customizing
2. **Adjust One Component at a Time**: Make incremental changes and test the impact
3. **Match MA Types to Market Conditions**: Use appropriate moving average types based on the Market Condition Optimization table
4. **Timeframe Synergy**: Create logical relationships between timeframes (e.g., 5min chart with 15min and 4h higher timeframes)
5. **Periodic Retuning**: Markets evolve - regularly review and adjust parameters
## Common Setups
### Crypto Trend-Following
- MLMA with EMA or HMA
- Higher RSI thresholds (75/25)
- KEMAD filter on mtf1
- Breakout entry strategy
### Stock Swing Trading
- MLMA with SMA for stability
- Volume filter with higher threshold
- KEMAD with increased filter order
- Pullback entry strategy
### Forex Scalping
- MLMA with WMA and lower noise parameter
- RSI filter on current timeframe
- Use highest timeframe for trend direction only
- Mean Reversion strategy
## Webhook Configuration
- **Benefits**:
- Automated trade execution without manual intervention
- Immediate response to market conditions
- Consistent execution of your strategy
- **Implementation Notes**:
- Requires proper webhook configuration on your exchange or platform
- Test thoroughly with small position sizes before full deployment
- Consider latency between signal generation and execution
### Backtesting Period
Define a specific historical period to evaluate the bot's performance:
| Setting | Description | Default Value |
|---------|-------------|---------------|
| **Start Date** | Beginning of backtest period | January 1, 2025 |
| **End Date** | End of backtest period | December 31, 2026 |
- **Best Practice**: Test across different market conditions (bull markets, bear markets, sideways markets)
- **Limitation**: Past performance doesn't guarantee future results
## Entry and Exit Strategies
### Dual-Channel System
A key innovation of the Bober XM is its dual-channel approach:
- **Independent Parameters**: Each trade direction has its own channel settings
- **Asymmetric Trading**: Recognizes that markets often behave differently in uptrends versus downtrends
- **Optimized Performance**: Fine-tune settings for both bullish and bearish conditions
This approach allows the bot to adapt to the natural asymmetry of markets, where uptrends often develop gradually while downtrends can be sharp and sudden.
### Channel Types
#### 1. Keltner Channels
Traditional volatility-based channels using EMA and ATR:
| Setting | Long Default | Short Default |
|---------|--------------|---------------|
| **EMA Length** | 37 | 20 |
| **ATR Length** | 13 | 17 |
| **Multiplier** | 1.4 | 1.9 |
| **Source** | low | high |
- **Strengths**:
- Reliable in trending markets
- Less prone to whipsaws than Bollinger Bands
- Clear visual representation of volatility
- **Weaknesses**:
- Can lag during rapid market changes
- Less effective in choppy, non-trending markets
#### 2. Machine Learning Moving Average (MLMA)
Advanced predictive model using kernel regression (RBF kernel):
| Setting | Description | Options |
|---------|-------------|--------|
| **Source MA** | Price data used for MA calculations | Any price source (low/high/close/etc.) |
| **Moving Average Type** | Type of MA algorithm for calculations | SMA, EMA, WMA, VWMA, RMA, HMA |
| **Trend Source** | Price data used for trend determination | Any price source (close default) |
| **Window Size** | Historical window for MLMA calculations | 5+ (default: 16) |
| **Forecast Length** | Number of bars to forecast ahead | 1+ (default: 3) |
| **Noise Parameter** | Controls smoothness of prediction | 0.01+ (default: ~0.43) |
| **Band Multiplier** | Multiplier for channel width | 0.1+ (default: 0.5-0.6) |
- **Strengths**:
- Predictive rather than reactive
- Adapts quickly to changing market conditions
- Better at identifying trend reversals early
- **Weaknesses**:
- More computationally intensive
- Requires careful parameter tuning
- Can be sensitive to input data quality
### Entry Strategies
| Strategy | Description | Ideal Market Conditions |
|----------|-------------|-------------------------|
| **Breakout** | Enters when price breaks through channel bands, indicating strong momentum | High volatility, emerging trends |
| **Pullback** | Enters when price retraces to the middle band after testing extremes | Established trends with regular pullbacks |
| **Mean Reversion** | Enters at channel extremes, betting on a return to the mean | Range-bound or oscillating markets |
#### Breakout Strategy (Default)
- **Implementation**: Enters long when price crosses above the upper band, short when price crosses below the lower band
- **Strengths**: Captures strong momentum moves, performs well in trending markets
- **Weaknesses**: Can lead to late entries, higher risk of false breakouts
- **Optimization Tips**:
- Increase channel multiplier for fewer but more reliable signals
- Combine with volume confirmation for better accuracy
#### Pullback Strategy
- **Implementation**: Enters long when price pulls back to middle band during uptrend, short during downtrend pullbacks
- **Strengths**: Better entry prices, lower risk, higher probability setups
- **Weaknesses**: Misses some strong moves, requires clear trend identification
- **Optimization Tips**:
- Use with trend filters to confirm overall direction
- Adjust middle band calculation for market volatility
#### Mean Reversion Strategy
- **Implementation**: Enters long at lower band, short at upper band, expecting price to revert to the mean
- **Strengths**: Excellent entry prices, works well in ranging markets
- **Weaknesses**: Dangerous in strong trends, can lead to fighting the trend
- **Optimization Tips**:
- Implement strong trend filters to avoid counter-trend trades
- Use smaller position sizes due to higher risk nature
### Confirmation Indicators
#### Pivot Point SuperTrend
Combines pivot points with ATR-based SuperTrend for trend confirmation:
| Setting | Default Value |
|---------|---------------|
| **Pivot Period** | 25 |
| **ATR Factor** | 2.2 |
| **ATR Period** | 41 |
- **Function**: Identifies significant market turning points and confirms trend direction
- **Implementation**: Requires price to respect the SuperTrend line for trade confirmation
#### Weighted Moving Average (WMA)
Provides additional confirmation layer for entries:
| Setting | Default Value |
|---------|---------------|
| **Period** | 15 |
| **Source** | ohlc4 (average of Open, High, Low, Close) |
- **Function**: Confirms trend direction and filters out low-quality signals
- **Implementation**: Price must be above WMA for longs, below for shorts
### Exit Strategies
#### On-Balance Volume (OBV) Based Exits
Uses volume flow to identify potential reversals:
| Setting | Default Value |
|---------|---------------|
| **Source** | ohlc4 |
| **MA Type** | HMA (Options: SMA, EMA, WMA, RMA, VWMA, HMA) |
| **Period** | 22 |
- **Function**: Identifies divergences between price and volume to exit before reversals
- **Implementation**: Exits when OBV crosses its moving average in the opposite direction
- **Customizable MA Type**: Different MA types provide varying sensitivity to OBV changes:
- **SMA**: Traditional simple average, equal weight to all periods
- **EMA**: More weight to recent data, responds faster to price changes
- **WMA**: Weighted by recency, smoother than EMA
- **RMA**: Similar to EMA but smoother, reduces noise
- **VWMA**: Factors in volume, helpful for OBV confirmation
- **HMA**: Reduces lag while maintaining smoothness (default)
#### ADX Exit Confirmation
Uses Average Directional Index to confirm trend exhaustion:
| Setting | Default Value |
|---------|---------------|
| **ADX Threshold** | 35 |
| **ADX Smoothing** | 60 |
| **DI Length** | 60 |
- **Function**: Confirms trend weakness before exiting positions
- **Implementation**: Requires ADX to drop below threshold or DI lines to cross
## Filter System
### RSI Filter
- **Function**: Controls entries based on momentum conditions
- **Parameters**:
- Period: 15 (default)
- Overbought level: 71
- Oversold level: 23
- Multi-timeframe support: Current, MTF1 (15min), or MTF2 (4h)
- Customizable price source (open, high, low, close, hl2, hlc3, ohlc4)
- **Implementation**: Blocks long entries when RSI > overbought, short entries when RSI < oversold
### Volatility Filter
- **Function**: Prevents trading during excessive market volatility
- **Parameters**:
- Measure: ATR (Average True Range)
- Period: Customizable (default varies by timeframe)
- Threshold: Adjustable multiplier
- Multi-timeframe support
- Customizable price source
- **Implementation**: Blocks trades when current volatility exceeds threshold × average volatility
### Volume Filter
- **Function**: Ensures adequate market liquidity for trades
- **Parameters**:
- Threshold: 0.4× average (default)
- Measurement period: 5 (default)
- Moving average type: Customizable (HMA default)
- Multi-timeframe support
- Customizable price source
- **Implementation**: Requires current volume to exceed threshold × average volume
### Bollinger Bands Filter
- **Function**: Controls entries based on price relative to statistical boundaries
- **Parameters**:
- Period: Customizable
- Standard deviation multiplier: Adjustable
- Moving average type: Customizable
- Multi-timeframe support
- Customizable price source
- **Implementation**: Can require price to be within bands or breaking out of bands depending on strategy
### KEMAD Filter (Kalman EMA Distance)
- **Function**: Advanced trend confirmation using Kalman filter algorithm
- **Parameters**:
- Process Noise: 0.35 (controls smoothness)
- Measurement Noise: 24 (controls reactivity)
- Filter Order: 6 (higher = more smoothing)
- ATR Length: 8 (for bandwidth calculation)
- Upper Multiplier: 2.0 (for long signals)
- Lower Multiplier: 2.7 (for short signals)
- Multi-timeframe support
- Customizable visual indicators
- **Implementation**: Generates signals based on price position relative to Kalman-filtered EMA bands
## Risk Management System
### Position Sizing
Automatically calculates position size based on account equity and risk parameters:
| Setting | Default Value |
|---------|---------------|
| **Risk % of Equity** | 50% |
- **Implementation**:
- Position size = (Account equity × Risk %) ÷ (Entry price × Stop loss distance)
- Adjusts automatically based on volatility and stop placement
- **Best Practices**:
- Start with lower risk percentages (1-2%) until strategy is proven
- Consider reducing risk during high volatility periods
### Stop-Loss Methods
Multiple stop-loss calculation methods with separate configurations for long and short positions:
| Method | Description | Configuration |
|--------|-------------|---------------|
| **ATR-Based** | Dynamic stops based on volatility | ATR Period: 14, Multiplier: 2.0 |
| **Percentage** | Fixed percentage from entry | Long: 1.5%, Short: 1.5% |
| **PIP-Based** | Fixed currency unit distance | 10.0 pips |
- **Implementation Notes**:
- ATR-based stops adapt to changing market volatility
- Percentage stops maintain consistent risk exposure
- PIP-based stops provide precise control in stable markets
### Trailing Stops
Locks in profits by adjusting stop-loss levels as price moves favorably:
| Setting | Default Value |
|---------|---------------|
| **Stop-Loss %** | 1.5% |
| **Activation Threshold** | 2.1% |
| **Trailing Distance** | 1.4% |
- **Implementation**:
- Initial stop remains fixed until profit reaches activation threshold
- Once activated, stop follows price at specified distance
- Locks in profit while allowing room for normal price fluctuations
### Risk-Reward Parameters
Defines the relationship between risk and potential reward:
| Setting | Default Value |
|---------|---------------|
| **Risk-Reward Ratio** | 1.4 |
| **Take Profit %** | 2.4% |
| **Stop-Loss %** | 1.5% |
- **Implementation**:
- Take profit distance = Stop loss distance × Risk-reward ratio
- Higher ratios require fewer winning trades for profitability
- Lower ratios increase win rate but reduce average profit
### Filter Combinations
The strategy allows for simultaneous application of multiple filters:
- **Recommended Combinations**:
- Trending markets: RSI + KEMAD filters
- Ranging markets: Bollinger Bands + Volatility filters
- All markets: Volume filter as minimum requirement
- **Performance Impact**:
- Each additional filter reduces the number of trades
- Quality of remaining trades typically improves
- Optimal combination depends on market conditions and timeframe
### Multi-Timeframe Filter Applications
| Filter Type | Current Timeframe | MTF1 (15min) | MTF2 (4h) |
|-------------|-------------------|-------------|------------|
| RSI | Quick entries/exits | Intraday trend | Overall trend |
| Volume | Immediate liquidity | Sustained support | Market participation |
| Volatility | Entry timing | Short-term risk | Regime changes |
| KEMAD | Precise signals | Trend confirmation | Major reversals |
## Visual Indicators and Chart Analysis
The bot provides comprehensive visual feedback on the chart:
- **Channel Bands**: Keltner or MLMA bands showing potential support/resistance
- **Pivot SuperTrend**: Colored line showing trend direction and potential reversal points
- **Entry/Exit Markers**: Annotations showing actual trade entries and exits
- **Risk/Reward Zones**: Visual representation of stop-loss and take-profit levels
These visual elements allow for:
- Real-time strategy assessment
- Post-trade analysis and optimization
- Educational understanding of the strategy logic
## Implementation Guide
### TradingView Setup
1. Load the script in TradingView Pine Editor
2. Apply to your preferred chart and timeframe
3. Adjust parameters based on your trading preferences
4. Enable alerts for webhook integration
### Webhook Integration
1. Configure webhook URL in TradingView alerts
2. Set up receiving endpoint on your trading platform
3. Define message format matching the bot's output
4. Test with small position sizes before full deployment
### Optimization Process
1. Backtest across different market conditions
2. Identify parameter sensitivity through multiple tests
3. Focus on risk management parameters first
4. Fine-tune entry/exit conditions based on performance metrics
5. Validate with out-of-sample testing
## Performance Considerations
### Strengths
- Adaptability to different market conditions through dual channels
- Multiple layers of confirmation reducing false signals
- Comprehensive risk management protecting capital
- Machine learning integration for predictive edge
### Limitations
- Complex parameter set requiring careful optimization
- Potential over-optimization risk with so many variables
- Computational intensity of MLMA calculations
- Dependency on proper webhook configuration for execution
### Best Practices
- Start with conservative risk settings (1-2% of equity)
- Test thoroughly in demo environment before live trading
- Monitor performance regularly and adjust parameters
- Consider market regime changes when evaluating results
## Conclusion
The ₿ober XM v2.0 represents a significant evolution in trading strategy design, combining traditional technical analysis with machine learning elements and multi-timeframe analysis. The core strength of this system lies in its adaptability and recognition of market asymmetry.
### Market Asymmetry and Adaptive Approach
The strategy acknowledges a fundamental truth about markets: bullish and bearish phases behave differently and should be treated as distinct environments. The dual-channel system with separate parameters for long and short positions directly addresses this asymmetry, allowing for optimized performance regardless of market direction.
### Targeted Backtesting Philosophy
It's counterproductive to run backtests over excessively long periods. Markets evolve continuously, and strategies that worked in previous market regimes may be ineffective in current conditions. Instead:
- Test specific market phases separately (bull markets, bear markets, range-bound periods)
- Regularly re-optimize parameters as market conditions change
- Focus on recent performance with higher weight than historical results
- Test across multiple timeframes to ensure robustness
### Multi-Timeframe Analysis as a Game-Changer
The integration of multi-timeframe analysis fundamentally transforms the strategy's effectiveness:
- **Increased Safety**: Higher timeframe confirmations reduce false signals and improve trade quality
- **Context Awareness**: Decisions made with awareness of larger trends reduce adverse entries
- **Adaptable Precision**: Apply strict filters on lower timeframes while maintaining awareness of broader conditions
- **Reduced Noise**: Higher timeframe data naturally filters market noise that can trigger poor entries
The ₿ober XM v2.0 provides traders with a framework that acknowledges market complexity while offering practical tools to navigate it. With proper setup, realistic expectations, and attention to changing market conditions, it delivers a sophisticated approach to systematic trading that can be continuously refined and optimized.

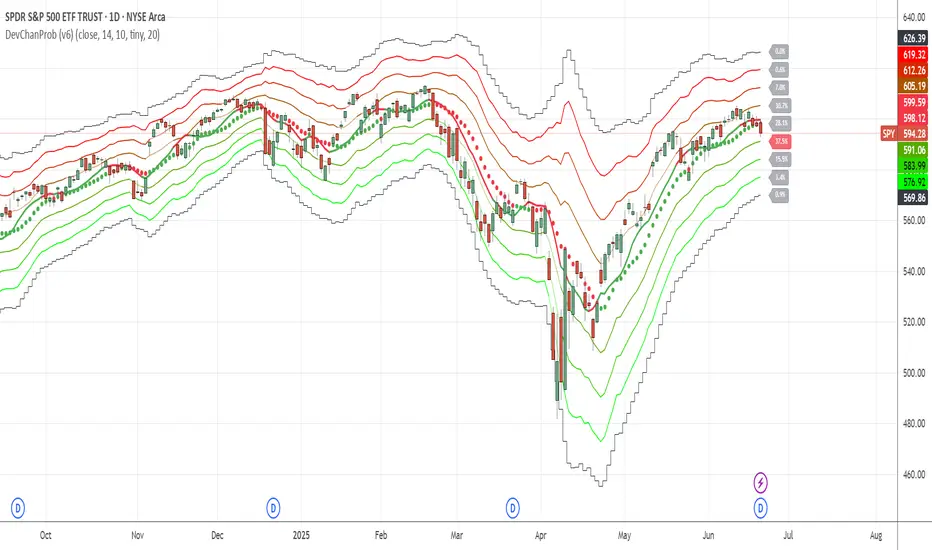
Deviation ChannelsIndicator Name: Deviation Channels (Dev Chan)
Why Use This Indicator?
Visualize Volatility Ranges:
The indicator plots Keltner Channels at four levels above and below an average line, letting you easily see how far price has deviated from a typical range. Each “dev” line highlights potential support or resistance during pullbacks or surges.
Color-Coded Clarity:
Each band shifts color intensity depending on whether the current price is trading above or below it, letting you spot breakouts and rejections at a glance. Meanwhile, the Fast SMA (default 10) also changes color – green if price is above, red if below – adding a quick momentum read.
Adjustable Source & Length:
Choose your input source (open, close, ohlc4, or hlc3) and set your Keltner length to suit different asset classes or timeframes. Whether you want a tighter, more reactive channel or a smoother, longer-term reading, the script adapts with minimal effort.
A Simple Trading Approach
Identify Trend with Fast SMA:
If the Fast SMA (default length 10) is green (price above it), treat that as a bullish environment. If it’s red (price below), favor bearish or neutral stances.
Wait for Price to Reach Lower/Upper Deviations:
In a bullish setup (Fast SMA green), watch for price to dip into one of the lower channels (e.g., -1 Dev or -2 Dev). Such pullbacks can become potential “buy the dip” zones if price stabilizes and resumes upward momentum.
Conversely, if the Fast SMA is red, watch for price to test the upper channels (1 Dev or 2 Dev). That might be a short opportunity or a place to close out any remaining longs before a deeper correction.
Manage Risk with Channel Levels:
Place stop-losses just beyond the next “dev” band to protect against volatility. For example, if you enter on a bounce at -1 Dev, consider placing a stop near -2 Dev or -3 Dev, depending on your risk tolerance.
Take Profits Gradually:
In an uptrend, you might scale out of positions as price moves toward higher lines (e.g., 1 Dev or 2 Dev). Conversely, if price fails to hold above the Fast SMA or repeatedly closes below a key band, it might be time to exit.
Disclaimer: No single indicator is foolproof. Always combine with sound risk management, observe multiple timeframes, and consider fundamental factors before making trading decisions. Experiment with the Keltner length and Fast SMA fastLength to find the sweet spot for your market and time horizon.
ReadyFor401ks Just Tell Me When!ReadyFor401ks Just Tell Me When!
LET ME START BY SAYING. NO INDICATOR WILL HELP YOU NAIL THE PERFECT ENTRY/EXIT ON A TRADE. YOU SHOULD ALWAYS EDUCATE YOURSELF AND HAVE A BASIC UNDERSTANDING OF INVESTING, TRADING, CHART ANALYSIS, AND THE RISKS INVOLVED WITH. THAT BEING SAID, WITH THE RIGHT ADJUSTMENTS, IT'S PRETTY D*$N CLOSE TO PERFECTION!
This indicator is designed to help traders identify t rend direction, continuation signals, and potential exits based on a dynamic blend of moving averages, ATR bands, and price action filters. Whether you’re an intraday trader scalping the 5-minute chart or a swing trader analyzing the weekly timeframe for LEAPS , this tool provides a clear, rule-based system to help guide your trading decisions.
⸻
Key Features & Benefits
🔹 Customizable Trend Power (Baseline) Calculation
• Choose from JMA, EMA, HMA, TEMA, DEMA, SMA, VAMA, and WMA for defining your baseline trend direction.
• The baseline helps confirm whether the market is in a bullish or bearish phase.
🔹 ATR-Based Trend Continuation & Volatility Measurement
• ATR bands dynamically adjust to market conditions, helping you spot breakouts and fakeouts.
• The indicator detects when price violates ATR range , which often signals impulse moves.
🔹 Clear Entry & Exit Signals
• Uses a Continuation MA (SSL2) to confirm trends.
• Includes a separate Exit MA (SSL3) that provides crossover signals to indicate when to exit trades or reverse positions .
• Plots trend continuation circles when ATR conditions align with trend signals.
🔹 Keltner Channel Baseline for Market Structure
• A modified Keltner Channel is integrated into the baseline to help filter out choppy conditions .
• If price remains inside the baseline, the market is in consolidation , while breakouts beyond the bands indicate strong trends .
🔹 Adaptive Color Coding for Market Conditions
• Bars change color based on momentum, making trend direction easy to read.
• Green = Bullish Trend, Red = Bearish Trend, Gray = Neutral/Chop.
🔹 Flexible Alerts for Trade Management
• Get real-time alerts when the Exit MA crosses price , helping you l ock in profits or switch directions .
⸻
How to Use This Indicator for Different Trading Styles
🟢 For Intraday Trading (5-Minute Chart Setup)
• Faster MA settings help react quickly to momentum shifts.
• Ideal for scalping breakouts, trend continuation setups, and intraday reversals.
• Watch for ATR violations and price interacting with the baseline/Keltner Channel for entries.
--------------------------------
My Settings for Intraday Trading on 5min Chart
ATR Period: 15
ATR Multi: 1
ATR Smoothing: WMA
Trend Power based off of: JMA
Trend Power Period: 30
Continuation Type: JMA
Continuation Length: 20
Calculate Exit of what MA?: HMA
Calculate Exit off what Period? 30
Source of Exit Calculation: close
JMA Phase *APPLIES TO JMA ONLY: 3
JMA Power *APPLIES TO JMA ONLY: 3
Volatility Lookback Period *APPLIES TO VAMA ONLY 30
Use True Range for Channel? Checked
Base Channel Multiplier: 0.4
ATR Continuation Criteria: 1.1
----------------------------------
🔵 For Swing Trading & LEAPS (Weekly Chart Setup - Default Settings)
• Slower MAs provide a broader view of trend structure.
• Helps capture multi-week trend shifts and confirm entry points for longer-term trades.
• Weekly ATR bands highlight when stocks are entering overextended conditions.
💡 Example:
Let’s say you’re looking at TSLA on a Weekly Chart using the default settings. You notice that price crosses above the continuation MA (SSL2) while remaining above the baseline (trend power MA). The bar turns green, and price breaks above ATR resistance, signaling a strong bullish continuation. This could be a great opportunity to enter a long-term swing trade or LEAPS options position.
On the flip side, if price reverses below the Exit MA (SSL3) and turns red while breaking the lower ATR band, it might signal a good time to exit longs or enter a short trade.
⸻
Final Thoughts
The ReadyFor401ks Just Tell Me When! indicator is an all-in-one trading system that simplifies trend-following, volatility measurement, and trade management. By integrating multiple moving average types, ATR filters, and clear visual cues, it allows traders to stay disciplined and remove emotions from their trading decisions.
✅ Perfect for scalpers, day traders, and swing traders alike!
🔔 Set up alerts for automated trade signals and never miss a key move!
💬 If you find this indicator useful, leave a comment and share how you use it in your trading! 🚀

Squeeze Momentum Indicator Strategy [LazyBear + PineIndicators]The Squeeze Momentum Indicator Strategy (SQZMOM_LB Strategy) is an automated trading strategy based on the Squeeze Momentum Indicator developed by LazyBear, which itself is a modification of John Carter's "TTM Squeeze" concept from his book Mastering the Trade (Chapter 11). This strategy is designed to identify low-volatility phases in the market, which often precede explosive price movements, and to enter trades in the direction of the prevailing momentum.
Concept & Indicator Breakdown
The strategy employs a combination of Bollinger Bands (BB) and Keltner Channels (KC) to detect market squeezes:
Squeeze Condition:
When Bollinger Bands are inside the Keltner Channels (Black Crosses), volatility is low, signaling a potential upcoming price breakout.
When Bollinger Bands move outside Keltner Channels (Gray Crosses), the squeeze is released, indicating an expansion in volatility.
Momentum Calculation:
A linear regression-based momentum value is used instead of traditional momentum indicators.
The momentum histogram is color-coded to show strength and direction:
Lime/Green: Increasing bullish momentum
Red/Maroon: Increasing bearish momentum
Signal Colors:
Black: Market is in a squeeze (low volatility).
Gray: Squeeze is released, and volatility is expanding.
Blue: No squeeze condition is present.
Strategy Logic
The script uses historical volatility conditions and momentum trends to generate buy/sell signals and manage positions.
1. Entry Conditions
Long Position (Buy)
The squeeze just released (Gray Cross after Black Cross).
The momentum value is increasing and positive.
The momentum is at a local low compared to the past 100 bars.
The price is above the 100-period EMA.
The closing price is higher than the previous close.
Short Position (Sell)
The squeeze just released (Gray Cross after Black Cross).
The momentum value is decreasing and negative.
The momentum is at a local high compared to the past 100 bars.
The price is below the 100-period EMA.
The closing price is lower than the previous close.
2. Exit Conditions
Long Exit:
The momentum value starts decreasing (momentum lower than previous bar).
Short Exit:
The momentum value starts increasing (momentum higher than previous bar).
Position Sizing
Position size is dynamically adjusted based on 8% of strategy equity, divided by the current closing price, ensuring risk-adjusted trade sizes.
How to Use This Strategy
Apply on Suitable Markets:
Best for stocks, indices, and forex pairs with momentum-driven price action.
Works on multiple timeframes but is most effective on higher timeframes (1H, 4H, Daily).
Confirm Entries with Additional Indicators:
The author recommends ADX or WaveTrend to refine entries and avoid false signals.
Risk Management:
Since the strategy dynamically sizes positions, it's advised to use stop-losses or risk-based exits to avoid excessive drawdowns.
Final Thoughts
The Squeeze Momentum Indicator Strategy provides a systematic approach to trading volatility expansions, leveraging the classic TTM Squeeze principles with a unique linear regression-based momentum calculation. Originally inspired by John Carter’s method, LazyBear's version and this strategy offer a refined, adaptable tool for traders looking to capitalize on market momentum shifts.

DBMA - Dual Bollinger Moving AverageThe Dual Bollinger moving average (DBMA) consists of a moving average (MA) & two Bollinger Bands (BB), with the color of the bands representing the level of price compression. In its default settings, it is a 20-day simple moving average with 2 upper Bollinger Bands, having the standard deviation (SD) settings of 0.5 & 1, respectively.
How close the price is to the moving average?
For a pullback trader, the entry point should be close to the moving average, preferably with price compression. How close should it be, is where the bands serve as a guide. The low of the pullback candle should be within the bands, that is, at least within the far band (1 SD of the MA), or even better if it's within the near band (0.5 SD). When the price is outside the bands, it should not be considered favourable for a pullback entry.
For how long has the price been closer to the moving average?
John Carter’s TTM Squeeze indicator looked at the relationship between Bollinger Bands and Keltner's Channels to help identify period of volatility contractions. Bollinger Bands being completely enclosed within the Keltner Channels is indicative of a very low volatility. This is a state of volatility contraction known as squeeze. Using different ATR lengths (1.0, 1.5 and 2.0) for Keltner Channels, we can differentiate between levels of squeeze (High, Mid & Low compression, respectively). Greater the compression, higher the potential for explosive moves.
The squeeze portion of the script is based on LazyBear's script ( Squeeze Momentum Indicator )
The High, Mid & Low compression squeezes are depicted via the color of the bands being red, orange, or yellow, respectively. With the low of the pullback candle within the bands, & the squeeze color changing to red, it should be considered favourable for a pullback entry.
Trailing the price with the lower bands
The lower bands can be used for trailing with the moving average. While trailing, once the price closes below the moving average, the trailing stoploss (TSL) is said to be triggered, & the trade is exited. Here we use the bands to give it some cushion. Let the price close below the 1SD band for labelling the TSL as being triggered to exit the trade. If the price closes below the MA but is still within the bands, the signal is to keep holding the trade.

BB and KC StrategyThis script is designed as a TradingView strategy that uses Bollinger Bands (BB) and Keltner Channels (KC) as the primary indicators for generating trade signals. It aims to catch potential market trends by comparing the movements of these two popular volatility measures.
Key aspects of this strategy:
1. **Bollinger Bands and Keltner Channels:** Both are volatility-based indicators. The Bollinger Bands consist of a middle band (simple moving average) and two outer bands calculated based on standard deviation, which adjusts itself to market conditions. Keltner Channels are a set of bands placed above and below an exponential moving average of the price. The distance between the bands is calculated based on the Average True Range (ATR), a measure of price volatility.
2. **Entry Signals:** The strategy enters a long position when the upper KC line crosses above the upper BB line and the volume is above its moving average. Conversely, it enters a short position when the lower KC line crosses below the lower BB line and the volume is above its moving average.
3. **Exit Signals:** The strategy exits a position under two conditions. First, if the trade has been open for a certain number of bars defined by the user (default 20 bars). Second, a stop loss and trailing stop are in place to limit potential losses and lock in profits as the price moves favorably. The stop loss is set at a percentage of the entry price (default 1.5% for long and -1.5% for short), and the trailing stop is also a percentage of the entry price (default 2%).
4. **Trade Quantity:** The script allows specifying the investment amount for each trade, set to a default of 1000 currency units.
Remember, this is a strategy script, which means it is used for backtesting and not for real-time signals or live trading. It is also recommended that it is used as a tool to aid your trading, not as a standalone system. As with any strategy, it should be tested over different market conditions and used in conjunction with other aspects of technical and fundamental analysis to ensure robustness and effectiveness.
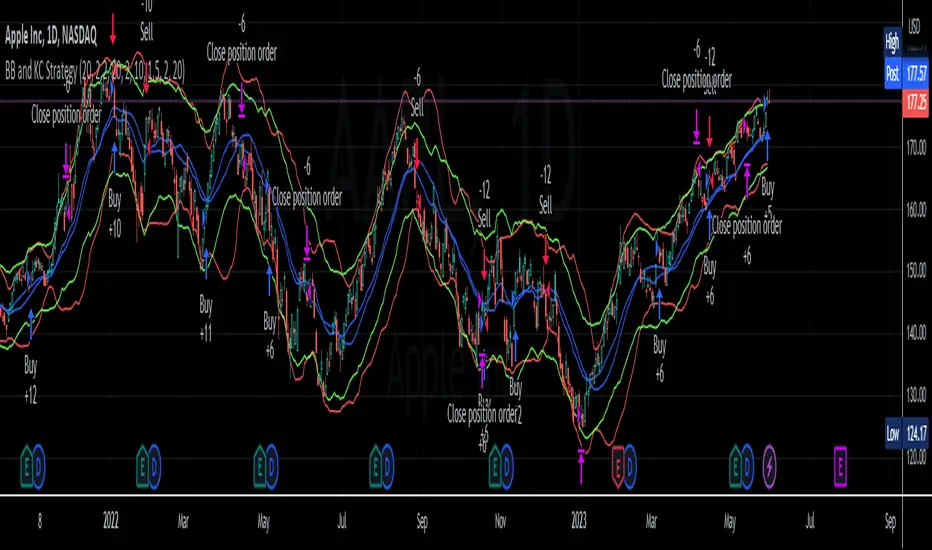
Exhaustion Improved Scalping Consolidation and Squeeze IndicatorThis custom indicator, called " Exhaustion & Improved Scalping Consolidation and Squeeze Indicator," is designed to help traders identify potential trading opportunities in the context of price consolidations, squeezes, and momentum exhaustion. It is an overlay indicator that combines several popular technical analysis tools, including the Relative Strength Index (RSI), Moving Average Convergence Divergence (MACD), Bollinger Bands, Keltner Channels, and Rate of Change (ROC). By analyzing these metrics, the indicator aims to provide visual cues on price charts to support better decision-making in the markets.
Use Case for Trading:
Consolidation Detection: The indicator identifies periods of price consolidation, which typically occur when a market is experiencing low volatility and trading in a narrow range. During these periods, the RSI value is between 45 and 55, the MACD histogram is close to zero, and the ROC value is low. The indicator highlights these consolidation periods by coloring the price bars yellow. Traders can use this information to anticipate potential breakouts and prepare for a possible trend initiation.
Squeeze Detection: The indicator detects squeezes by comparing the Bollinger Bands and Keltner Channels. A squeeze occurs when the Bollinger Bands are within the Keltner Channels, indicating that price volatility is decreasing. The indicator colors the price bars orange during a squeeze, which can be a signal for traders to watch for an upcoming increase in volatility and potential trend expansion.
Momentum Exhaustion Detection: The indicator identifies exhaustion in momentum by analyzing the RSI and MACD histogram. When the RSI is above 70, indicating overbought conditions, and the MACD histogram is decreasing, it may signal that the current upward momentum is losing strength. The indicator colors the price bars white in these situations. Traders can use this information to potentially exit long positions or prepare for a trend reversal.

Simple RangeThe daily price range is a good proxy to judge an instrument’s volatility. I have combined multiple concepts in this indicator to display information regarding the daily price range & its volatility.
A trading period's range is simply the difference between its high and the low. This script shows the daily high-to-low range of the price as a column chart. It has 3 main components:
1. Narrow-range days (NR7) & Wide-range Days (WR20) - as plot columns
Original concept from Thomas Bulkowski
Modified from "NR4 & NR7 Indicator" script by theapextrader7
Modified from "WR - BC Identifier" script by wrpteam2020
Narrow range days mark price contractions that often precede price expansions. This script uses NR7 (narrow range 7) as a narrow-range day. This value can be changed by the user if, instead of an NR7, he or she wishes to use NR4 or NR21, or any other interval of his or her choice. NR7 is an indecisive trading day in which the range is narrower than any of the previous six days (a total of 7 days). This is a popular concept given by Thomas Bulkowski. A breakout is said to occur when price closes above the top or below the bottom of the NR7. Upside breakout of an NR 7 candle with high volumes indicates bullishness.
Similarly, highs & lows of wide-range bars (on big volumes) are also significant reference levels for price. Wide-range candle are identified by size of the body candle (open - close). The script compares the size of previous 20 candles to identify WR20 candles. This value can also be changed by the user.
The script shows NR7 & WR20 as orange & blue bars, respectively.
The user can also turn on the option to identify a big high-to-low range candle greater than a pre-defined threshold (default is 5%). These show up as green or red bars.
2. TTM Squeeze - as background
Original concept from John Carter's book "Mastering the Trade"
Based on "Squeeze Momentum Indicator" script by LazyBear
John Carter’s TTM Squeeze indicator looks at the relationship between Bollinger Bands and Keltner's Channels to help identify period of volatility contractions. Bollinger Bands being completely enclosed within the Keltner Channels is indicative of a very low volatility. This is a state of volatility contraction known as squeeze. Using different ATR lengths (1.0, 1.5 and 2.0) for Keltner Channels, we can differentiate between levels of squeeze (High, Mid & Low compression, respectively). Greater the compression, higher the potential for explosive moves.
In the script, the High, Mid & Low compression squeezes are depicted via the background color being red, orange, or yellow, respectively.
3. Average Daily Range - as table
Original idea by alpine_trader
Modified from "ADR% - Average Daily Range % by MikeC" script by TheScrutiniser
Average Day Range (ADR) tells how much the price moves between the high and low on a given day. This is the day Range, which is then averaged to create ADR. The script uses an average of the last 20 days to calculate the ADR. Unlike ATR (Average True Range), this excludes Gaps.
The script displays the ADR as a % value in a table.
If you want to find stocks that move a lot on an average on most days, then look for stocks that have ADR% of 5% or more.
If you prefer lower volatility stocks, focus on stocks with lower ADR% values, such as 2% or less.
How it comes together
For a bullish "momentum burst", or a velocity trade:
Select stocks with Average Day Range % (ADR) greater than 5
Identify significant reference price levels via highs & lows of WR20 bars (on big volumes)
Wait for a decent mid-to-high compression squeeze
Look for clusters of NR7 candles in the consolidation
Any breakout from this consolidation should be accompanied by more than average (preferably pocket pivot) volumes
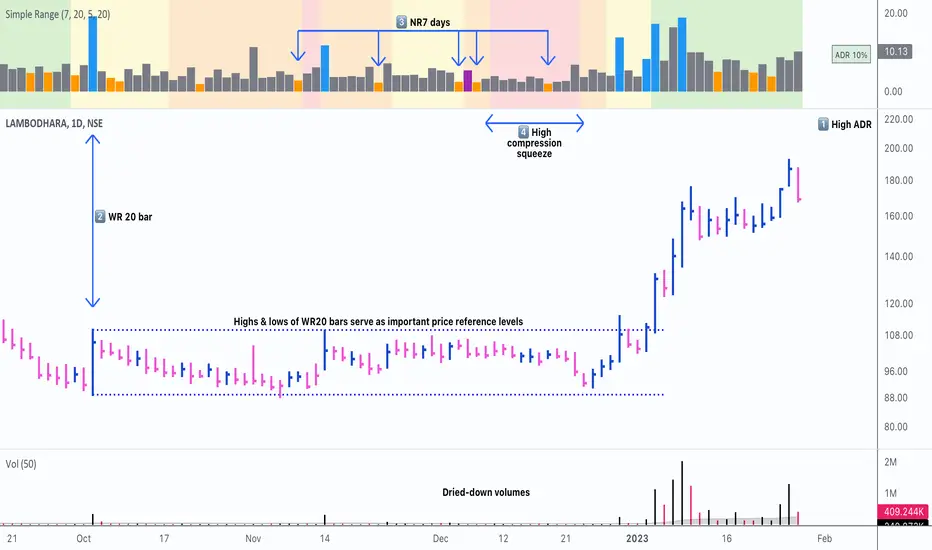
Scalping Trading System ALERT Crypto and StocksThis is the alert version of the strategy with the same name.
Indicators
SImple Moving Average
Exponential Moving Average
Keltner Channels
MACD Histogram
Stochastics
Rules for entry
long= Close of the candle bigger than both moving averages and close of the candle is between the top and bot levels from Keltner . At the same time the macd histogram is negative and stochastic is below 50.
short= Close of the candle smaller than both moving averages and close of the candle is between the top and bot levels from Keltner . At the same time the macd histogram is positive and stochastic is above 50.
Rules for exit
We exit when we meet an opposite reverse order.
This strategy has no risk management inside, so use it with caution !

Elder Impulse System + ATR BandsDisregard the above chart, I am not sure why it isn't showing the one I want, which is linked below:
This is as far as I can tell the closest representation to Dr. Alexander Elder's updated "Elder Impulse System" that has added ATR-volatility bands up to 3x deviations from price. I got the idea from watching this recent video (www.youtube.com) of Dr. Elder reviewing some recent trades and noticed he had updated his system from his original books. The Impulse System colour coding was inspired by AstralLoverFlow and LazyBear. ATR Bands are pre-programmed Keltner Channels with some modifications such as filing in the ATR Zones with user-selected colour bands and modifying the ATR value to better suit the volatility of the market being traded.
The script has several components, which I will detail below:
Exponential Moving Averages:
1) A 13-period EMA that is used as a staple in all of Dr. Elder's technical analysis. He uses this EMA as the basis for all of his indicators and why it is included here.
2) A 26-period EMA which can be used as a base-line of sorts to filter when to go long or when to go short. For instance, price over the 26-EMA, price is strong and the rally upwards is likely to continue, underneath it, price is weak and likely to continue downwards for a time.
Volatility Bands:
By definition these are nothing more than 3 separate Keltner Channels of a 13-period EMA each set to one additional multiplier from the moving average. This gives us a 1x, 2x, and 3x multiplier of average volatility from the 13-period EMA based on a 14-period Average True Range (ATR) reading. The ATR was chosen as it accommodates price gaps and also is the standard formula calculation in TradingView. The values of the bands cannot be adjusted but the colour coding of them can be.
Elder Impulse System:
These colour-coded bars show you the strength and direction of the current chart resolution, calculated by the slope of a 13-period EMA and the slope of a MACD histogram. These are used not as a buying or selling recommendation alone but as trend filters, as per Dr. Elder's own description of them.
Green Bars = The 13-period EMA is sloping positively and the MACD histogram is rising compared to previous bars. The trader should only consider buying/long opportunities when a green bar is most recent.
Red Bars = The 13-period EMA is sloping negatively and the MACD histogram is falling compared to previous bars. The trader should only consider selling/short opportunities when a red bar is most recent.
Blue Bars = The 13-period EMA and the MACD histogram are not aligned. One of the indicators is sloping opposite to the other indicator. These are known as indecision bars and are typically seen near the end of a previously established trend. The trader can choose to wait for either a green or red bar to shape their trading bias if they are more risk-averse while a counter-trend trader may decide to try opening a position against the currently-established trend.
How To Trade the System:
This system is unique in that it is so versatile and will fit the styles of many traders, be it trend following traders (generally the original Elder Impulse System design) or mean-reversion/counter-trend trading (the original Keltner Channel design). None of the examples below or in the chart above are financial advice and are just there for demonstration purposes only.
1) The most basic signal given would be the moving average cross up or down. A cross of the 13-EMA over the 26-EMA signals upward trend strength and the trader could look for buying opportunities. Conversely, the 13-EMA under the 26-EMA shows downward trend strength and the trader could look for selling opportunities.
2) Following the Elder Impulse system in conjunction with the EMAs. Look for long opportunities when a green bar is printed and price is over both of the 13- and 26-period EMAs. Look for short opportunities when a red bar is printed and price is below both of the 13- and 26-period EMAs. Keep in mind this does not necessarily need a moving average cross to be viable, a green or red bar over both EMAs is a valid signal in this system, usually. Examine price more closely for better entry signals when a blue bar is printed and price is either above or below both EMAs if you are a trend trader. This is how Dr. Elder originally intended the system to be used in conjunction with his famous Triple Screen Trading System. I am not going into detail here as it is a deep subject but I would suggest an interested trader to examine this Triple Screen System further as it is widely accepted as a strong strategy.
3) Mean Reversion and Counter-Trend Trading. Dr. Elder mentions that the zone between the two EMAs is called the Value Zone. A mean reversion trader could look for buying opportunities if price has generally been in an uptrend and falls back to value, conversely, they could look for shorting opportunities if price has generally been in a downtrend and rises back to value. These are your very basic pull backs found in trends that create your higher lows in an uptrend or your lower highs in a downtrend. A mean reversion/scalper trader may also look to use the upper and lower most ATR bands as an indication of price being overbought or oversold and could look to enter a counter-trend trade here once a blue indecision bar is printed and to ride that move back down to the Value Zone.
Taking Profits and Risk Management
This system again is very versatile and will fit a wide range of trading styles. It has built in take profit levels and risk management depending on your style of trading.
1a) In original Triple Screen Trading (and the original Elder Impulse system), a trader was to place a buy order one tick above a newly printed green bar with a stop loss one tick below the most recent 2-day low, and vice-versa for red bars on short selling. as long as other criteria were met, that I will not go into. It is all over YouTube and in his books and on Investopedia if you want more information. The general idea is to continue the trend in the direction if price is strong and you are bought into that move with a close stop, or if price falls back a little bit, you can get in at a better price. This would be a system typically better suited to a scalper.
1b) The updated risk management according to the above video is to place a stop loss at least 2ATR away from price. These bands already have calculated these values so a trader can place a stop one tick below the 2 or even 3ATR zones depending on their risk appetite. This is assuming you have already received a strong buy signal based on the system you follow. This would be a system typically better suited to a trend-trader.
2a) Taking profits if you are a trend trader has several possibilities. The first, as Dr. Elder suggests, is to place a price target 2ATR values away from your entry giving you approximately a 1:1 risk-reward ratio.
2b) The second possibility if the trade is successful is to ride the trend upwards until a blue bar is printed, suggesting indecision in the market. A modified version of this that could let a winning trade run longer is to wait for the price to close under the 13-EMA in fast markets, or close under the 26-EMA in slightly slower markets to maximize potential winnings.
2c) A scalper trader may wish to have a target at either the value zone if they are playing an extended buy/short back to the mean, or if they are being at the mean, to sell or cover when price extends back out to the 2x or 3x zone.
3) Trend traders can additionally use the ATR zones as a sort of safety guidelines for entering a trade. Anything within the 1ATR zone is typically a safer entry as the market is less volatile at this time. Entering when price has gone into the 2ATR zone is signaled as a strong momentum move and can signal a stronger move in the direction of the current closing bar. While not always the case, it is suggested by Dr. Elder to not enter trend trades at the 3ATR zone as this is where you will be likely looking for a counter-trend retracement back to value and a trader entering here in the direction of the trade has a higher chance of being stopped out or not getting in at the best possible price.

Comprehensive BandsComprehensive Bands is an unabashed mashup combining Bollinger Bands, STARC Bands, and Keltner Channels. STARC Bands are modified Keltner Channels whichdo a better job than the Bollinger Bands when it comes to showing where the top and bottom ranges of natural volatility exist. The pale white exterior cloud is your STARC Band fill. The white line is the STARC basis line. Next closest to the center we have the Bollinger Bands in yellow without a basis line (because BB basis lines aren't that great). Bollinger Bands will help to highlight when volatility breakouts are about to happen. Keltner Channels are based on an exponential moving average represented by the purple basis line in the center usually accompanied by a pair of channel lines above and below, in this case represented as a blue fill.
Every component of this indicator can represent support and resistance on the go. You can use this as a trading system. The method in this case would be similar to the Bollinger Band trading method. The Bollinger Band method involves waiting for price to hit a support or resistance line where it then prints a reversal candle, and to trade in the direction of that reversal. This indicator can improve the Bollinger Band trading method by providing a better idea of when a trend has reached a reversal point through the use of superior maximum/minimum representations and superior basis lines. All this while configured in a visual representation that's light on noise. I'd suggest using this indicator in conjunction with an oscillator you feel comfortable with such as the MacD or RSI. Happy hunting.
Shoutout to LazyBear.
Note: I'm aware that this does not contain Donchian channels and have no regrets.

Breaking Bands by PuppyTherapyToday I have brought to you Breaking Bands. It is a compilation of more flexible Bollinger bands in normal and rainbow mode and Keltner Channels.
Please select at least one or two modes at max otherwise you will have a little colorful overflow on the chart.
Bollinger bands :
- you can select a different baseline calculation than the normal Simple Moving average.
- some of the baselines like T3 suffer from getting too tight too fast you can add a constant+ to the mix which is a basic percentage that will get added to the deviation thus bands will have a minimum threshold.
Rainbow bands :
- same things apply as for Bollinger bands but you can add several layers with different colors under the bands
Keltner Channels :
- only the base moving average applies the rest is calculated via Keltner Channel width
- each coin has a different volatility, therefore, you have to use the multiplier to find the best value for you. The base is mainly for scalping ETHUSD / BTCUSD.
I also added RSI and STOCH to the mix. If you have any of two selected you will see dots on the bottom and on the top signaling overbought/oversold conditions. When the color changes it is signaling a possible trend reversal / weakening trend on the oscilator.

Helly Efficiency RatioIt is a variation of the Grimes Efficiency Ratio by Adam H. Grimes explained here:
adamhgrimes.com
Instead of calculating and then averaging the Donchian Channel Position I use the Keltner channel position, i.e. the HER gives you the average Keltner channel position over the last x days (Keltner channels +/-2.3 ATR20 on EMA20)

BB KC Triangle SignalsBased on Trader Oracle's engulfing candle off Bolinger Band.
I added keltner channels as well. So this prints a symbol ( I use triangles) over the engulfing candle at or near the bolinger band/ keltner channel. Don't have to have the bands printed on the screen for them to work. Seems to work on renko too.
Mutanabby_AI __ OSC+ST+SQZMOMMutanabby_AI OSC+ST+SQZMOM: Multi-Component Trading Analysis Tool
Overview
The Mutanabby_AI OSC+ST+SQZMOM indicator combines three proven technical analysis components into a unified trading system, providing comprehensive market analysis through integrated oscillator signals, trend identification, and volatility assessment.
Core Components
Wave Trend Oscillator (OSC): Identifies overbought and oversold market conditions using exponential moving average calculations. Key threshold levels include overbought zones at 60 and 53, with oversold areas marked at -60 and -53. Crossover signals between the two oscillator lines generate entry opportunities, displayed as colored circles on the chart for easy identification.
Supertrend Indicator (ST): Determines overall market direction using Average True Range calculations with a 2.5 factor and 10-period ATR configuration. Green lines indicate confirmed uptrends while red lines signal downtrend conditions. The indicator automatically adapts to market volatility changes, providing reliable trend identification across different market environments.
Squeeze Momentum (SQZMOM): Compares Bollinger Bands with Keltner Channels to identify consolidation periods and potential breakout scenarios. Black squares indicate squeeze conditions representing low volatility periods, green triangles signal confirmed upward breakouts, and red triangles mark downward breakout confirmations.
Signal Generation Logic
Long Entry Conditions:
Green triangles from Squeeze Momentum component
Supertrend line transitioning to green
Bullish crossovers in Wave Trend Oscillator from oversold territory
Short Entry Conditions:
Red triangles from Squeeze Momentum component
Supertrend line transitioning to red
Bearish crossovers in Wave Trend Oscillator from overbought territory
Automated Risk Management
The indicator incorporates comprehensive risk management through ATR-based calculations. Stop losses are automatically positioned at 3x ATR distance from entry points, while three progressive take profit targets are established at 1x, 2x, and 3x ATR multiples respectively. All risk management levels are clearly displayed on the chart using colored lines and informative labels.
When trend direction changes, the system automatically clears previous risk levels and generates new calculations, ensuring all risk parameters remain current and relevant to existing market conditions.
Alert and Notification System
Comprehensive alert framework includes trend change notifications with complete trade setup details, squeeze release alerts for breakout opportunity identification, and trend weakness warnings for active position management. Alert messages contain specific trading pair information, timeframe specifications, and all relevant entry and exit level data.
Implementation Guidelines
Timeframe Selection: Higher timeframes including 4-hour and daily charts provide the most reliable signals for position trading strategies. One-hour charts demonstrate good performance for day trading applications, while 15-30 minute timeframes enable scalping approaches with enhanced risk management requirements.
Risk Management Integration: Limit individual trade risk to 1-2% of total capital using the automatically calculated stop loss levels for precise position sizing. Implement systematic profit-taking at each target level while adjusting stop loss positions to protect accumulated gains.
Market Volatility Adaptation: The indicator's ATR-based calculations automatically adjust to changing market volatility conditions. During high volatility periods, risk management levels appropriately widen, while low volatility conditions result in tighter risk parameters.
Optimization Techniques
Combine indicator signals with fundamental support and resistance level analysis for enhanced signal validation. Monitor volume patterns to confirm breakout strength, particularly when Squeeze Momentum signals develop. Maintain awareness of scheduled economic events that may influence market behavior independent of technical indicator signals.
The multi-component design provides internal signal confirmation through multiple alignment requirements, significantly reducing false signal occurrence while maintaining reasonable trade frequency for active trading strategies.
Technical Specifications
The Wave Trend Oscillator utilizes customizable channel length (default 10) and average length (default 21) parameters for optimal market sensitivity. Supertrend calculations employ ATR period of 10 with factor multiplier of 2.5 for balanced signal quality. Squeeze Momentum analysis uses Bollinger Band length of 20 periods with 2.0 multiplication factor, combined with Keltner Channel length of 20 periods and 1.5 multiplication factor.
Conclusion
The Mutanabby_AI OSC+ST+SQZMOM indicator provides a systematic approach to technical market analysis through the integration of proven oscillator, trend, and momentum components. Success requires thorough understanding of each element's functionality and disciplined implementation of proper risk management principles.
Practice with demo trading accounts before live implementation to develop familiarity with signal interpretation and trade management procedures. The indicator's systematic approach effectively reduces emotional decision-making while providing clear, objective guidelines for trade entry, management, and exit strategies across various market conditions.

Reversal Radar
**Reversal Radar - Multi-Indicator Confirmation System**
This script combines five proven technical analysis methods into a unified reversal signal, reducing false signals through multi-indicator confirmation.
**INDICATORS USED:**
1. ADX/Directional Movement System
Determines trend direction via +DI and -DI comparison. Signal only during downtrend condition (DI- > DI+). Filters out sideways markets.
2. Custom Linear Regression Momentum
Proprietary momentum calculation based on linear regression. Measures price deviation from Keltner Channel midline. Signal on negative but rising momentum (beginning trend reversal).
3. Williams VIX Fix (WVF)
Identifies panic-selling phases. Calculates relative distance to recent high. Signal when exceeding Bollinger Bands or historical percentiles.
4. RSI Oversold Filter
Default RSI < 35 (adjustable 30-40). Filters only oversold zones for reversal setups.
5. MACD Confirmation
Signal only when MACD below zero line and below signal line. Confirms ongoing weakness before potential reversal.
**FUNCTIONALITY:**
The system generates a BUY signal only when ALL activated filters are simultaneously met. Each indicator can be individually enabled/disabled. Flexible parameter adjustment for different markets/timeframes. Reduces false signals through multi-confirmation.
**APPLICATION:**
Suitable for swing trading on higher timeframes (4H, Daily), reversal strategies in oversold markets, and combination with additional confirmation indicators.
Setup: Activate desired filters, adjust parameters to market/timeframe, check BUY signal as entry opportunity. Additional confirmation through volume/support recommended.
**INNOVATION:**
The Custom Linear Regression Momentum is a proprietary development combining Keltner Channel logic with linear regression for more precise momentum detection than standard oscillators.
**DISCLAIMER:**
This tool serves as technical analysis support. No signal should be traded without additional confirmation and risk management.

Corys Buy and SellThe Cory’s Buy and Sell indicator is an advanced, all-in-one trading toolkit that combines dynamic trend detection, volatility breakout alerts, and visual EMA strength to help traders confidently identify high-probability buy and sell opportunities.
🔍 Key Features:
Adaptive Supertrend Engine
Powered by a modified Keltner Channel, this trend-following algorithm generates timely BUY 🚀 and SELL 😡 signals based on market momentum and volatility, with adjustable sensitivity and factor settings for full control.
EMA Energy Bands (Optional)
A cascade of 15 EMAs (from 9 to 51 periods) visually maps market energy. Colours shift from green (bullish) to red (bearish), showing short- to medium-term trend strength at a glance.
Trend Catcher Overlay
Highlights major shifts in trend using a fast/slow EMA crossover (10 vs 20 EMA). Bars are coloured to reflect bullish reversals for added confidence.
Pullback Signal Detection
Identifies bullish pullback opportunities when price reclaims key EMA levels after a crossover, marked with a green triangle for entry timing.
Built-in Range Detection System
Automatically highlights price consolidation zones using ATR-based logic. When price breaks above or below the detected range, the zone changes colour (green for breakout up, red for breakdown), helping traders spot breakout opportunities.
Smart Labels & Alerts
Instant BUY/SELL labels on the chart and built-in alert conditions make this indicator suitable for both discretionary and automated trading strategies.
⚙️ Customisable Inputs:
Sensitivity (for trend signals)
EMA Energy toggle
Keltner & ATR Lengths
Range Detection parameters and styling
Best For: Trend traders, breakout traders, and swing traders looking for a clean, powerful overlay that combines momentum, structure, and volatility in one tool.
