Simple TrenderOriginates from:
I was reading some Impulse Trading literature by A. Elder.. In it, someone named Kerry Lovvorn proposed "An End of Day Trend Following System" for someone lazy.
Originally it is just price closing above an 8 ema (low) for long. Exit when price closes below an 8 ema (low). The opposite for a short position.
Conditions: Buy when price closed below ema (low) for two bars or more, then closes above. Opposite for a short position. I do not follow this condition. Though it may help with whipsaw.
My condition is when price closes above the 26 ema (low) (works the best for me) I place orders above the initial crossing bars high. Opposite for lows.
I look for stocks that are low in price to go long on. I want the run from 2's to 15's
I look for stocks that are mid-teens/20's in price to go short on. I want the run from 20's to 2's
I look for stock with news and earnings that are already running (up or down) to play the pullback.
These conditions can easily be scanned for on thinkorswim
From first glance, the system looks like CMsling shotsystem. Although, I plagiarized some parts of the codes, because I am inept when it comes to that shit, it differs as it is not a moving average crossover system.
It is a price crossing over concept. A moving average VWAP is used for best entries on pullbacks.
Purpose:
--To catch the majority of a trend/wave/run.
--To identify pullback areas to go long or short while in midst of trend. To catch pullbacks off news and earning runners.
--To catch the initial start of trend with clear rules to enter
--Clear rules to exit
Issues
--possibilities of getting ninja sliced the fuck up. Can be mitigated by entering stocks with decent average volume. And also only going long above 200 ema and short below it. ADX won't work, at the initial start of the trend it will show not trending. Can look at blow off volume at the bottom followed by increase in buying for long and vice versa for short.
--Can give some huge gains away through gap ups or gap downs from news or earnings during trend. However, can get huge gain on gaps from news or earning. Nature of the game.
--Need some brass balls and a supply of pepto to stomach through some of the pullbacks. Gut wrenching seeing big gains dwindle. But they all even out at the end, you hope. (see NBEV and IGC, and CRON and others. shit don't go in straight lines, homie)
Pros
--It's simple and easy. Overall, you profit
--works with any security
Cons
--It can be stressful.
--does not work well on lower time frames. Do not recommend going below 15 minutes
--Possibility of working on 5 minutes with a time frame breakout strategy (15,30 min).
Couple it with LazyBear "Weis Wave Volume" indicator. Works well for pullback entries.
Enjoy. Ride some waves.
ابحث في النصوص البرمجية عن "LazyBear"

Squeeze Momentum Indicator mod#3 This is a corrected version of Squeeze Indicator that initially was authored by LazyBear and modified by KıvanÇ @fr3762 (twitter)
Indicator description: www.forextrading-pips.com
Interpretation:
When both the upper and lower Bollinger Bands go inside the Keltner Channel, the squeeze is on.
When the Bollinger Bands (BOTH lines) start to come out of the Keltner Channel, the squeeze has been released (off).
When one of the Bollinger Bands is out of Keltner Channel, no highlighting is done.
List of all my indicators: www.tradingview.com

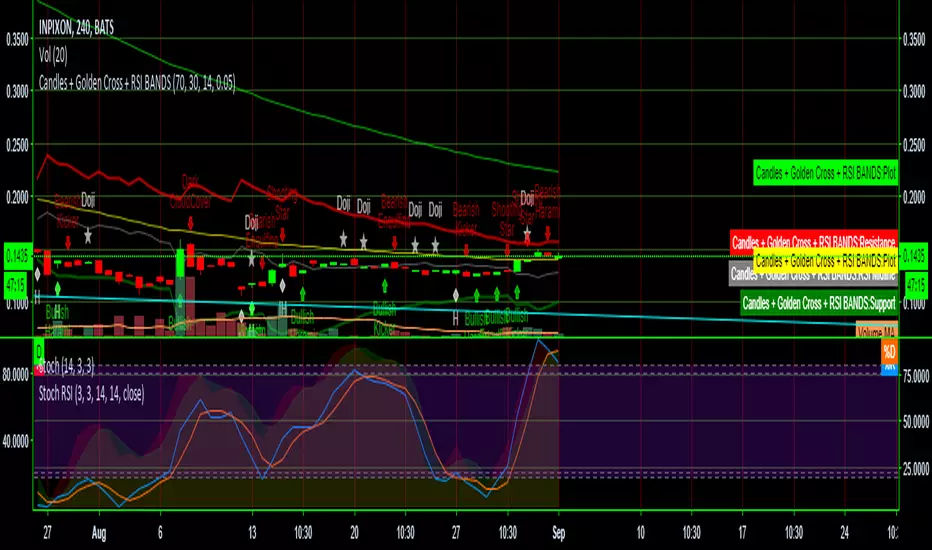
Candles + Golden Cross + RSI BANDSThis script combines three scripts for ease of use
RSI Bands LazyBear
Golden Cross MichMexTrading
Candlestick patterns identified repo32
I combined them because they work exceptionally well together in identifying reversals and other potential changes
COLOUR CODED ULTIMATE OSCILLATOR WITH LEVELS (70/50/30)Just added 70/30/50 levels to @LazyBear 's "Color Coded UO" script.
Happy Trading!

Volumeweighted macd leader with bb squeezethis indicator is very useful for stocks or crytpto especialy 3d and weekly charts
daily shows good too but if u re a daily trader use it if not dont use it coz 4h and daily is noisy some when there is no trend
thats why weekly and 3d is good because it ll give u accurate signal and trend reversals
this is not my script just a combination of lazybear squeeze momentum, macdleader and volume weighted macd of kivanc
i merge them so it also shows bb squeeze on zero line and settings name is median
macd leader is 2 differen color above zero line and below zero line
above zero line if macd leader is green its buy signal and trend is up
if blue it meand no trend or trend reversal so sell or wait if u use 4h or daily but 3d and weekly it means sell
below zero line macd leader color is red and means that there is downtrend and do not buy
when 3d or weekly turns blue on macd leader it means trend reversal about the start
good with heiken ashi candles
DO NOT FORGET THIS IS NOT PERFECT INDICATOR FOR SHORT TERM, PREFER IT 3D AND WEEKLY FR BETTER RESULTS

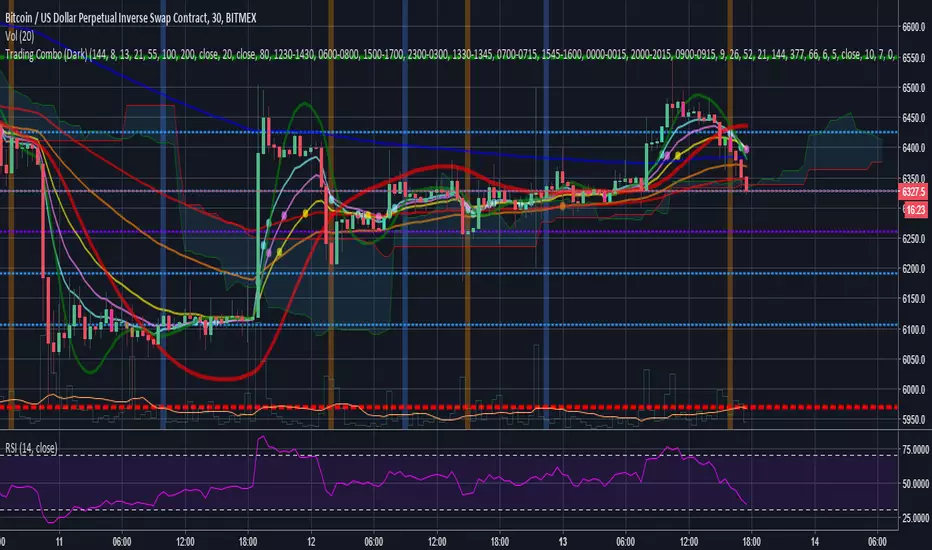
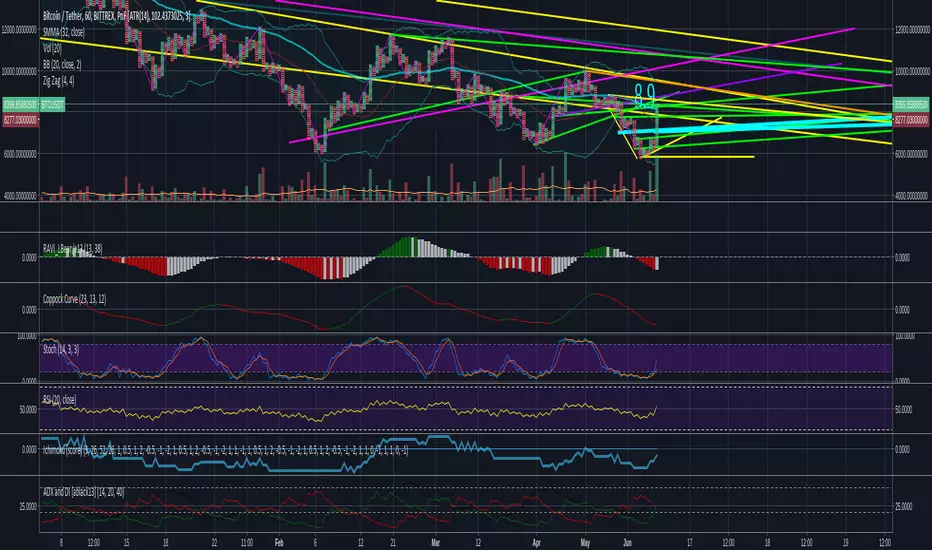
Trading Combo (Dark)This is a combo of many indicators including :
Ichimoku Cloud (With Buy and Sell Signals)
EMA
MA
HULL MA
Fibonacci Lines
Bitcoin 0.57% Kill Zones(Turned off by Default)
MA Turning Points
Reversal(Pin) Bars and Upshaved and Downshaved Bars(Inside and Outside Bars Disabled By default)
Credits to revanchdg for creating the script!
Credits for the source code go to:
Lazybear
ChrisMoody
100kiwi
Gesundheit
Updates:
- Removed all black colors so the script also works fine on the Dark theme
- Changed EMA9 to EMA8 and added EMA13
- Updated some labels for ease of configuration
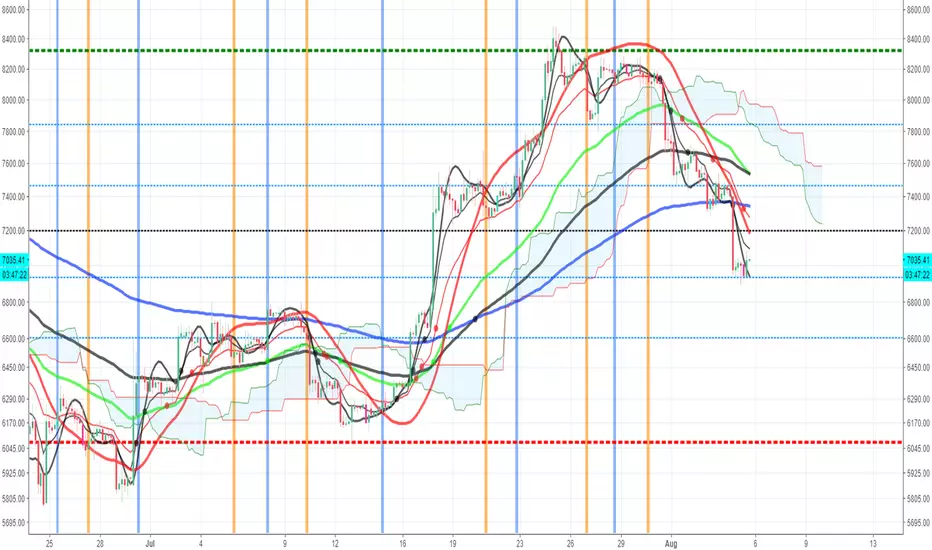
Trading ComboThis is a combo of many indicators including :
Ichimoku Cloud(With Buy and Sell Signals)
EMA
MA
HULL MA
Fibonacci Lines
Bitcoin Kill Zones(Turned off by Default)
MA Turning Points
Reversal(Pin) Bars and Upshaved and Downshaved Bars(Inside and Outside Bars Disabled By default)
Credits to for the source code:
Lazybear
ChrisMoody
100kiwi
Gesundheit
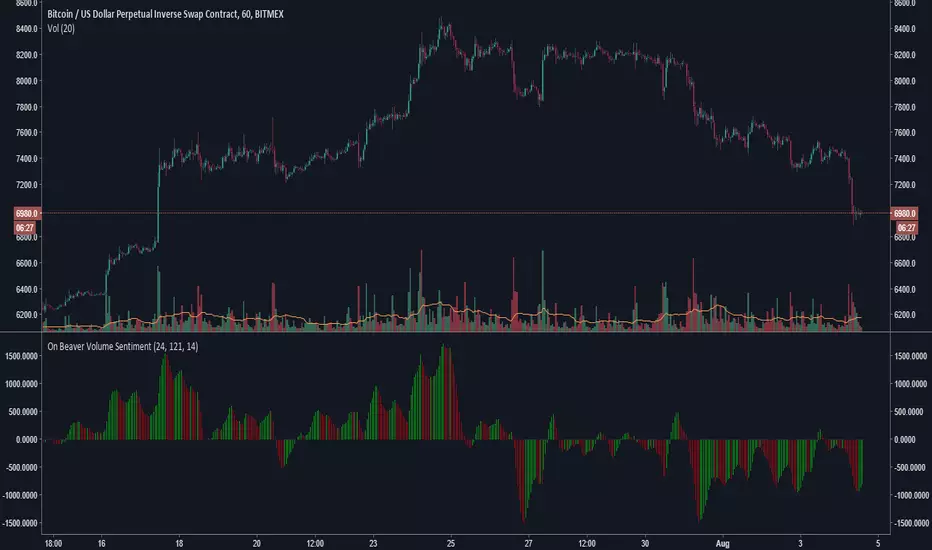
On Beaver Volume SentimentGeneral Market sentiment decoded from two Lazybear OBV's and a CCI.
Lots of strategies with this.
Main point is this indicator tries to be extra sensitive to relative volume changes but keep grounded in sentiment with the cci.
Let me know if you use this!
-Beaverman
RSI Heat Bands [River]This script combines LazyBear's RSI Bands with JayRoger's Bollinger Heat Bands, to give an on chart representation of the price needed to set RSI to each major level, from 20 to 80 (higher values created massive bands).

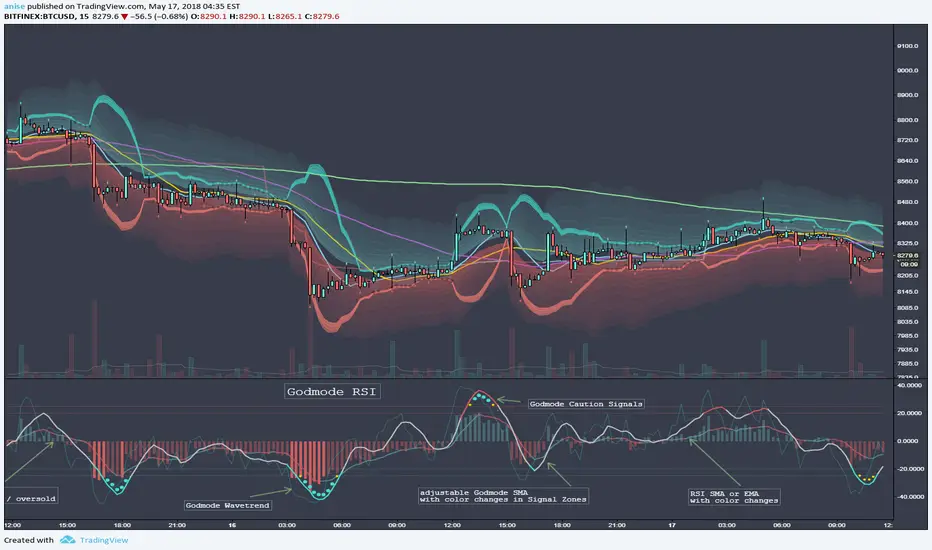
Godmode RSIbased on the popular Godmode Indicator with modifications by LEGION, LAZYBEAR, Ni6HTH4wK, xSilas, oh92, sco77m4r7in
All Credit belongs to them. THX Guys!
This is a Combination of a RSI and Godmode.
RSI has a Simple or Exponential Moving Average, Histogram Color Changes when the RSI reaches the Overbought/Oversold Zones.
Godmode is basicly the same as the Original one only scaled down a bit with slightly adjusted Caution Signal Zones which i like more. I also added the Option to adjust the Length of the 2nd Wavetrend SMA. Removed the Wavetrend Area because it doesnt have any use for me.
Hope you like it.
TD/VixFix/VolatilityStop/Momentum/WeisWave IndicatorsA nice collection of Buy/Sell indicators.
Send me some love if you find this useful:
btc: 1GcWRvkrLwmv2sD8nHYvJ7ZWf4qB1tQ1r9
eth: 0x3061513011c071d9ced8a375e51004aba26410e8
etc: 0xc7ad9ad4d6b0008a1be897666e7f643e7259a509
ltc: LY5pxGhRvNvGJcrb4pnTyH2A2hN1DPjLqt
xvg: DKcou5NyfvVzqLjjDo1eFTNaZuThdZaVUJ
zrx: 0x3061513011c071d9ced8a375e51004aba26410e8
Many thanks to:
glaz, ChrisMoody, admin, LazyBear

Ehlers MESA Adaptive Moving Average [LB + ekoronin fix] AlertEhlers MESA Adaptive Moving Average Alert

RSI + Volume + Bias linesJust added lines for bullish / bearish bias regions to the indicator from LazyBear

Godmode3.2+LSMAThis script has been based on ProwdClown's instructions of usage.
GM settings 9, 6, 3 should be used, LSMA 25, 0 has been implemented.
Original author for main script: LazyBear, xSilas and Ni6HTH4wK, modified By sco77m4r7in and oh92, later modified By scilentor.

Squeeze CMF IndicatorI changed the indicator code of Lazybear to replace the linreg with the Chaikin money flow. I recommend using a Macd because the chaikin money flow can give false signals, like any other indicator.


Noro's Squeeze Momentum Strategy v1.1This strategy uses 3 different indicators:
1) Squeeze Momentum Indicator (by LazyBear)
2) Color of a candle as filter of signals
3) Candle body size as filter of signals (SMA Body)

Twiggs Money FlowNothing new here, just patched an existing script () to be compatible with some of the TradingView settings I wanted to play with.
Thanks to @LazyBear and @SwetSwet for the prior art!

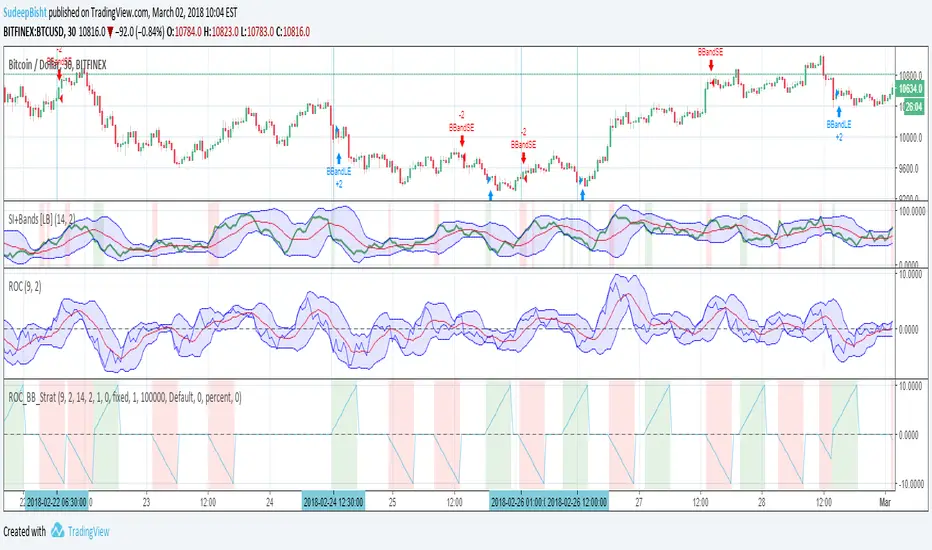
Sb_Rate_Of_Change_BB_Band_strategy Version 1.0The strategy couples the concept of rate of change along with the Bollinger bands.
Along with it LazyBear's RSI/MFI with Volatility Indicator is also taken to reduce the number of trades and improve efficiency.
Strategy (in Layman terms):
If in the past 10 candles RSI/MFI with Volatility Indicator has printed a red/green colour and the roc has gone above/below the Bollinger bands then the short/long order is placed respectively.
Message if you think of any modifications/ enhancements/ any opportunities. :)
Donations/Tips... :) -
BTC: 1BjswGcRR6c23pka7qh5t5k56j46cuyyy2
ETH: 0x64fed71c9d6c931639c7ba4671aeb6b05e6b3781
LTC: LKT2ykQ8QSzzfTDB6Tnsf12xwYPjgq95h4
Fisher Transform Ribbons Indicator V1.0Utilizing the Fisher Transform by Ehlers with different lengths based on multipliers will allow you to notice movements in price and understand whether the shift was a correctional wave, or part of the overall trend.
To learn about Fisher Transform , check out the Fisher Transform documentation: www.mesasoftware.com
Fisher has plenty of functionalities. Ribbons provides you with a view of consistency in price action. If all ribbons flip, generally this is a strong signal that the trend is changing. Fisher is extremely punctual (minimum input lag) and robust (doesn't miss movement). Look for everything, including divergences, trends, and Oversold, Overbought points.
Changing length will further provide you more sensitivity in overselling and buying, while numbing chop.
Enjoy!
And for a single Fisher, check out HPotter's Fisher Transform or LazyBear's implementation of the inverse of the Fisher, which has many other interesting properties

Noro's Squeeze Momentum Strategy v1.0This strategy uses 3 different indicators:
1) Squeeze Momentum Indicator (by LazyBear)
2) Color of a candle as filter of signals
3) Candle body size as filter of signals (EMA Body)
Strategy
If Squeeze Momentum Indicator is indicated uptrend both at the same time by a candle red and at the same time more than a third of a body of an average candle - to open long (and to close short)
If Squeeze Momentum Indicator is indicated downtrend both at the same time by a candle green and at the same time more than a third of a body of an average candle - to open short (and to close long)
