Divergence Indicator Multi [TradingFinder] MACD AO RSI DIV Chart🔵 Introduction
🟣 What is Divergence in Financial Markets?
Divergence in technical analysis happens when the price of a stock moves in a direction opposite to certain indicators. This is a crucial concept in financial markets as it can signal either a trend reversal or a continuation of the current correction in the trend. Understanding divergence helps traders and analysts make more informed decisions.
🟣 Positive Regular Divergence (RD+)
A positive regular divergence occurs at the end of a downtrend, where two price lows form. This divergence appears when the price chart shows a new low, but the indicator does not follow, signaling potential buying opportunities.
Positive divergence indicates increased buying pressure and reduced selling pressure, making it a useful signal for forecasting price increases.
🟣 Negative Regular Divergence (RD-)
A negative regular divergence is seen during an uptrend when two price highs form. The price chart records a new high, but the indicator does not reflect this change, suggesting that a market downturn is likely.
This type of divergence shows strong selling pressure and weaker buying activity, which can help identify selling opportunities.
Both positive and negative divergences are powerful tools for identifying potential trend reversals and key support and resistance levels. For example, when an indicator trends upward while the price moves downward, this creates divergence, warning traders to reconsider their investment strategy.
🟣 Different Types of Divergence in Trading
1. Regular Divergence :
o Positive Regular Divergence (RD+)
o Negative Regular Divergence (RD-)
2. Hidden Divergence :
o Positive Hidden Divergence (HD+)
o Negative Hidden Divergence (HD-)
3.Time Divergence.
Note : This guide focuses specifically on Regular Divergence.
🟣 What is Regular Divergence?
Regular Divergence, often referred to as convergence, occurs when price action and indicators show conflicting patterns, usually signaling the end of a trend. Detecting regular divergence helps traders anticipate potential trend reversals or the formation of reversal patterns.
🔵 How to Use
To optimize the detection of divergence, you can adjust the Fractal Period to specify the length of time for identifying divergence patterns.
Additionally, with the Divergence Detection Method, you can select oscillators like the MACD, RSI, or AO to base divergence detection on.
Divergence in MACD :
MACD divergence occurs when the price chart forms an opposite pattern compared to the MACD line, indicating a potential price reversal.
Divergence in RSI :
In a downtrend, if the price chart forms two consecutive lows with the second lower than the first, but the RSI shows two lows with the second higher, this indicates positive regular divergence, which is a buy signal.
On the other hand, during an uptrend, if the price forms two highs with the second higher than the first, but the RSI shows the second high lower, this points to negative regular divergence, indicating a sell signal.
Divergence in AO (Awesome Oscillator) :
The AO indicator calculates histograms using the difference between 5-period and 34-period simple moving averages. It compares peaks and troughs of these histograms with price movements, detecting divergence and plotting lines and arrows to signal divergence.
🔵 Table
The following table breaks down the main features of the oscillator. It covers four critical categories: Exist, Consecutive, Divergence Quality, and Change Phase Indicator.
Exist : If divergence is detected, a "+" will appear in this row.
Consecutive: Shows the number of consecutive divergences that have formed in a short period.
Divergence Quality : Evaluates the quality of the divergence based on the number of occurrences. One is labeled "Normal," two are "Good," and three or more are considered "Strong."
Change Phase Indicator : If a phase change is detected between two oscillation peaks, this is marked in the table.
ابحث في النصوص البرمجية عن "MACD"

[DuDu95] SSL 4C MACD Laugerre RSI StrategyHello Guys! Nice to meet you all!
Before I start, my nickname has changed to 'DuDu95'!!
This is the Strategy introduced by youtube channel.
I made this based on the open source indicator by kevinmck100, vkno422, KivancOzbilgic. Thank you All!
### Entry Logic
1. Long Entry Logic
- close > SSL Hybrid baseline upper k (keltner channel)
- macd signal > 0 and current MACD value > previous MACD value
- Laguerre RSI < overbought Line.
2. short Entry Logic
- close < SSL Hybrid baseline lower k (keltner channel)
- macd signal < 0 and current MACD value < previous MACD value
- Laguerre RSI > overbought Line.
### Exit Logic
1. Long Exit Logic
- close < SSL Hybrid baseline lower k (keltner channel)
- macd signal < 0
2. short Entry Logic
- close > SSL Hybrid baseline upper k (keltner channel)
- macd signal > 0
### StopLoss
1. Can Choose Stop Loss Type: Percent, ATR, Previous Low / High.
2. Can Chosse inputs of each Stop Loss Type.
### Take Profit
1. Can set Risk Reward Ratio for Take Profit.
- To simplify backtest, I erased all other options except RR Ratio.
- You can add Take Profit Logic by adding options in the code.
2. Can set Take Profit Quantity.
### Risk Manangement
1. Can choose whether to use Risk Manangement Logic.
- This controls the Quantity of the Entry.
- e.g. If you want to take 3% risk per trade and stop loss price is 6% below the long entry price,
then 50% of your equity will be used for trade.
2. Can choose How much risk you would take per trade.
### Plot
1. Added Labels to check the data of entry / exit positions.
2. Changed and Added color different from the original one. (green: #02732A, red: #D92332, yellow: #F2E313)

[blackcat] L1 Stick-Line Merged MACDLevel: 1
Background
The MACD is a superior derivative of moving average crossovers and was developed by Gerald Appel in 1979 as a market timing tool. MACD uses two exponential moving averages with different bar periods, which are then subtracted to form what Mr. Appel calls the Fast Line. A 9-period moving average of the fast line creates the slow line.
Function
L1 Stick-Line Merged MACD merges dif and dea lines with macd sticks by the same color candles. The generation of candles help to confirm the trend contiuation. E.g. yellow candles indicate up trend continuation while blue candles indicate down trend continuation
Key Signal
dif --> classic MACD diff fast line in yellow
dea --> classic MACD dea slow line in fuchsia
macd --> classic difference histogram
upslmerge --> up trend continuation yellow candle merge condition
dnslmerge --> down trend continuation blue candle merge condition
Pros and Cons
Pros:
1. merged line and stick with candles help confirm trend reversal
2. long entry signal is indicated.
Cons:
1. need sophisticated knowledge of MACD to use this well
2. this still requires a lot of MACD experience to obtain reliable trading signals
Remarks
Merge lines and sticks of MACD into candles. Better view of the trend
Readme
In real life, I am a prolific inventor. I have successfully applied for more than 60 international and regional patents in the past 12 years. But in the past two years or so, I have tried to transfer my creativity to the development of trading strategies. Tradingview is the ideal platform for me. I am selecting and contributing some of the hundreds of scripts to publish in Tradingview community. Welcome everyone to interact with me to discuss these interesting pine scripts.
The scripts posted are categorized into 5 levels according to my efforts or manhours put into these works.
Level 1 : interesting script snippets or distinctive improvement from classic indicators or strategy. Level 1 scripts can usually appear in more complex indicators as a function module or element.
Level 2 : composite indicator/strategy. By selecting or combining several independent or dependent functions or sub indicators in proper way, the composite script exhibits a resonance phenomenon which can filter out noise or fake trading signal to enhance trading confidence level.
Level 3 : comprehensive indicator/strategy. They are simple trading systems based on my strategies. They are commonly containing several or all of entry signal, close signal, stop loss, take profit, re-entry, risk management, and position sizing techniques. Even some interesting fundamental and mass psychological aspects are incorporated.
Level 4 : script snippets or functions that do not disclose source code. Interesting element that can reveal market laws and work as raw material for indicators and strategies. If you find Level 1~2 scripts are helpful, Level 4 is a private version that took me far more efforts to develop.
Level 5 : indicator/strategy that do not disclose source code. private version of Level 3 script with my accumulated script processing skills or a large number of custom functions. I had a private function library built in past two years. Level 5 scripts use many of them to achieve private trading strategy.

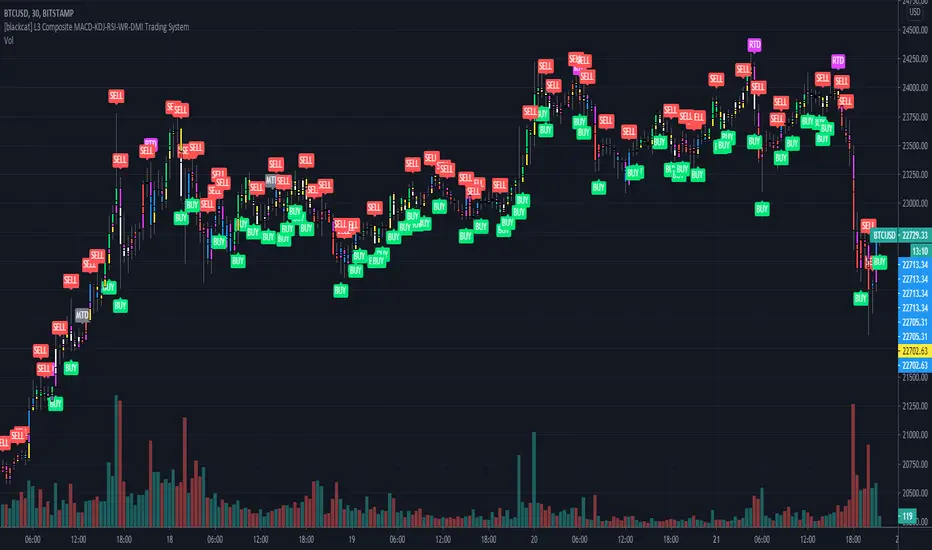
[blackcat] L3 Composite MACD-KDJ-RSI-WR-DMI Trading SystemLevel: 3
Background
The moving average convergence / divergence (MACD) indicator is a pulse oscillator that is mainly used to trade trends. Although it is an oscillator, it is not typically used to identify overbought or oversold conditions. It appears in the diagram as two lines that oscillate without limits. The crossing of the two lines provides trading signals similar to a system with two moving averages.
The KDJ indicator is a technical indicator used to analyze and predict changes in stock performance and the price patterns of a traded asset. The KDJ indicator is also known as the random index. It is a very useful technical indicator that is most commonly used in short term stock market trend analysis. KDJ is a derived form of the Stochastic Oscillator Indicator with the only difference that an additional line is called the J-line. Values of% K and% D indicate whether the security is overbought (over 80) or oversold (under 20). The moments when% K exceeds% D are the moments to sell or buy. The J line represents the deviation of the% D value from% K. The value of J can exceed for the% K and% D lines on the graph.
The Relative Strength Index (RSI) developed by J. Welles Wilder is a pulse oscillator that measures the speed and change of price movements. The RSI hovers between zero and 100. Traditionally, the RSI is considered overbought when it is above 70 and oversold when below 30. Signals can be generated by looking for divergences and error fluctuations.
Williams% R, also known as the Williams Percent Range, is a type of momentum indicator that moves between 0 and -100 and measures overbought and oversold levels. The Williams% R can be used to find entry and exit points in the market. The indicator is very similar to the stochastic oscillator and is used in the same way.
The Directional Movement Index (DMI) is an indicator developed by J. Welles Wilder in 1978 to determine in which direction asset prices are moving. The indicator does this by comparing previous highs and lows and drawing two lines: a positive movement line (+DI) and a negative movement line (-DI). The optional third line is called "Directional Movement (DX)" and it shows the difference between the two lines. When +DI is higher than -DI, the upward pressure on the price is greater than the downward pressure. If -DI is higher than +DI, the price will have greater downward pressure. This indicator can help traders assess the trend direction. Crosses between lines are sometimes used as buying and selling signals.
Function
L3 Composite MACD-KDJ-RSI-WR-DMI Trading System is a simple trading system composed of MACD-KDJ-RSI-WR-DMI together. It can produce 6 types of long entries and 3 types of short entries. It utilizes divergence effect from MACD, KDJ and RSI to detect trend reversal. 6 types of Bottom and top divergence labels are displayed in the chart together with "BUY" and "SELL".
NOTE:In order to make the actual label of the chart more clear, this script does not add stop loss and take profit functions and according labels.
Signal
b1~b3 ---> MACD, KDJ, RSI bottom divergence signal respectively, which hint bull trend may start soon.
d1~d3 ---> MACD, KDJ, RSI top divergence signal respectively, which hint bear trend may start soon.
longentry1~6 ---> with composite indicators together, 6 types of long entry signal are produced.
shortentry1~3 ---> with composite indicators together, 3 types of short entry signal are produced.
Pros and Cons
Pros:
1. excellent open-close, long-short entry signal generation with multiple powerful indicators
2. indicator resonance can help to promote the confidence level of signal and divergence alerts
Cons:
1. integration of multiple indicators is not deeply optimized. fake signal may be produced without filtering schemes
2. no range filter is added
Remarks
To celebrate number of followers exceeds 100. This is my first L3 script published.
Readme
In real life, I am a prolific inventor. I have successfully applied for more than 60 international and regional patents in the past 12 years. But in the past two years or so, I have tried to transfer my creativity to the development of trading strategies. Tradingview is the ideal platform for me. I am selecting and contributing some of the hundreds of scripts to publish in Tradingview community. Welcome everyone to interact with me to discuss these interesting pine scripts.
The scripts posted are categorized into 5 levels according to my efforts or manhours put into these works.
Level 1 : interesting script snippets or distinctive improvement from classic indicators or strategy. Level 1 scripts can usually appear in more complex indicators as a function module or element.
Level 2 : composite indicator/strategy. By selecting or combining several independent or dependent functions or sub indicators in proper way, the composite script exhibits a resonance phenomenon which can filter out noise or fake trading signal to enhance trading confidence level.
Level 3 : comprehensive indicator/strategy. They are simple trading systems based on my strategies. They are commonly containing several or all of entry signal, close signal, stop loss, take profit, re-entry, risk management, and position sizing techniques. Even some interesting fundamental and mass psychological aspects are incorporated.
Level 4 : script snippets or functions that do not disclose source code. Interesting element that can reveal market laws and work as raw material for indicators and strategies. If you find Level 1~2 scripts are helpful, Level 4 is a private version that took me far more efforts to develop.
Level 5 : indicator/strategy that do not disclose source code. private version of Level 3 script with my accumulated script processing skills or a large number of custom functions. I had a private function library built in past two years. Level 5 scripts use many of them to achieve private trading strategy.
RSI & MACD SuiteRSI & MACD Suite
A professional combination of two essential momentum indicators - Relative Strength Index (RSI) and Moving Average Convergence Divergence (MACD) - designed to provide comprehensive market analysis in a single, clean interface.
OVERVIEW
This indicator combines the power of RSI and MACD to help traders identify potential overbought/oversold conditions, momentum shifts, and trend changes. Both indicators are displayed with enhanced visual elements including gradient fills, customizable bands, and clear signal lines.
FEATURES
RSI (Relative Strength Index)
- Customizable Period: Adjustable RSI length (default: 14)
- Visual Zones: Overbought zone (above 70) with green gradient, Oversold zone (below 30) with red gradient, Background fill between bands for easy reference
- Key Levels: Clear horizontal lines at 30, 50, and 70
- Flexible Source: Choose any price source (close, open, high, low, etc.)
MACD (Moving Average Convergence Divergence)
- Customizable Parameters: Fast Length (default: 12), Slow Length (default: 26), Signal Length (default: 9)
- MA Type Selection: Choose between EMA or SMA for both oscillator and signal line
- Color-Coded Histogram: Green for bullish momentum, Red for bearish momentum
- Clear Signal Lines: Blue MACD line and orange Signal line for easy identification
ALERT CONDITIONS
The indicator includes 7 built-in alert conditions:
RSI Alerts:
1. RSI Overbought - Triggers when RSI crosses above 70
2. RSI Oversold - Triggers when RSI crosses below 30
3. RSI Midline Cross - Triggers when RSI crosses the 50 level
MACD Alerts:
4. MACD Bullish Cross - Triggers when MACD line crosses above Signal line
5. MACD Bearish Cross - Triggers when MACD line crosses below Signal line
6. MACD Histogram Bullish - Triggers when histogram crosses above zero
7. MACD Histogram Bearish - Triggers when histogram crosses below zero
CUSTOMIZATION
Clean Organization
- Inputs Tab: Separate groups for RSI and MACD settings
- Style Tab: All visual elements clearly labeled with "RSI -" or "MACD -" prefixes for easy identification
- Full Control: Customize colors, line widths, and visibility of all elements
Visual Clarity
- Professional color scheme optimized for both light and dark themes
- Gradient fills for intuitive zone identification
- Clear separation between RSI and MACD elements
SETTINGS
RSI Settings
- Length: Lookback period for RSI calculation (default: 14)
- Source: Price data to use for calculation (default: close)
MACD Settings
- Source: Price data to use for calculation (default: close)
- Fast Length: Period for fast moving average (default: 12)
- Slow Length: Period for slow moving average (default: 26)
- Signal Length: Period for signal line (default: 9)
- Oscillator MA Type: EMA or SMA for MACD calculation
- Signal MA Type: EMA or SMA for signal line
TECHNICAL DETAILS
- Pine Script Version: v6
- Indicator Type: Oscillator (subplot)
- Calculation Method: RSI uses Relative Strength Index with RMA smoothing, MACD uses Fast MA minus Slow MA with configurable MA types
- Input Validation: Built-in checks to ensure valid parameter combinations
NOTES
- Default settings are industry-standard values (RSI: 14, MACD: 12/26/9)
- All visual elements can be hidden/shown individually in the Style tab
- Alerts must be manually created by users through TradingView's alert system
- This indicator does not repaint - all signals are based on closed candles
WHO SHOULD USE THIS
- Day traders looking for momentum signals
- Swing traders identifying trend changes
- Technical analysts performing multi-indicator analysis
- Traders who want a clean, all-in-one momentum solution
DISCLAIMER
This indicator is for educational and informational purposes only. It does not constitute financial advice. Always perform your own analysis and risk assessment before making trading decisions.
Version: 1.0
Author: aaboomar
License: Mozilla Public License 2.0

VCAI MACD LiteVCAI MACD Lite is a clean, modern version of the classic MACD oscillator, rebuilt with selectable EMA/SMA types and a 2-tone histogram using VCAI’s visual style.
It keeps the indicator lightweight and easy to read while giving clearer momentum shifts through rising/falling histogram colour changes.
What it does
Calculates MACD using your choice of EMA or SMA
Plots signal line and histogram with 2-tone VCAI colours
Highlights changes in momentum strength as histogram bars rise or fade
Works on any market and timeframe
How to use it
Expanding yellow bars reflect strengthening upside momentum; dim yellow shows fading strength.
Darker and lighter VCAI purple tones show momentum behaviour below zero, helping you see when bearish pressure is increasing or weakening.
Part of the VCAI Lite Series — clean, minimal tools.

MACD Divergence Optimizer# MACD Divergence Optimizer - User Guide
## Overview
The **MACD Divergence Optimizer** is a professional-grade technical analysis indicator for TradingView that automatically detects hidden divergences on MACD with volume weighting. It identifies potential reversal points before price action confirms the move, giving traders an early edge.
---
## What is Divergence?
A **divergence** occurs when price and an oscillator (like MACD) move in opposite directions:
- **Bullish Divergence**: Price makes a lower low, but MACD makes a higher low → Potential uptrend reversal
- **Bearish Divergence**: Price makes a higher high, but MACD makes a lower high → Potential downtrend reversal
Divergences are among the most reliable reversal signals in technical analysis.
---
## Indicator Features
### Volume-Weighted MACD
- Standard MACD is calculated on closing price
- This indicator uses **volume-weighted closing prices** for greater accuracy
- Formula: MACD = (Volume-Weighted EMA₁₂ - Volume-Weighted EMA₂₆)
- Volume weighting gives more importance to high-conviction price moves
### Automatic Swing Detection
- Detects local highs and lows (5-bar lookback)
- Tracks the last 5 swings for divergence analysis
- Only meaningful swings are tracked (filtered for noise)
### Smart Signal Generation
- Green triangle (▲) = Bullish Divergence (BUY signal)
- Red triangle (▼) = Bearish Divergence (SELL signal)
- Triangles appear directly on the MACD line for precise entry timing
### Built-in Alerts
- Real-time notifications for divergence signals
- Alerts can trigger mobile push notifications or sound
- Never miss a trading opportunity
---
## How to Use
### Installation
1. Open TradingView and navigate to the Chart
2. Click "Indicator" → Search "MACD Divergence Optimizer"
3. Click "Add to Chart"
4. The indicator appears in a separate panel below the price chart
### Reading the Indicator
**MACD Panel displays:**
- **Blue Line** = MACD (fast momentum)
- **Orange Line** = Signal line (slow momentum)
- **Histogram** (colored bars) = Difference between MACD and Signal
- Green bars = MACD above signal (bullish)
- Red bars = MACD below signal (bearish)
**Divergence Signals:**
- **Green Triangle ▲** = Bullish divergence detected
- Price is lower, but MACD momentum is strengthening
- Look for uptrend reversal
- Confirm with higher closes or volume
- **Red Triangle ▼** = Bearish divergence detected
- Price is higher, but MACD momentum is weakening
- Look for downtrend reversal
- Confirm with lower closes or selling volume
---
## Parameters & Settings
### MACD Fast Length (Default: 12)
- Controls the faster moving average period
- **Lower values** → More responsive, more false signals
- **Higher values** → Smoother, fewer signals
- **Typical range**: 8-15
### MACD Slow Length (Default: 26)
- Controls the slower moving average period
- **Lower values** → Faster divergence detection
- **Higher values** → More reliable, fewer signals
- **Typical range**: 20-35
### Signal Smoothing (Default: 9)
- EMA period applied to MACD itself
- **Lower values** → Faster crossover signals
- **Higher values** → Fewer false crossovers
- **Typical range**: 5-15
### Min Divergence Strength (Default: 0.5%)
- Minimum % difference between current MACD and swing MACD
- **Lower values** → More divergence signals (noisier)
- **Higher values** → Only strong divergences (fewer signals)
- **Recommended**: 0.3% - 1.0%
### Lookback Bars (Default: 75)
- Historical window for analysis
- Larger lookback = more context but slower calculation
- **Typical range**: 50-100
---
## Trading Strategy
### Bullish Divergence (Entry Setup)
1. **Identify Signal**: Green triangle appears on MACD
2. **Confirm Price**: Look for price rejection of the low (bounce)
3. **Volume Check**: Buy on increase in volume at the bounce
4. **Entry**: Above the swing low level
5. **Stop Loss**: Below the most recent swing low
6. **Target**: Next swing high or resistance level
### Bearish Divergence (Entry Setup)
1. **Identify Signal**: Red triangle appears on MACD
2. **Confirm Price**: Look for price rejection of the high
3. **Volume Check**: Sell on increase in volume at rejection
4. **Entry**: Below the swing high level
5. **Stop Loss**: Above the most recent swing high
6. **Target**: Next swing low or support level
### Risk Management
- **Position Size**: Risk only 1-2% per trade
- **Stop Loss**: Place beyond recent swings
- **Take Profit**: Scale out at 1:1, 1:2, 1:3 risk-reward ratios
- **Filter**: Use on higher timeframes (4H, Daily) for reliability
---
## Timeframe Recommendations
| Timeframe | Best For | Signal Quality |
|-----------|----------|---|
| **1H** | Scalping, day trading | Moderate (some noise) |
| **4H** | Swing trading | Excellent |
| **Daily** | Position trading | Excellent |
| **Weekly** | Long-term trends | Excellent |
---
## Tips & Best Practices
### ✅ DO:
- **Use on trends**: Divergences work best when there's a clear trend
- **Combine signals**: Look for confirmation from price action, volume, or moving averages
- **Trade the bounce**: Wait for price to react to the swing, then enter
- **Adjust parameters**: Test different MACD lengths for your trading style
- **Use alerts**: Set up mobile alerts so you don't miss signals
### ❌ DON'T:
- **Trade every signal**: Some signals are stronger than others
- **Trade flat/choppy markets**: Divergences fail in ranging markets
- **Ignore support/resistance**: Trade divergences near key levels for best results
- **Over-leverage**: Divergences are probabilistic, not guaranteed
- **Disable volume analysis**: Always check volume when divergence fires
---
## Advanced Features
### Volume Weighting
The indicator uses **volume-weighted MACD** instead of standard MACD. This means:
- High-volume reversals get more emphasis
- Low-volume moves are smoothed out
- More accurate momentum readings
- Better at identifying true trend changes
### Array Tracking
The indicator tracks the last 5 swings in arrays:
- `swingLows ` = last 5 price lows
- `swingHighs ` = last 5 price highs
- `swingMacds ` = corresponding MACD values
This allows detection of **hidden divergences** not visible in traditional analysis.
---
## Common Questions
**Q: Why didn't the indicator trigger a signal when I see a divergence?**
A: The indicator may require:
- MACD histogram to cross the zero line (confirms momentum shift)
- Minimum strength threshold to be met (adjust Min Divergence Strength)
- At least 5 swings to be recorded in the lookback window
**Q: Can I use this on all timeframes?**
A: Yes, but divergences are more reliable on higher timeframes (4H+). Lower timeframes produce more signals but with more noise.
**Q: Should I trade every green/red triangle?**
A: No. Use them as a heads-up for potential reversals. Always confirm with:
- Price action (rejection of the swing)
- Volume (increasing volume at reversal)
- Key support/resistance levels
**Q: How do I set alerts?**
A:
1. Right-click the indicator → Edit Alerts
2. Check "Bullish Divergence" and/or "Bearish Divergence"
3. Choose notification type (browser, mobile, email)
4. Set frequency to "Once per bar close"
**Q: What's the difference between regular and hidden divergence?**
A: This indicator detects **hidden divergences** (also called continuation divergences):
- **Regular**: Price makes new extreme, but oscillator doesn't
- **Hidden**: Price makes new extreme, oscillator makes new extreme in different direction
- Hidden divergences are often more reliable for continuation plays
---
## Disclaimer
This indicator is provided for educational and informational purposes only. It is not financial advice. Past performance does not guarantee future results. Always use proper risk management and combine with other analysis methods. Trading and investing carry risk of loss. Do your own research before making trading decisions.
---
## Support & Updates
For issues, feature requests, or questions:
- Check the indicator settings and parameter values
- Test on historical data first before live trading
- Adjust parameters to match your trading style and timeframe
---
**Version**: 1.0
**Last Updated**: November 2025
**Compatible**: TradingView v6+

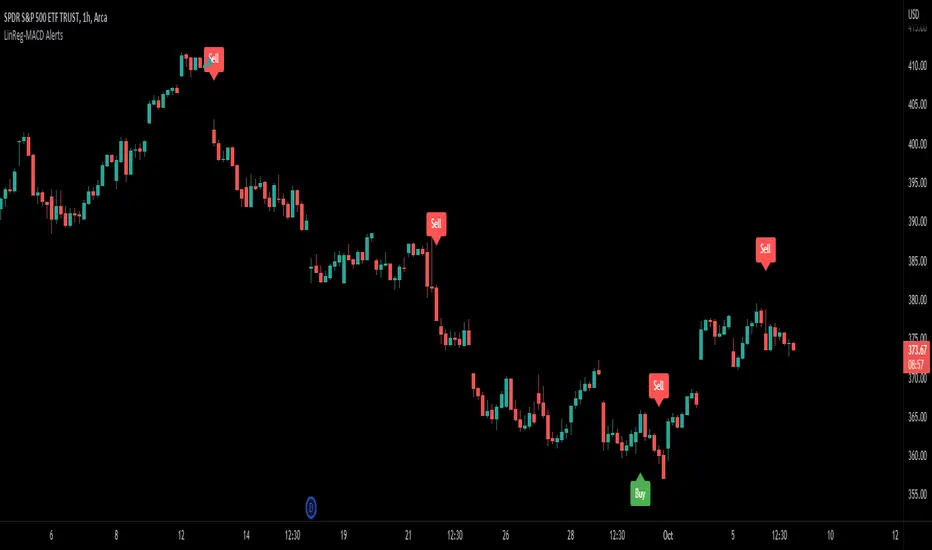
LinReg-MACD AlertsThis is the LinReg-MACD indicator. It issues Buy and Sell signals based on linear regression candles along with a SMA slope filter. It also uses the MACD as confluence for these signals. It also has a LSMA filter. All values are adjustable and there are check boxes for use on different candles. I find it works better for me when swinging higher timeframes like the 1 hour.
Joel on Crypto - MACD ScalpingJoel on Crypto - MACD Scalping
This is a Scalping indicator primarily intended for the 5 minute time frame.
It is based on the Crypto Scalping YouTuber Joel on Crypto's popular 5 minute scalping strategy and this is the indicator he personally use when Scalping.
This is a Multi-timeframe indicator where if you use it on the 5 minute time frame, the MACD Histogram bars will be based on the 1 minute timeframe.
The purpose of this indicator is not to trade it like a bot. The purpose is to grab the traders attention a time where there COULD be a scalping opportunity.
Use this indicator at your own risk.

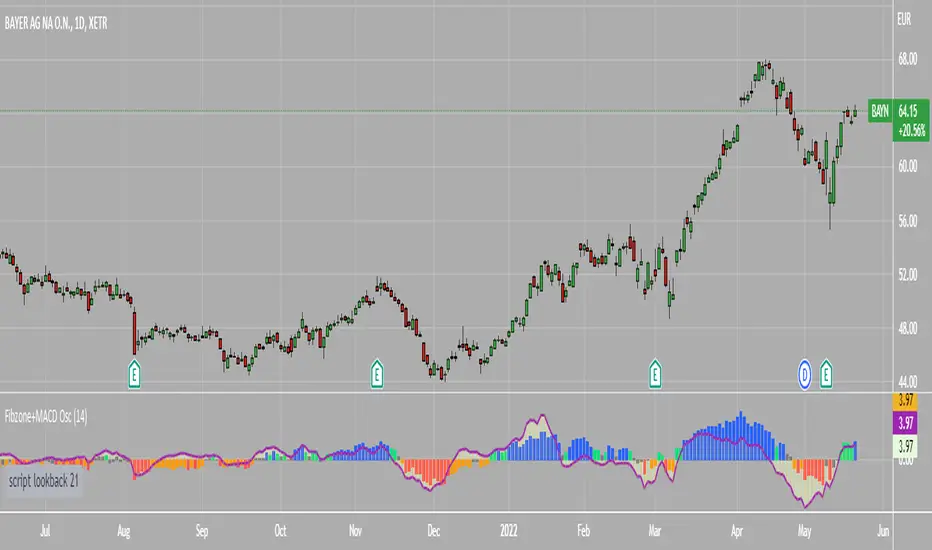
Fibonacci Zone Oscillator With MACD HistogramThe columns
After I found a way to calculate a price as a percent of the middle line of the KeltCOG Channel in the KCGmut indicator (published), I got the idea to use the same trick in the Fbonacci Zone Channel (also published), thus creating an oscillator.
I plot the percent’s as columns with the color of the KeltCOG Channel. Because the channels I created and published (i.e. Fibonacci Zone, Donchian Fibonacci Trading Tool, Keltner Fibzones, and KeltCOG) all use Fibonacci zones, this indicator also reports the position of the close in their zones.
Strategy and Use:
Blue column: Close in uptrend area, 4 supports, 0 resistance, ready to rally up.
Green column: Close in buyers area, 3 supports, 1 resistance, looking up.
Gray column: Close in center area 2 supports, 2 resistances, undecided.
Yellow column: Close in sellers area 1 support, 3 resistances, looking down.
Red column: Close in downtrend area, 0 support, 4 resistances, ready to rally down.
I use this indicator in a layout with three timeframes which I use for stock picking, I pick all stocks with a blue column in every timeframe, the indicator is so clear that I can flip through the 50 charts of my universe of high liquid European blue chips in 15 minutes to make a list of these stocks.
Because I use it in conjunction with KeltCOG I also gave it a ‘script sets lookback’ option which can be checked with a feedback label and switched off in the inputs.
The MACD histogram
I admire the MACD because it is spot on when predicting tops and bottoms. It is also the most sexy indictor in TA. Actually just the histogram is needed, so I don’t show the macd-line and the signal line. I use the same lookback for the slow-ma as for the columns, set the fast-ma to half and the signal-line to a third of the general lookback. Therefore I gave the lookback a minimum value of 6, so the signal gets at least a lookback of 2.
The histogram is plotted three times, first as a whitish area to provide a background, then the colums of the Fibzone Oscillator are plotted, then the histogram as a purple line, which contrasts nicely and then as a hardly visible brown histogram.
The input settings give the option to show columns and histogram separate or together.
Strategy and use:
I think about the columns as showing a ‘longer term chosen momentum’ and about the histogram as a ‘short term power momentum’. I use it as additional information.
Enjoy, Eykpunter.
Bollinger Bands strategy with RSI and MACD v1.0 This is a strategy based on the Bollinger Bands, where buy trades are made when the price crosses the lower line of the Bollinger Bands upwards, and sell trades are made when the price crosses the upper line downwards.
In addition, it is possible through the inputs to enable trading with RSI and MACD, so that buy or sell trades are supported by these two indicators.
Trades are partially and fully closed in the following way, a buy trade will close half of the position when the price touches the middle line of the Bollinger bands and will be fully closed when the price touches the upper band. In the case of a sell position, half of the position will be closed if the price touches the middle band and the entire position will be closed when the price touches the lower band. Alternatively, a fixed take profit can be placed. In case the price moves against us, trailing stops can be placed.
In case of selecting to use RSI, MACD, or MACD variation, trades will be executed as long as The Bollinger Bands, and all the above-mentioned indicators give the same signals, either buy or sell.
For example in the case of selecting only Use RSI, buy trades would be made as long as RSI and BB give buy signals.
Strategy inputs:
-BB source: Bollinger Bands price source.
-Bollinger Bands SMA length: Bollinger Bands simple moving average length.
-Bollinger Bands StdDev length: Bollinger Bands standard deviation length.
-Trail Long Loss (%): Distance in percentage at which the stop loss will initially be placed for buy trades.
-Trail Short Loss (%): Distance in percentage at which the stop loss will be initially placed for sell trades.
-Maximum orders: Maximum of simultaneous operations, for example, if it is 3, up to 3 parallel operations of buy and up to 3 parallel operations of sell will be carried out.
-Position size: Number of contracts per trade.
-Use RSI: If selected, the strategy will also trade based on oversold or overbought signals provided by the RSI.
-RSI source: RSI price source.
-RSI period: The RSI period to use.
-RSI value for buy: If the RSI is below this value, it will give a buy signal.
-RSI value for sell: If the RSI value is above this value, it will give a sell signal.
-Use MACD: If selected, buy trades will be made when the MACD crosses 0 upwards, and sell trades will be made when the MACD crosses 0 downwards.
-Use MACD variation: Only available if MACD is previously selected. In this case, buy trades are made if the MACD value in the last 3 candles has been decreasing, and sell trades are made if the MACD value has been increasing.
-MACD source: MACD price source.
-MACD fast length: MACD fast EMA lenght.
-MACD slow length: MACD slow EMA lenght.
-MACD signal length: MACD signal EMA lenght.
-Use maximum TP long: If selected, a fixed take profit will be placed for buy trades. The position could be closed before reaching this take profit if the price touches one of the lower or upper lines first.
-Maximum take profit long (%): Distance in percentage at which the take profit will be placed for buy trades.
-Use maximum TP short: if selected, a fixed take profit will be placed for sell trades. The position could be closed before reaching this take profit if the price touches one of the lower or upper lines first.
-Maximum take profit short (%): Distance in percentage at which the take profit will be set for sell trades.
I hope you like it and as always all feedback is welcome.

Patron04 MACD DEMA TOFF Alert ScriptI prepared the macd dema indicator made by Toff as a startegy test. There is another strategy like this. But the process is opened according to the intersection of macd and signal. But the difference between my test is this. Macd is testing according to the intersection of 0 value. Macd sells 0 when cut down, buying when 0 cuts down
Toff's Macd dema:

Patron04 TOFF MACD DEMA StrategyI prepared the macd dema indicator made by Toff as a startegy test. There is another strategy like this. But the process is opened according to the intersection of macd and signal. But the difference between my test is this. Macd is testing according to the intersection of 0 value. Macd sells 0 when cut down, buying when 0 cuts down
Toff's Macd dema:

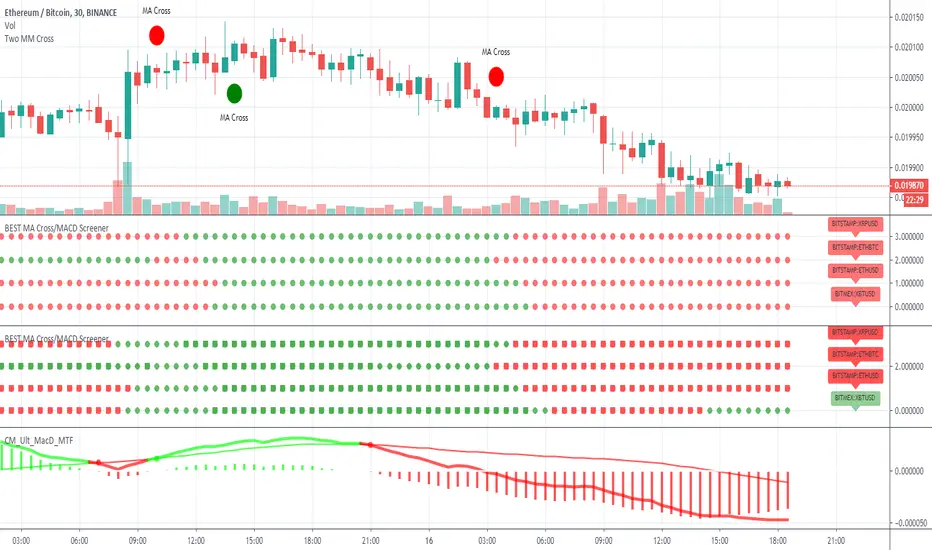
BEST MA Cross/MACD ScreenerHello traders
Continuing deeper and stronger with the screeners' educational serie one more time
I - Concept
This is the first flexible screener I'm releasing. Screener detecting a convergence whenever the MACD and MM cross are giving a signal in the same direction.
Those who know me from TradingView ... are aware that I'm big on convergences. I totally think that 1 indicator isn't enough - whatever the timeframe.
But building my own convergence detection systems has been fruitful for me
II - How did I set the screener
The visual signals are as follow:
- square: MACD + MA cross convergence.
- diamond: Only MACD is selected
- circle: Only MA cross is selected
Then the colors are:
- green when bullish
- red when bearish
Example
Below, I highlighted why we see diamonds on the top screener panel. This is because I only selected the MACD filter
Cool Hacks
Don't forget that you can add the same indicator multiple times on your chart :)
Wishing you all the BEST trading
Dave
MT4 MACD This is a plain macd similar to the one on the mt4
There are extra colors added for visuals
Primarily requested by user Sonja.
macd // signalline // macdmt4 // mt4macd
Dual-Scale MACDDual-Scale MACD is a dual-timeframe momentum indicator that displays a scaled short-term MACD together with a long-term MACD in the same pane.
The short-term MACD can be amplified by a configurable scale ratio, allowing its momentum structure to be visually aligned with the long-term MACD.
All EMA parameters are fully configurable, making this indicator suitable for experimentation with multi-cycle momentum resonance.
Features
Two independent MACD systems (short-term + long-term)
Fully configurable EMA parameters
Adjustable scale ratio for visual alignment
Clean histogram + top-layer signal line
Use cases
Multi-cycle momentum comparison
Trend confirmation & divergence analysis
Studying MACD resonance across time scales
This indicator is intended for analytical and educational purposes.

HaP MACDHaP MACD - Advanced DEMA Assisted Signal Indicator
Overview
The HaP MACD is an evolution of the classic MACD, designed for traders who demand faster response times and clearer trend visualisations. By integrating DEMA (Double Exponential Moving Average) logic into the standard MACD framework, this indicator filters out noise and highlights momentum shifts with a unique color-coded dot system.
How It Works
The indicator calculates two types of MACD: a standard one for the main lines and a DEMA-based one for signal generation. This dual approach ensures you stay in the trend while being alerted the moment the momentum starts to fade.
Visual Guide & Color Logic
The signal dots are placed directly on the MACD line to guide your decisions:
🔵 Blue Dot: The Entry Signal. Appears when DEMA conditions first align for a bullish move.
🟢 Green Dot: Strong Momentum. The trend is active and the MACD value is increasing.
🟠 Orange Dot: Warning Signal. The bullish trend is still active, but the momentum is slowing down (MACD is lower than the previous bar).
🔴 Red Dot: Exit Signal. The bullish condition has ended. It’s time to consider closing the position or tightening stops.
Key Features
Reduced Lag: DEMA integration provides earlier signals than standard EMA-based MACDs.
Trend Monitoring: Easily distinguish between a healthy trend (Green) and a tiring trend (Orange).
Customizable: Choose between EMA and SMA for both the oscillator and signal calculations.
Crossover Markers: Optional triangle markers for classic MACD crossovers (can be enabled in settings).

RSI and MACD Divergence IndicatorThe RSI and MACD Divergence Indicator is a custom Pine Script v6 indicator designed for TradingView that identifies and visualizes divergences between price movements and two technical indicators: the Relative Strength Index (RSI) and the Moving Average Convergence Divergence (MACD). Here's a brief explanation of its functionality:
Divergence Detection: The indicator detects both regular and hidden divergences for RSI, MACD (MACD Line), and Histogram. Regular bullish divergences occur when price makes a lower low but the indicator makes a higher low (suggesting a potential reversal upward), while regular bearish divergences occur when price makes a higher high but the indicator makes a lower high (suggesting a potential reversal downward). Hidden divergences indicate continuation patterns (e.g., higher low in price with a lower low in the indicator for bullish continuation).
Customizable Inputs:
Pivot Bars: Sets the number of bars used to confirm pivot highs and lows (default: 5).
RSI and MACD Parameters: Allows adjustment of RSI length (default: 14) and MACD settings (fast: 12, slow: 26, signal: 9).
Toggle Options: Enables/disables detection of regular and hidden divergences for RSI, MACD, and Histogram individually.
Confirmation: Option to wait for pivot confirmation (default: true), delaying divergence display until the pivot is fully formed.
Show Only Last Divergence: Toggles between showing only the most recent divergence (default: true) or all detected divergences (false), with previous lines and labels cleared when true.
Minimum Divergences: Sets the minimum number of divergence types required at a pivot to display (default: 1, max: 6).
Maximum Pivot Points: Limits the number of historical pivot points to check (default: 10).
Maximum Bars to Check: Restricts analysis to the last specified number of bars (default: 500).
Visualization:
Draws lines connecting the price pivot points where divergences are detected, with customizable colors, widths, and styles (solid, dashed, dotted) for RSI and MACD.
Displays a single label per pivot with vertically stacked text listing all detected divergence types (e.g., "RSI Bull Div\nMACD Bull Div"), using semi-transparent backgrounds (green for bullish, red for bearish) and white text.

long&short signal Smart Money Concepts (SMC) with MACD Signals Smart Money Concepts (SMC) with MACD Signals
Advanced SMC and MACD Integration for Precision Trading
The "Smart Money Concepts (SMC) with MACD Signals" indicator is a powerful and versatile tool designed to enhance trading strategies by integrating two highly effective technical analysis methods into a single, cohesive indicator. This advanced script combines the Smart Money Concepts (SMC) methodology with the Moving Average Convergence Divergence (MACD) indicator to provide traders with a comprehensive trading solution that identifies key market trends and potential trading opportunities.
What It Does:
Smart Money Concepts (SMC):
The SMC component of this indicator identifies significant price levels and zones where market participants, particularly institutional investors, may be active. It calculates high and low anchor levels based on historical price data, creating zones that help traders understand where price action may encounter support or resistance. These anchor levels are used to plot background colors on the chart, highlighting critical areas of interest where price might react, and generating buy (long) and sell (short) signals based on price interactions with these levels.
MACD (Moving Average Convergence Divergence):
The MACD component provides insights into market momentum and trend strength. By calculating the difference between two moving averages and comparing it to a signal line, the MACD indicator helps traders identify potential changes in trend direction. The script plots the MACD line, signal line, and histogram, offering a clear visual representation of market momentum. Buy (long) and sell (short) signals are generated when the MACD line crosses above or below the signal line, providing timely alerts to potential trading opportunities.
Why It’s Special:
This indicator stands out for its dual functionality, combining the price level analysis of SMC with the momentum-based insights of MACD. The integration allows traders to benefit from both trend and price level analysis, offering a more robust and accurate trading tool. The SMC component highlights critical price zones and provides context for price action, while the MACD component confirms the strength and direction of market trends.
By using this combined approach, traders can make more informed decisions based on comprehensive market analysis. The indicator not only helps in identifying significant price levels and potential market reversals but also provides real-time signals to capitalize on these opportunities. Whether you are a day trader or a swing trader, the "Smart Money Concepts (SMC) with MACD Signals" indicator is designed to enhance your trading strategy with precision and clarity.
This unique combination of SMC and MACD offers a powerful toolset for traders looking to refine their trading strategies and improve their market analysis. With its user-friendly visualizations and signal generation, this indicator is an essential addition to any trader’s toolkit.

OBV-MACDThe OBV-MACD indicator is a momentum-based technical analysis tool that helps traders identify trend reversals and trend strength. This Pine script is an implementation of the OBV-MACD indicator that uses the On-Balance Volume (OBV) and Moving Average Convergence Divergence (MACD) indicators to provide a momentum data of OBV.
The OBV-MACD indicator uses the OBV to calculate the cumulative volume, which is then smoothed using two moving averages - fast and slow. The difference between these moving averages is plotted as a histogram, with a signal line plotted over it. A buy signal is generated when the histogram crosses above the signal line, indicating a bullish trend, while a sell signal is generated when the histogram crosses below the signal line, indicating a bearish trend.
This Pine script also includes an OBV-MACD-Donchian version that incorporates Donchian channels for the OBV-MACD. The Donchian channel is a technical analysis indicator that helps traders identify the highs and lows of an asset's price over a certain period. The OBV-MACD-Donchian version uses the OBV-MACD indicator along with the Donchian channels to provide signals that the momentum of OBV is making new high/low during that period of time.
Traders can customize the input parameters of the OBV-MACD indicator, such as the timeframe, method of calculation for the moving averages, and the lengths of the moving averages and breakout lengths. The colors of the plot can also be customized to suit the trader's preferences.

Altered OBV On MACDHere is another strategy along with an indicator that is already published for everyone to use wisely in the tradingview platform. The strategy is not very planned to highlight where to enter and when to exit as it is just a system. So, it is always good practice to follow the signal of simple moving averages and that is the reason you could find those color lines in this strategy as well.
As the indicator signals the entry point, it is wise to decide what the SMA (21, 50, 90, 200) signals us. When the price oscillated around the higher timeframe of moving averages, then it is wise to wait before entering.
OBV:
The OBV is perfect indicator to understand the strength of the particular stock. As the strength increase, the trend of the stock goes high along with price. But, the OBV is considered only with close of previous close which is to make sure the double confirmation on the price to accumulate the volume .
Altered OBV:
So, here is the altered OBV, which basically consider the close of previous close and also buying interested of the day when close is higher than open.
MACD:
I always admire the magic of MACD with pre-defined timeframe. Now, this MACD applied on top of altered OBV to signal us the moving of the ticker strength.
Long:
The long entry occurs when the MACD on Altered OBV signal bullish and the same time the MACD on close already bullish.
Short
The short denotes when the MACD on Altered OBV signal bearish and at the same time the MACD on close already bearish.
I hope this would help on your swing trading strategy.
Happy Investing.

Tom Joseph MACD 5-35 for Elliot WavesThis oscillator for the Elliott Theory has been invented by Tom Joseph and it's useful to correctly count the impulsive and corrective waves.
Its difference compared to a simple MACD is the peculiarity to use the ratio between the Fast SMA (default period set to 5) and the Slow SMA (default period se to 35).
The used formula is as below:
( (fast_SMA / slow_SMA) -1 ) * 100
Hope you could find it useful! 😉

Adaptive, Jurik-Filtered, JMA/DWMA MACD [Loxx]Adaptive, Jurik-Filtered, JMA/DWMA MACD is MACD oscillator with a twist. The traditional calculation of MACD is the between two EMAs of price. This traditional approach yields a very noisy and lagged signal. To solve this problem, JMA/DWMA MACD uses the difference between adaptive Juirk-Filtered price and adaptive DWMA to yield a marked improvement over traditional MACD.
What is JMA / DWMA oscillator (MACD)?
Of all the different combinations of moving average filters to use for a MACD oscillator, we prefer using the JMA - DWMA combination.
JMA is ideal for the fast moving average line because it is quick to respond to reversals, is smooth and can be set to have no overshoot. DWMA (double weighted moving average) is ideal for the slower line as is tends to delay reversing direction until JMA crosses it.
What is Jurik Volty used in the Juirk Filter?
One of the lesser known qualities of Juirk smoothing is that the Jurik smoothing process is adaptive. "Jurik Volty" (a sort of market volatility ) is what makes Jurik smoothing adaptive. The Jurik Volty calculation can be used as both a standalone indicator and to smooth other indicators that you wish to make adaptive.
What is the Jurik Moving Average?
Have you noticed how moving averages add some lag (delay) to your signals? ... especially when price gaps up or down in a big move, and you are waiting for your moving average to catch up? Wait no more! JMA eliminates this problem forever and gives you the best of both worlds: low lag and smooth lines.
Ideally, you would like a filtered signal to be both smooth and lag-free. Lag causes delays in your trades, and increasing lag in your indicators typically result in lower profits. In other words, late comers get what's left on the table after the feast has already begun.
What is an adaptive cycle, and what is Ehlers Autocorrelation Periodogram Algorithm?
From his Ehlers' book Cycle Analytics for Traders Advanced Technical Trading Concepts by John F. Ehlers , 2013, page 135:
"Adaptive filters can have several different meanings. For example, Perry Kaufman’s adaptive moving average ( KAMA ) and Tushar Chande’s variable index dynamic average ( VIDYA ) adapt to changes in volatility . By definition, these filters are reactive to price changes, and therefore they close the barn door after the horse is gone.The adaptive filters discussed in this chapter are the familiar Stochastic , relative strength index ( RSI ), commodity channel index ( CCI ), and band-pass filter.The key parameter in each case is the look-back period used to calculate the indicator. This look-back period is commonly a fixed value. However, since the measured cycle period is changing, it makes sense to adapt these indicators to the measured cycle period. When tradable market cycles are observed, they tend to persist for a short while.Therefore, by tuning the indicators to the measure cycle period they are optimized for current conditions and can even have predictive characteristics.
The dominant cycle period is measured using the Autocorrelation Periodogram Algorithm. That dominant cycle dynamically sets the look-back period for the indicators. I employ my own streamlined computation for the indicators that provide smoother and easier to interpret outputs than traditional methods. Further, the indicator codes have been modified to remove the effects of spectral dilation.This basically creates a whole new set of indicators for your trading arsenal."
Included
- Toggle on/off bar coloring
