Zigzag Chart Points█ OVERVIEW
This indicator displays zigzag based on high and low using latest pine script version 5 , chart.point which using time, index and price as parameters.
Pretty much a strip down using latest pine script function, without any use of library .
This allow pine script user to have an idea of simplified and cleaner code for zigzag.
█ CREDITS
LonesomeTheBlue
█ FEATURES
1. Label can be show / hide including text can be resized.
2. Hover to label, can see tooltip will show price and time.
3. Tooltip will show date and time for hourly timeframe and below while show date only for day timeframe and above.
█ NOTES
1. I admit that chart.point just made the code much more cleaner and save more time. I previously using user-defined type(UDT) which quite hassle.
2. I have no plan to extend this indicator or include alert just I thinking to explore log.error() and runtime.error() , which I may probably release in other publications.
█ HOW TO USE'
Pretty much similar inside mentioned references, which previously I created.
█ REFERENCES
1. Zigzag Array Experimental
2. Simple Zigzag UDT
3. Zig Zag Ratio Simplified
4. Cyclic RSI High Low With Noise Filter
5. Auto AB=CD 1 to 1 Ratio Experimental
ابحث في النصوص البرمجية عن "N+credit最新动态"

Market Performance TableThe Market Performance Table displays the performance of multiple tickers (up to 5) in a table format. The tickers can be customized by selecting them through the indicator settings.
The indicator calculates various metrics for each ticker, including the 1-day change percentage, whether the price is above the 50, 20, and 10-day simple moving averages (SMA), as well as the relative strength compared to the 10/20 SMA and 20/50 SMA crossovers. It also calculates the price deviation from the 50-day SMA.
The table is displayed on the chart and can be positioned in different locations.
Credits for the idea to @Alex_PrimeTrading ;)

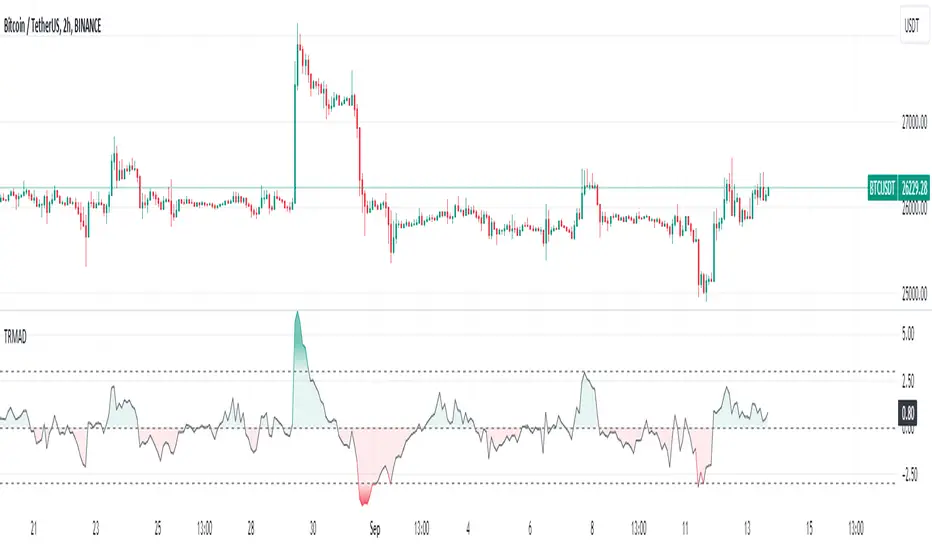
True Range Moving Average Deviation🔶 Overview
The True Range Moving Average Deviation Indicator (TRMAD) is a technical analysis tool that combines elements of price deviation, volatility, and overbought/oversold conditions.
🔶 Key Components
Current price (Close) : most recent closing price of the asset.
Moving Average (MA) : represents a smoothed trendline of the asset's closing prices over a specified period. By default, TRMAD uses the Simple Moving Average (SMA) with a 20-period setting.
Average True Range (ATR) : reflects the average price range between the high and low over a given time frame. By default, TRMAD uses a 14-period ATR setting with a Simple Moving Average (SMA) calculation. ATR quantifies the historical price volatility of the asset, which is crucial for normalizing the price deviation.
🔶 Calculation
(Close - MA) / ATR
🔶 Interpretation
When TRMAD is above +3 ATR , it is often considered an indication that the asset may be overbought, suggesting a potential reversal or correction to the downside.
When TRMAD is below -3 ATR , it is often considered an indication that the asset may be oversold, suggesting a potential reversal or bounce to the upside.
TRMAD values around 0 ATR may indicate a balanced market condition.
🔶 Usage
🔹 Overbought and Oversold Conditions:
TRMAD can help identify overbought and oversold conditions. When TRMAD reaches or exceeds certain user-defined thresholds (e.g., +3 ATR or -3 ATR), it can signal that the asset is in an extreme condition.
Traders can use these extreme conditions to adjust their positions or look for potential reversal opportunities.
🔹 Divergence Analysis:
Traders often analyze divergences between the TRMAD indicator and price movements. For example, if the price is making higher highs while TRMAD is making lower highs (bearish divergence), it could indicate a potential trend reversal.
🔹 Trend Confirmation:
TRMAD can be used in conjunction with other technical indicators to confirm trends. For example, if TRMAD is consistently positive during an uptrend, it can provide confirmation of the trend's strength.
Positive TRMAD : When TRMAD is positive but hasn't reached the overbought threshold (e.g., +3 ATR), it suggests that there is some bullish momentum, but traders may exercise caution and look for other confirming signals before considering a long position.
Negative TRMAD : When TRMAD is negative but hasn't reached the oversold threshold (e.g., -3 ATR), it suggests some bearish sentiment, but traders may want to seek additional confirmation before considering a short position.
🔹 Risk Management:
Traders can use TRMAD as part of their risk management strategy. For instance, if TRMAD suggests that an asset is overbought, a trader might consider tightening their stop-loss orders to manage potential downside risk.
🔶 Credits
The idea about this indicator came from Fabio Figueiredo (Vlad)
[TTI] MarketSmith & IBD Style Model Stock Quarters 📜 ––––HISTORY & CREDITS––––
The MarketSmith & IBD Style Model Stock Quarters another Utility indicator is an original creation by TintinTrading inspired by Investor's Business Daily and William O'Neil style of presenting information. While going through the Model Stocks that IBD has been publishing, I realized that I wanted to see the exam same Quarterly presentation on the time axis in order to compare William O'Neil notes better with my own notes from Tradingview. The script is simple and could help you if you study the CANSLIM methodology.
🦄 –––UNIQUENESS–––
The distinctiveness of this indicator lies in its ability to visually delineate stock quarters directly on the price chart. It serves as a handy tool for traders who adopt a quarterly review of stock performance, in line with MarketSmith and IBD's analysis frameworks.
🛠️ ––––WHAT IT DOES––––
Quarter Marking : Draws a black line at the beginning of each financial quarter (January, April, July, and October).
Quarter Labeling : Places a label at the close of the last month in a quarter, indicating the upcoming quarter with its abbreviation and the last two digits of the year.
💡 ––––HOW TO USE IT––––
👉Installation: Add the indicator to your TradingView chart by searching for " MarketSmith & IBD Style Model Stock Quarters" in the indicator library.
👉Add to New Pane and squash the Pane Length: I add the indicator to a new pane under the price and volume charts and squash the height of the pane so that it looks exactly like the MarketSmith visuals.
👉Visual Cues:
Look for the black lines marking the start of a new quarter.
Observe the labels indicating the upcoming quarter and year, positioned at the close of the last month in a quarter.
👉Interpretation: Use these quarterly markers to align your trading strategies with quarterly performance metrics or to conduct seasonal analysis.
👉Settings: The indicator does not require any user-defined settings, making it straightforward to use.

[TTI] Price confirmation indicator📜 ––––HISTORY & CREDITS––––
The Price Confirmation Indicator is an innovative tool developed by TintinTrading to help his students learn to interpret Price + Volume moves. It is designed to provide traders with a visual cue for price movement confirmation based on both price direction and trading volume. I got the idea from watching Daivd Ryan, how he explains that he looks at volume first before looking at the price of a stock.
🦄 –––UNIQUENESS–––
What sets this indicator apart is its dual analysis approach and easy interpretation: it not only evaluates price movements but also takes trading volume into account. The indicator's color-coded bars are dynamically adjusted based on the volume difference from a 50-day Simple Moving Average (SMA) of the volume. This offers traders an intuitive way to gauge both the market's direction and its strength.
🛠️ ––––WHAT IT DOES––––
The Price Confirmation Indicator performs the following functions:
👉Price Movement: Determines whether each trading day is an 'Up Day' or a 'Down Day' based on the closing price.
👉Volume Analysis: Calculates the 50-day SMA of trading volume and identifies the volume difference in percentage terms.
👉Transparency Adjustment: Dynamically adjusts the transparency of colored bars based on the volume difference.
👉Bar Coloring: Colors the bars blue for 'Up Days' and purple for 'Down Days', with the transparency indicating the strength of the volume.
Transparency Tresholds:
Full color (no transparency 0%) - Volume is greater than 40% compared to the 50DSMA Volume
Strong color (little transparency 20%) - Volume is between 20% and 40% greater than the 50DSMA Volume
Noticable color (moderate transparency 40%) - Volume is between 0% and 20% greater than the 50DSMA Volume
Negligable color (strong transparency 60%) - Volume is light and is less than 50DSMA Volume with less than 20% lower.
Weak color (very strong transparency 80%) - Volume is below 50DSMA, with between 40% and 20% lower.
Very weak color (max transparency 90%) - Volume is below 50DSMA, with between -40% and -80% lower.
Alarming weak color (color is orange) - Volume is noticably light - this generally signals velocity contraction before a breakout.
💡 ––––HOW TO USE IT––––
Installation: Search for " Price Confirmation Indicator" in TradingView’s indicator library and add it to your chart.
Settings:
Price Up Color: Customize the color for 'Up Days'.
Price Down Color: Customize the color for 'Down Days'.
Interpretation:
Blue bars signify 'Up Days', and their transparency indicates the strength of the volume.
Purple bars represent 'Down Days', with transparency again indicating volume strength.
Orange bars signify extremely low volume days.
Volume Transparency: The less transparent the bar, the stronger the volume, aiding in confirming the price direction.
The indicator is a great tool for newer traders to get in the habit of reading Price & Volume together!

[TTI] Closing Range Indicator📜 ––––HISTORY & CREDITS––––
This Pine Script Utility indicator, titled " Closing Range Indicator," is designed and developed by TintinTrading but inspired by the teaching of Investor's Business Daily (IBD) and William O'Neil. It aims to help traders identify the closing range of a given timeframe, either daily or weekly.
🦄 –––UNIQUENESS–––
The unique feature of this indicator lies in its ability to simulate a functionality of Closing Range calculation based on hovering of the mouse over the close. It employs a conditional display that allows the user to set the indicator as 'invisible' without removing it from the chart and hence provides a numerical closing range value when hovering over the indicator.
🛠️ ––––WHAT IT DOES––––
The Closing Range Indicator calculates the closing range of a trading bar in terms of percentages. It computes the difference between the closing price and the low price of the bar, and then divides it by the range of the bar.
A stock that closes on the high would display 100%
A stock that closes on the low would display 0%
Generally, the higher the percentage the more bullish the close but there are exceptions to this rule.
The indicator can operate on two timeframes:
Daily : Computes the closing range based on the daily high, low, and closing prices.
Weekly : Computes the closing range based on the weekly high, low, and closing prices. If you enable the weekly it will show the weekly close on all daily timeframes. Meaning that if the week Closing range is 54.15% on Friday, it will show the value 54.15% for all days prior to Friday from the same week.
The indicator places a label at the close of each bar, with the label's tooltip showing the calculated closing range percentage. I generally hide the label and just reference the tooltip calculation with a a hoover on top of the bar.
💡 ––––HOW TO USE IT––––
Installation: Add the indicator to your TradingView chart by searching for " Closing Range Indicator" in the indicator library.
Reorder: Reorder the indicator so that it sits as the first indicator (even above the price) on the Pane. This will make sure that you always trigger the tooltip functionality.
Go to Settings:
Timeframe: Choose between daily ('D') and weekly ('W') timeframes from the settings.
Visibility: Enable the 'Make Invisible' option if you want the indicator to be hidden.
Interpretation:
A higher percentage indicates that the closing price is closer to the high of the range, signaling bullish sentiment.
A lower percentage indicates bearish sentiment.
Tooltip: Hover over the label to view the closing range in percentage terms.

Default Strategy Template© CN_FX-999
Coded By Christian Nataliano
First Coded In 14/06/2023
Last Edited In 22/06/2023
This Is A Default Strategy Template That Can Make Your Strategy Scripts More Organized With The Benefit Of Having The Same Layouts & Not Needing To Copy Over The Common Codes Such As Displaying Backtest Results, Opening & Closing Trades, Pine Connector Capabilities And A Clean User Input Interface. This Is A Blank Strategy Script So Feel Free To Use It As Your Default Template For Your Future Strategies.
Credits To Some Of The Custom Code In The Scripts To © ZenAndTheArtOfTrading, Especially The Table Data Plotting

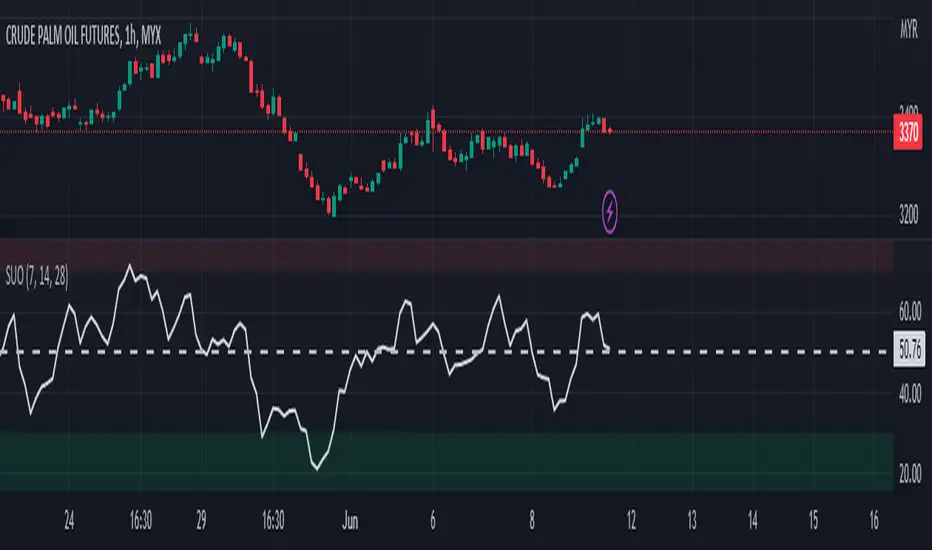
Simple Ultimate Oscillator█ OVERVIEW
This indicator as an educational and showcase the usage of user-defined types (UDT) or objects for Ultimate Oscillator.
█ CREDITS
TradingView
█ FEATURES
1. Color of plot is based on contrast color of chart background.
2. Plot fill of overbought and oversold.
3. Support Multi Timeframe.
Simple Ichimoku Kinko Hyo Cloud█ OVERVIEW
This indicator as an educational and showcase the usage of user-defined types or objects (UDT) for Ichimoku Kinko Hyo or Ichimoku Cloud.
█ CREDITS
TradingView

AIR Supertrend (Average Interpercentile Range)Supertrend (ST) is a popular stop loss and trend identification script. The simplicity of seeing a clean trend on a chart makes it attractive, yet it is restricted by only allowing the source, length and multiplier to be adjusted, & these tend to have a limited effect on the properties of the identified trend.
There is a wide variety of interesting ST scripts on TradingView that give the user more control, but none to my knowledge, based on measuring the statistical dispersion of Average Interpercentile Range (AIR).
Two more levels of control:
Normally, ATR Average True Range is used to calculate the range in ST. ATR is initially calculated using RMA to smooth out True Range. This script gives the user the option of changing the MA to some more interesting varieties & modifying their parameters.
The default range setting when you load the indicator on a chart will be AIR.
The real strength of the indicator, however, and the reason I am publishing it, is to release AIR. Play round with the percentile range setting. Lowering it will allow you to stay longer in a trade in a volatile market. Raising it will make it tighter.
For comparison, you can switch back the range setting to ATR and load up RMA to see how the original, classic ST plots.
Alerts are included in this version. Alway use a stop loss.
DISCLAIMER: None of this is financial advice.
Credits to these authors, whose hard work inspired parts of this script:
@ KivancOzbilgic - SuperTrend
@ KioseffTrading - Tillson T3 MA
@ cheatcountry - Hann Window Smoothing
@ mutantdog - Interquartile Range function in his 'Blaze' script

T3 JMA KAMA VWMAEnhancing Trading Performance with T3 JMA KAMA VWMA Indicator
Introduction
In the dynamic world of trading, staying ahead of market trends and capitalizing on volume-driven opportunities can greatly influence trading performance. To address this, we have developed the T3 JMA KAMA VWMA Indicator, an innovative tool that modifies the traditional Volume Weighted Moving Average (VWMA) formula to increase responsiveness and exploit high-volume market conditions for optimal position entry. This article delves into the idea behind this modification and how it can benefit traders seeking to gain an edge in the market.
The Idea Behind the Modification
The core concept behind modifying the VWMA formula is to leverage more responsive moving averages (MAs) that align with high-volume market activity. Traditional VWMA utilizes the Simple Moving Average (SMA) as the basis for calculating the weighted average. While the SMA is effective in providing a smoothed perspective of price movements, it may lack the desired responsiveness to capitalize on short-term volume-driven opportunities.
To address this limitation, our T3 JMA KAMA VWMA Indicator incorporates three advanced moving averages: T3, JMA, and KAMA. These MAs offer enhanced responsiveness, allowing traders to react swiftly to changing market conditions influenced by volume.
T3 (T3 New and T3 Normal):
The T3 moving average, one of the components of our indicator, applies a proprietary algorithm that provides smoother and more responsive trend signals. By utilizing T3, we ensure that the VWMA calculation aligns with the dynamic nature of high-volume markets, enabling traders to capture price movements accurately.
JMA (Jurik Moving Average):
The JMA component further enhances the indicator's responsiveness by incorporating phase shifting and power adjustment. This adaptive approach ensures that the moving average remains sensitive to changes in volume and price dynamics. As a result, traders can identify turning points and anticipate potential trend reversals, precisely timing their position entries.
KAMA (Kaufman's Adaptive Moving Average):
KAMA is an adaptive moving average designed to dynamically adjust its sensitivity based on market conditions. By incorporating KAMA into our VWMA modification, we ensure that the moving average adapts to varying volume levels and captures the essence of volume-driven price movements. Traders can confidently enter positions during periods of high trading volume, aligning their strategies with market activity.
Benefits and Usage
The modified T3 JMA KAMA VWMA Indicator offers several advantages to traders looking to exploit high-volume market conditions for position entry:
Increased Responsiveness: By incorporating more responsive moving averages, the indicator enables traders to react quickly to changes in volume and capture short-term opportunities more effectively.
Enhanced Entry Timing: The modified VWMA aligns with high-volume periods, allowing traders to enter positions precisely during price movements influenced by significant trading activity.
Improved Accuracy: The combination of T3, JMA, and KAMA within the VWMA formula enhances the accuracy of trend identification, reversals, and overall market analysis.
Comprehensive Market Insights: The T3 JMA KAMA VWMA Indicator provides a holistic view of market conditions by considering both price and volume dynamics. This comprehensive perspective helps traders make informed decisions.
Analysis and Interpretation
The modified VWMA formula with T3, JMA, and KAMA offers traders a valuable tool for analyzing volume-driven market conditions. By incorporating these advanced moving averages into the VWMA calculation, the indicator becomes more responsive to changes in volume, potentially providing deeper insights into price movements.
When analyzing the modified VWMA, it is essential to consider the following points:
Identifying High-Volume Periods:
The modified VWMA is designed to capture price movements during high-volume periods. Traders can use this indicator to identify potential market trends and determine whether significant trading activity is driving price action. By focusing on these periods, traders may gain a better understanding of the market sentiment and adjust their strategies accordingly.
Confirmation of Trend Strength:
The modified VWMA can serve as a confirmation tool for assessing the strength of a trend. When the VWMA line aligns with the overall trend direction, it suggests that the current price movement is supported by volume. This confirmation can provide traders with additional confidence in their analysis and help them make more informed trading decisions.
Potential Entry and Exit Points:
One of the primary purposes of the modified VWMA is to assist traders in identifying potential entry and exit points. By capturing volume-driven price movements, the indicator can highlight areas where market participants are actively participating, indicating potential opportunities for opening or closing positions. Traders can use this information in conjunction with other technical analysis tools to develop comprehensive trading strategies.
Interpretation of Angle and Gradient:
The modified VWMA incorporates an angle calculation and color gradient to further enhance interpretation. The angle of the VWMA line represents the slope of the indicator, providing insights into the momentum of price movements. A steep angle indicates strong momentum, while a shallow angle suggests a slowdown. The color gradient helps visualize this angle, with green indicating bullish momentum and purple indicating bearish momentum.
Conclusion
By modifying the VWMA formula to incorporate the T3, JMA, and KAMA moving averages, the T3 JMA KAMA VWMA Indicator offers traders an innovative tool to exploit high-volume market conditions for optimal position entry. This modification enhances responsiveness, improves timing, and provides comprehensive market insights.
Enjoy checking it out!
---
Credits to:
◾ @cheatcountry – Hann Window Smoothing
◾ @loxx – T3
◾ @everget – JMA

Draw Line For High Low Custom Range Interactive█ OVERVIEW
This indicator is an educational indicator to make pine coders easier to how to use interactive inputs with User-Defined Type (UDT) especially when dealing input.time.
█ NOTES
This indicator is not perfect but it is a good starting point or template to start develop custom range interactive indicator.
█ INSPIRATIONS
ABC 123 Harmonic Ratio Custom Range Interactive
XABCD Harmonic Pattern Custom Range Interactive
PriceTimeInteractive
█ CREDITS
CAGR Custom Range
Pine scripts are now interactive
█ FEATURES
1. High Low points are determined based on points selected.
2. Line will be drawn after points are correctly arranged.
3. Label show error once wrong point is selected, move the point as instructed in example.
█ EXAMPLES / USAGE

L&S Volatility IndexOverview
L&S Volatility Index is a tool designed to helps traders identify overpriced or underpriced moments in the market and adjust their trading strategies accordingly.
Calculations
This tool calculates how far the price is from the 21-period simple moving average as a ratio of the average historical volatility calculated over the last 21 candles.
How It Works
A L&S Volatility Index with a value greater than 30% may indicate that the asset is overpriced or underpriced relative to its average price.
How To Use
If the L&S Volatility Index > 30, the asset is overpriced or underpriced. This means that there is a good probability of initiating a mean reversion.
If the L&S Volatility Index < 30, the asset is in a fair price region. This means that it is acceptable to buy or sell in that price region.
Where To Use
Mean Reversion Strategy
Breakout Strategy
What Makes it Original
There is already an indicator that use a normalized calculation and a different approach to calculate historical volatility, whereas this script calculation is non-normalized and historical volatility is calculated using Don Fishback's formula. All calculations are used as originally described.
Credits
The L&S Volatility Index indicator was originally written by L&S Educação Financeira.
Historical Volatility calculation is based on the book "Odds: The Key to 90% Winners" written by Don Fishback.

Chandelier Exit ZLSMA StrategyIntroducing a Powerful Trading Indicator: Chandelier Exit with ZLSMA
If you're a trader, you know the importance of having the right tools and indicators to make informed decisions. That's why we're excited to introduce a powerful new trading indicator that combines the Chandelier Exit and ZLSMA: two widely-used and effective indicators for technical analysis.
The Chandelier Exit (CE) is a popular trailing stop-loss indicator developed by Chuck LeBeau. It's designed to follow the price trend of a security and provide an exit signal when the price crosses below the CE line. The CE line is based on the Average True Range (ATR), which is a measure of volatility. This means that the CE line adjusts to the volatility of the security, making it a reliable indicator for trailing stop-losses.
The ZLEMA (Zero Lag Exponential Moving Average) is a type of exponential moving average that's designed to reduce lag and improve signal accuracy. The ZLSMA takes into account not only the current price but also past prices, using a weighted formula to calculate the moving average. This makes it a smoother indicator than traditional moving averages, and less prone to giving false signals.
When combined, the CE and ZLSMA create a powerful indicator that can help traders identify trend changes and make more informed trading decisions. The CE provides the trailing stop-loss signal, while the ZLSMA provides a smoother trend line to help identify potential entry and exit points.
In our indicator, the CE and ZLSMA are plotted together on the chart, making it easy to see both the trailing stop-loss and the trend line at the same time. The CE line is displayed as a dotted line, while the ZLSMA line is displayed as a solid line.
Using this indicator, traders can set their stop-loss levels based on the CE line, while also using the ZLSMA line to identify potential entry and exit points. The combination of these two indicators can help traders reduce their risk and improve their trading performance.
In conclusion, the Chandelier Exit with ZLSMA is a powerful trading indicator that combines two effective technical analysis tools. By using this indicator, traders can identify trend changes, set stop-loss levels, and make more informed trading decisions. Try it out for yourself and see how it can improve your trading performance.
Warning: The results in the backtest are from a repainting strategy. Don't take them seriously. You need to do a dry live test in order to test it for its useability.
-
Here is a description of each input field in the provided source code:
length: An integer input used as the period for the ATR (Average True Range) calculation. Default value is 1.
mult: A float input used as a multiplier for the ATR value. Default value is 2.
showLabels: A boolean input that determines whether to display buy/sell labels on the chart. Default value is false.
isSignalLabelEnabled: A boolean input that determines whether to display signal labels on the chart. Default value is true.
useClose: A boolean input that determines whether to use the close price for extrema calculations. Default value is true.
zcolorchange: A boolean input that determines whether to enable rising/decreasing highlighting for the ZLSMA (Zero-Lag Exponential Moving Average) line. Default value is false.
zlsmaLength: An integer input used as the length for the ZLSMA calculation. Default value is 50.
offset: An integer input used as an offset for the ZLSMA calculation. Default value is 0.
-
Ty for checking this out and good luck on your trading journey! Likes and comments are appreciated. 👍
--
Credits to:
▪ @everget – Chandelier Exit (CE)
▪ @netweaver2022 – ZLSMA

Bollinger Bands - Breakout StrategyThe Bollinger Bands - Breakout Strategy is a trend-following optimized for short-term trading in the crypto market. This strategy employs the Bollinger Bands, a widely recognized technical indicator, as its primary instrument for pinpointing potential trades. It is capable of executing both long and short positions, depending on whether the market is in a spot or futures, and is particularly effective in trending markets.
The strategy boasts a high degree of configurability, allowing users to set the Bollinger Bands period and deviation, trend filter, volatility filter, trade direction filter, rate of change filter, and date filter. Furthermore, it offers options for Take Profit, Stop Loss, and Trailing Stop for both long and short positions, ensuring a comprehensive risk management approach. The inclusion of a maximum intraday loss feature adds another layer of protection, making this strategy a valuable tool for traders seeking a professional and adaptable trading system.
Name : Bollinger Bands - Breakout Strategy
Category : Trend Follower based on Bollinger Bands
Operating mode : Long and Short on Futures or Long on Spot
Trade duration : Intraday
Timeframe : 2H, 3H, 4H, 5H
Market : Crypto
Suggested usage : Trending Markets
Entry : When the price crosses above or below the Bollinger Bands
Exit : Opposite Cross or Profit target, Trailing stop or Stop loss
Configuration :
- Bollinger Bands period and deviation
- Trend Filter
- Volatility Filter
- Trade direction filter
- Rate of Change filter
- Date Filter (for backtesting purposes)
- Take Profit, Stop Loss and Trailing Stop for long and short positions
- Risk Management: Max Intraday Loss
Backtesting :
⁃ Exchange: BINANCE
⁃ Pair: BTCUSDT.P
⁃ Timeframe: 4H
⁃ Fee: 0.025%
⁃ Slippage: 1
- Initial Capital: 10000 USDT
- Position sizing: 10% of Equity
- Start : 2019-09-19 (Out Of Sample from 2022-12-23)
- Bar magnifier: on
Credits :
- LucF of Pine Coders for f_security function to avoid repainting using security.
- QuantNomad for Monthly Table.
Disclaimer : Risk Management is crucial, so adjust stop loss to your comfort level. A tight stop loss can help minimise potential losses. Use at your own risk.
How you or we can improve? Source code is open so share your ideas!
Leave a comment and smash the boost button!
Thanks for your attention, happy to support the TradingView community.

Joel Greenblatt Magic FormulaJoel Greenblatt Magic Formula. I always wanted to make this.
The Indicator shows 3 values.
ROC,EY,SUM.
ROC= Return On Capital.
EY=Earnings Yield
SUM= Addition of Two.
Formula:
ROC=EBIT / (Net Working Capital + Net Fixed Assets).
EY = EBIT / Enterprise value
Enterprise Value=(Market value of equity + Net Interest-bearing debt)
To implement the strategy, investors start by identifying a universe of stocks, typically large-cap or mid-cap companies that trade on a major stock exchange. Next, they rank the stocks based on their ROC and EY. The companies with the best combination of these two metrics are considered the best investments (based on this ranking).
For example, a stock that ranks 10th on EY and 99th on ROIC gets a value of 109. The two ranks are simply added together and all stocks are ranked on the sum of the two ranks. The stocks with the lowest values are best.
All credits to "The Little Book That Beats The Market" by Joel Greenblatt
The Magic Formula strategy is a stock selection method popularized by Joel Greenblatt’s book The Little Book That Beats the Market.
It involves ranking companies based on Two factors:
A high return on capital and A high Earnings Yield.
The companies with the best combination of these two metrics are considered the best investments. The strategy aims to find undervalued companies with strong financials that have the potential for high returns over the long term.

Yesterday’s High Breakout - Trend Following StrategyYesterday’s High Breakout it is a trading system based on the analysis of yesterday's highs, it works in trend-following mode therefore it opens a long position at the breakout of yesterday's highs even if they occur several times in one day.
There are several methods for exiting a trade, each with its own unique strategy. The first method involves setting Take-Profit and Stop-Loss percentages, while the second utilizes a trailing-stop with a specified offset value. The third method calls for a conditional exit when the candle closes below a reference EMA.
Additionally, operational filters can be applied based on the volatility of the currency pair, such as calculating the percentage change from the opening or incorporating a gap to the previous day's high levels. These filters help to anticipate or delay entry into the market, mitigating the risk of false breakouts.
In the specific case of NULS, a 9% Take-Profit and a 3% Stop-Loss were set, with an activated trailing-stop percentage. To postpone entry and avoid false breakouts, a 1% gap was added to the price of yesterday's highs.
Name : Yesterday's High Breakout - Trend Follower Strategy
Author : @tumiza999
Category : Trend Follower, Breakout of Yesterday's High.
Operating mode : Spot or Futures (only long).
Trade duration : Intraday.
Timeframe : 30M, 1H, 2H, 4H
Market : Crypto
Suggested usage : Short-term trading, when the market is in trend and it is showing high volatility.
Entry : When there is a breakout of Yesterday's High.
Exit : Profit target or Trailing stop, Stop loss or Crossunder EMA.
Configuration :
- Gap to anticipate or postpone the entry before or after the identified level
- Rate of Change for Entry Condition
- Take Profit, Stop Loss and Trailing Stop
- EMA length
Backtesting :
⁃ Exchange: BINANCE
⁃ Pair: NULSUSDT
⁃ Timeframe: 2H
⁃ Fee: 0.075%
⁃ Slippage: 1
- Initial Capital: 10000 USDT
- Position sizing: 10% of Equity
- Start : 2018-07-26 (Out Of Sample from 2022-12-23)
- Bar magnifier: on
Credits : LucF for Pine Coders (f_security function to avoid repainting using security)
Disclaimer : Risk Management is crucial, so adjust stop loss to your comfort level. A tight stop loss can help minimise potential losses. Use at your own risk.
How you or we can improve? Source code is open so share your ideas!
Leave a comment and smash the boost button!
Thanks for your attention, happy to support the TradingView community.

Sniffer
╭━━━╮╱╱╱╱╭━╮╭━╮
┃╭━╮┃╱╱╱╱┃╭╯┃╭╯
┃╰━━┳━╮╭┳╯╰┳╯╰┳━━┳━╮
╰━━╮┃╭╮╋╋╮╭┻╮╭┫┃━┫╭╯
┃╰━╯┃┃┃┃┃┃┃╱┃┃┃┃━┫┃
╰━━━┻╯╰┻╯╰╯╱╰╯╰━━┻╯
Overview
A vast majority of modern data analysis & modelling techniques rely upon the idea of hidden patterns, wether it is some type of visualisation tool or some form of a complex machine learning algorithm, the one thing that they have in common is the belief, that patterns tell us what’s hidden behind plain numbers. The same philosophy has been adopted by many traders & investors worldwide, there’s an entire school of thought that operates purely based on chart patterns. This is where Sniffer comes in, it is a tool designed to simplify & quantify the job of pattern recognition on any given price chart, by combining various factors & techniques that generate high-quality results.
This tool analyses bars selected by the user, and highlights bar clusters on the chart that exhibit similar behaviour across multiple dimensions. It can detect a single candle pattern like hammers or dojis, or it can handle multiple candles like morning/evening stars or double tops/bottoms, and many more. In fact, the tool is completely independent of such specific candle formations, instead, it works on the idea of vector similarity and generates a degree of similarity for every single combination of candles. Only the top-n matches are highlighted, users get to choose which patterns they want to analyse and to what degree, by customising the feature-space.
Background
In the world of trading, a common use-case is to scan a price chart for some specific candlestick formations & price structures, and then the chart is further analysed in reference to these events. Traders are often trying to answer questions like, when was the last time price showed similar behaviour, what are the instances similar to what price is doing right now, what happens when price forms a pattern like this, what were some of other indicators doing when this happened last(RSI, CCI, ADX etc), and many other abstract ideas to have a stronger confluence or to confirm a bias.Having such a context can be vital in making better informed decisions, but doing this manually on a chart that has thousands of candles can have many disadvantages. It’s tedious, human errors are rather likely, and even if it’s done with pin-point accuracy, chances are that we’ll miss out on many pieces of information. This is the thought that gave birth to Sniffer .
Sniffer tries to provide a general solution for pattern-based analysis by deploying vector-similarity computation techniques, that cover the full-breadth of a price chart and generate a list of top-n matches based on the criteria selected by the user. Most of these techniques come from the data science space, where vector similarity is often implemented to solve classification & clustering problems. Sniffer uses same principles of vector comparison, and computes a degree of similarity for every single candle formation within the selected range, and as a result generates a similarity matrix that captures how similar or dissimilar a set of candles is to the input set selected by the user.
How It Works
A brief overview of how the tool is implemented:
- Every bar is processed, and a set of features are mapped to it.
- Bars selected by the user are captured, and saved for later use.
- Once the all the bars have been processed, candles are back-tracked and degree of similarity is computed for every single bar(max-limit is 5000 bars).
- Degree of similarity is computed by comparing attributes like price range, candle breadth & volume etc.
- Similarity matrix is sorted and top-n results are highlighted on the chart through boxes of different colors.
A brief overview of the features space for bars:
- Range: Difference between high & low
- Body: Difference between close & open
- Volume: Traded volume for that candle
- Head: Upper wick for green candles & lower wick for red candles
- Tail: Lower wick for green candles & upper wick for red candles
- BTR: Body to Range ratio
- HTR: Head to Range ratio
- TTR: Tail to Range ratio
- HTB: Head to Body ratio
- TTB: Tail to Body ratio
- ROC: Rate of change for HL2 for four different periods
- RSI: Relative Strength Index
- CCI: Commodity Channel Index
- Stochastic: Stochastic Index
- ADX: DMI+, DMI- & ADX
A brief overview of how degree of similarity is calculated:
- Each bar set is compared to the inout bar set within the selected feature space
- Features are represented as vectors, and distance between the vectors is calculated
- Shorter the distance, greater the similarity
- Different distance calculation methods are available to choose from, such as Cosine, Euclidean, Lorentzian, Manhattan, & Pearson
- Each method is likely to generate slightly different results, users are expected to select the method & the feature space that best fits their use-case
How To Use It
- Usage of this tool is relatively straightforward, users can add this indicator to their chart and similar clusters will be highlighted automatically
- Users need to select a time range that will be treated as input, and bars within that range become the input formation for similarity calculations
- Boxes will be draw around the clusters that fit the matching criteria
- Boxes are color-coded, green color boxes represent the top one-third of the top-n matches, yellow boxes represent the middle third, red boxes are for bottom third, and white box represents user-input
- Boxes colors will be adjusted as you adjust input parameters, such as number of matches or look-back period
User Settings
Users can configure the following options:
- Select the time-range to set input bars
- Select the look-back period, number of candles to backtrack for similarity search
- Select the number of top-n matches to show on the chart
- Select the method for similarity calculation
- Adjust the feature space, this enables addition of custom features, such as pattern recognition, technical indicators, rate of change etc
- Toggle verbosity, shows degree of similarity as a percentage value inside the box
Top Features
- Pattern Agnostic: Designed to work with variable number of candles & complex patterns
- Customisable Feature Space: Users get to add custom features to each bar
- Comprehensive Comparison: Generates a degree of similarity for all possible combinations
Final Note
- Similarity matches will be shown only within last 4500 bars.
- In theory, it is possible to compute similarity for any size candle formations, indicator has been tested with formations of 50+ candles, but it is recommended to select smaller range for faster & cleaner results.
- As you move to smaller time frames, selected time range will provide a larger number of candles as input, which can produce undesired results, it is advised to adjust your selection when you change time frames. Seeking suggestions on how to directly receive bars as user input, instead of time range.
- At times, users may see array index out of bound error when setting up this indicator, this generally happens when the input range is not properly configured. So, it should disappear after you select the input range, still trying to figure out where it is coming from, suggestions are welcome.
Credits
- @HeWhoMustNotBeNamed for publishing such a handy PineScript Logger, it certainly made the job a lot easier.

Regression Channel Alternative MTF V2█ OVERVIEW
This indicator is a predecessor to Regression Channel Alternative MTF , which is coded based on latest update of type, object and method.
█ IMPORTANT NOTES
This indicator is NOT true Multi Timeframe (MTF) but considered as Alternative MTF which calculate 100 bars for Primary MTF, can be refer from provided line helper.
The timeframe scenarios are defined based on Position, Swing and Intraday Trader.
Suppported Timeframe : W, D, 60, 15, 5 and 1.
Channel drawn based on regression calculation.
Angle channel is NOT supported.
█ INSPIRATIONS
These timeframe scenarios are defined based on Harmonic Trading : Volume Three written by Scott M Carney.
By applying channel on each timeframe, MW or ABCD patterns can be easily identified manually.
This can also be applied on other chart patterns.
█ CREDITS
Scott M Carney, Harmonic Trading : Volume Three (Reaction vs. Reversal)
█ TIMEFRAME EXPLAINED
Higher / Distal : The (next) longer or larger comparative timeframe after primary pattern has been identified.
Primary / Clear : Timeframe that possess the clearest pattern structure.
Lower / Proximate : The (next) shorter timeframe after primary pattern has been identified.
Lowest : Check primary timeframe as main reference.
█ FEATURES
Color is determined by trend or timeframe.
Some color is depends on chart contrast color.
Color is determined by trend or timeframe.
█ EXAMPLE OF USAGE / EXPLAINATION

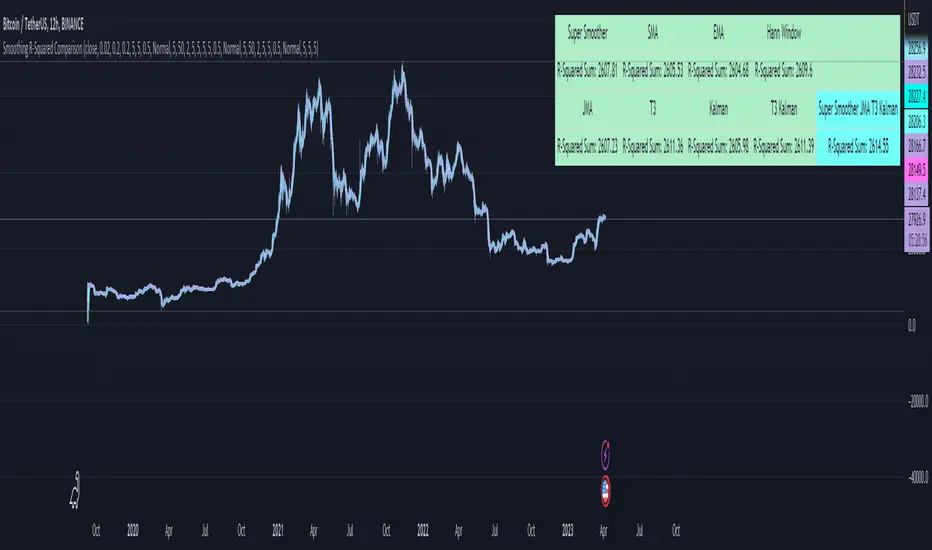
Smoothing R-Squared ComparisonIntroduction
Heyo guys, here I made a comparison between my favorised smoothing algorithms.
I chose the R-Squared value as rating factor to accomplish the comparison.
The indicator is non-repainting.
Description
In technical analysis, traders often use moving averages to smooth out the noise in price data and identify trends. While moving averages are a useful tool, they can also obscure important information about the underlying relationship between the price and the smoothed price.
One way to evaluate this relationship is by calculating the R-squared value, which represents the proportion of the variance in the price that can be explained by the smoothed price in a linear regression model.
This PineScript code implements a smoothing R-squared comparison indicator.
It provides a comparison of different smoothing techniques such as Kalman filter, T3, JMA, EMA, SMA, Super Smoother and some special combinations of them.
The Kalman filter is a mathematical algorithm that uses a series of measurements observed over time, containing statistical noise and other inaccuracies, and produces estimates of unknown variables that tend to be more accurate than those based on a single measurement.
The input parameters for the Kalman filter include the process noise covariance and the measurement noise covariance, which help to adjust the sensitivity of the filter to changes in the input data.
The T3 smoothing technique is a popular method used in technical analysis to remove noise from a signal.
The input parameters for the T3 smoothing method include the length of the window used for smoothing, the type of smoothing used (Normal or New), and the smoothing factor used to adjust the sensitivity to changes in the input data.
The JMA smoothing technique is another popular method used in technical analysis to remove noise from a signal.
The input parameters for the JMA smoothing method include the length of the window used for smoothing, the phase used to shift the input data before applying the smoothing algorithm, and the power used to adjust the sensitivity of the JMA to changes in the input data.
The EMA and SMA techniques are also popular methods used in technical analysis to remove noise from a signal.
The input parameters for the EMA and SMA techniques include the length of the window used for smoothing.
The indicator displays a comparison of the R-squared values for each smoothing technique, which provides an indication of how well the technique is fitting the data.
Higher R-squared values indicate a better fit. By adjusting the input parameters for each smoothing technique, the user can compare the effectiveness of different techniques in removing noise from the input data.
Usage
You can use it to find the best fitting smoothing method for the timeframe you usually use.
Just apply it on your preferred timeframe and look for the highlighted table cell.
Conclusion
It seems like the T3 works best on timeframes under 4H.
There's where I am active, so I will use this one more in the future.
Thank you for checking this out. Enjoy your day and leave me a like or comment. 🧙♂️
---
Credits to:
▪@loxx – T3
▪@balipour – Super Smoother
▪ChatGPT – Wrote 80 % of this article and helped with the research
Local Model Kalman Market ModeIntroduction
Heyo guys, I made a new (repainting) indicator called Local Model Kalman Market Mode.
I created it, because I wanted a reliable market mode filter for a potential mean-reversion strategy (e. g. BB Scalping).
On the screenshot you can see an example of how to use it in a BB strategy.
E.g. you would enter long when you have bullish divergence, price is under lower BB, price is under PoC and this indicator here shows range-bound market phase.
You would exit long on cross of the middle band.
Description
The indicator attempts to model the underlying market using different local models (i.e., trending, range-bound, and choppy) and combines them using the T3 Six Pole Kalman Filter to generate an overall estimate of the market.
The Fisher Transform is applied on the price to reach a Gaussian distribution, which increases the accuracy of the indicator itself.
The script first defines state variables for each local model, which include trend direction, trend strength, upper and lower bounds of the range, volatility of the range, level of choppiness, and strength of noise.
Then, likelihood functions are defined for each local model based on the state variables.
Next, the script calculates weights for each local model based on their likelihoods and uses them to calculate state variables for the overall estimate.
Finally, the script combines the state variables using the T3 Six Pole Kalman Filter to generate the overall estimate of the market, which is plotted in blue.
Fundamental Knowledge
To understand the explanation of the indicator and the script, there are a few fundamental concepts that you need to know:
Market: A market is a place where buyers and sellers come together to exchange goods or services.
In the context of trading, the market refers to the exchange where financial instruments such as stocks, currencies, and commodities are bought and sold.
Local models: Local models are statistical models that attempt to capture the characteristics of a particular market regime.
For example, a trending market may have different characteristics than a range-bound market or a choppy market.
The indicator uses different local models to capture the different market regimes.
Trend direction and strength: The trend direction refers to the direction in which the market is moving, either up or down.
The trend strength refers to the magnitude of the trend and how likely it is to continue.
Range-bound market: A range-bound market is a market where prices are trading within a specific range, with a clear upper and lower bound.
Choppiness: Choppiness refers to the degree of irregularity in price movements, often seen in sideways or range-bound markets.
Volatility: Volatility refers to the degree of variation in the price of an asset over time. High volatility implies larger price swings, while low volatility implies smaller price swings.
Kalman filter: A Kalman filter is a mathematical algorithm used to estimate an unknown variable from a series of noisy measurements.
In the context of the indicator, the Kalman filter is used to generate an overall estimate of the market by combining the local models.
T3 Six Pole Kalman Filter: The T3 Six Pole Kalman Filter is a specific type of Kalman filter that is used to smooth and filter time-series data, such as the price data of a financial instrument.
Fisher Transform: The Fisher Transform is a mathematical formula used to transform any probability distribution into a Gaussian normal distribution. It is commonly used in technical analysis to transform non-Gaussian indicators into ones that are more suitable for statistical analysis.
By understanding these fundamental concepts, you should have a basic understanding of how the indicator works and how it generates an overall estimate of the market.
Usage
You can use this indicator on every timeframe.
Users can customize the parameters of the T3 Six Pole Kalman Filter (T3 length, alpha, beta, gamma, and delta) using input functions.
Try out different parameter combinations and use the one you like most.
Thank you for checking this out. Leave me a comment or boost the script, when you wanna support me! 👌
--
Credits to:
▪@HPotter - Fisher Transform
▪@loxx - T3
▪ChatGPT - Helped me to make the research for this indicator and helped to build the core algorithm.

Adaptive Fusion ADX VortexIntroduction
The Adaptive Fusion ADX DI Vortex Indicator is a powerful tool designed to help traders identify trend strength and potential trend reversals in the market. This indicator uses a combination of technical analysis (TA) and mathematical concepts to provide accurate and reliable signals.
Features
The Adaptive Fusion ADX DI Vortex Indicator has several features that make it a powerful tool for traders. The Fusion Mode combines the Vortex Indicator and the ADX DI indicator to provide a more accurate picture of the market. The Hurst Exponent Filter helps to filter out choppy markets (inspired by balipour). Additionally, the indicator can be customized with various inputs and settings to suit individual trading strategies.
Signals
The enterLong signal is generated when the algorithm detects that it's a good time to buy a stock or other asset. This signal is based on certain conditions such as the values of technical indicators like ADX, Vortex, and Fusion. For example, if the ADX value is above a certain threshold and there is a crossover between the plus and minus lines of the ADX indicator, then the algorithm will generate an enterLong signal.
Similarly, the enterShort signal is generated when the algorithm detects that it's a good time to sell a stock or other asset. This signal is also based on certain conditions such as the values of technical indicators like ADX, Vortex, and Fusion. For example, if the ADX value is above a certain threshold and there is a crossunder between the plus and minus lines of the ADX indicator, then the algorithm will generate an enterShort signal.
The exitLong and exitShort signals are generated when the algorithm detects that it's a good time to close a long or short position, respectively. These signals are also based on certain conditions such as the values of technical indicators like ADX, Vortex, and Fusion. For example, if the ADX value crosses above a certain threshold or there is a crossover between the minus and plus lines of the ADX indicator, then the algorithm will generate an exitLong signal.
Usage
Traders can use this indicator in a variety of ways, depending on their trading strategy and style. Short-term traders may use it to identify short-term trends and potential trade opportunities, while long-term traders may use it to identify long-term trends and potential investment opportunities. The indicator can also be used to confirm other technical indicators or trading signals. Personally, I prefer to use it for short-term trades.
Strengths
One of the strengths of the Adaptive Fusion ADX DI Vortex Indicator is its accuracy and reliability. The indicator uses a combination of TA and mathematical concepts to provide accurate and reliable signals, helping traders make informed trading decisions. It is also versatile and can be used in a variety of trading strategies.
Weaknesses
While this indicator has many strengths, it also has some weaknesses. One of the weaknesses is that it can generate false signals in choppy or sideways markets. Additionally, the indicator may lag behind the market, making it less effective in fast-moving markets. That's a reason why I included the Hurst Exponent Filter and special smoothing.
Concepts
The Adaptive ADX DI Vortex Indicator with Fusion Mode and Hurst Filter is based on several key concepts. The Average Directional Index (ADX) is used to measure trend strength, while the Vortex Indicator is used to identify trend reversals. The Hurst Exponent is used to filter out noise and provide a more accurate picture of the market.
In conclusion, the Adaptive Fusion ADX DI Vortex Indicator is a versatile and powerful tool for traders. By combining technical analysis and mathematical concepts, this indicator provides accurate and reliable signals for identifying trend strength and potential trend reversals. While it has some weaknesses, its many strengths and features make it a valuable addition to any trader's toolbox.
---
Credits to:
▪️@cheatcountry – Hann Window Smoohing
▪️@loxx – VHF and T3
▪️@balipour – Hurst Exponent Filter

Stochastic Momentum Index (SMI) Refurbished▮Introduction
Stochastic Momentum Index (SMI) Indicator is a technical indicator used in technical analysis of stocks and other financial instruments.
It was developed by William Blau in 1993 and is considered to be a momentum indicator that can help identify trend reversal points.
Basically, it's a combination of the True Strength Index with a signal line to help identify turning points in the market.
SMI uses the stochastic formula to compare the current closing price of an asset with the maximum and minimum price range over a specific period.
He then compares this ratio to a short-term moving average to create an indicator that oscillates between -100 and +100.
When the SMI is above 0, it is considered positive, indicating that the current price is above the short-term moving average.
When it is below 0, it is considered negative, indicating that the current price is below the short-term moving average.
Traders use the SMI to identify potential trend reversal points.
When the indicator reaches an extreme level above +40 or below -40, a trend reversal is possible.
Furthermore, traders also watch for divergences between the SMI and the asset price to identify potential trading opportunities.
It is important to remember that the SMI is a technical indicator and as such should be used in conjunction with other technical analysis tools to get a complete picture of the market situation.
▮ Improvements
The following features were added:
1. 7 color themes, for TSI, Signal and Histogram.
2. Possibility to customize moving average type for TSI/Signal.
3. Dynamic Zones.
4. Crossing Alerts.
5. Alert points on specific ranges.
5. Coloring of bars according to TSI/Signal/Histogram.
▮ Themes
Examples:
▮ About Dynamic Zones
'Most indicators use a fixed zone for buy and sell signals.
Here's a concept based on zones that are responsive to the past levels of the indicator.'
The concept of Dynamic Zones was described by Leo Zamansky ( Ph .D.) and David Stendahl, in the magazine of Stocks & Commodities V15:7 (306-310).
Basically, a statistical calculation is made to define the extreme levels, delimiting a possible overbought/oversold region.
Given user-defined probabilities, the percentile is calculated using the method of Nearest Rank.
It is calculated by taking the difference between the data point and the number of data points below it, then dividing by the total number of data points in the set.
The result is expressed as a percentage.
This provides a measure of how a particular value compares to other values in a data set, identifying outliers or values that are significantly higher or lower than the rest of the data.
▮ What to look for
1. Divergences/weakening of a trend/reversal:
2. Supports, resistances, pullbacks:
3. Overbought/Oversold Points:
▮ Thanks and Credits
- TradingView and PineCoders: for SMI and Moving Averages
- allanster: for Dynamic Zones
