RSI CANDLESTICKSThis indicator display open, high, low, and close data in the form of a candlestick.
Credits to @allanster for the idea from
ابحث في النصوص البرمجية عن "N+credit最新动态"

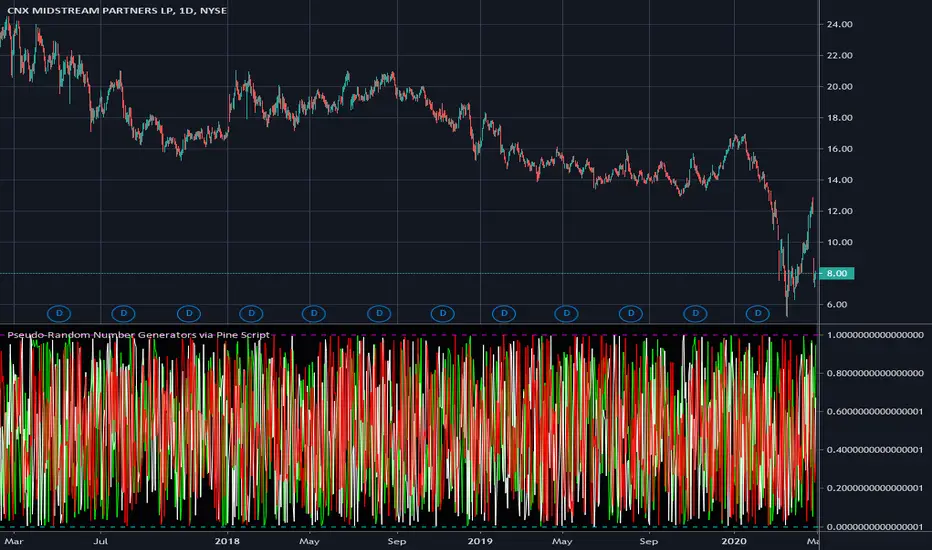
Pseudo-Random Number Generators via Pine ScriptThese are my "Pseudo-Random Number Generators via Pine Script", having uniform distribution between 0 and 1. In my quest for sequential pseudo-random numbers in Pine, tinkering with mathematical chaos, I have come up with these three simple yet handy generators. I believe these may be useful in the future by developers of the Tradingview community.
NOTICE: Use it as you please, this is free code to implement into your new Pine projects. You don't have to ask for my permission to reuse these functions in your published scripts, simply because I have better things to do than answer requests for the reuse of these simplistic PRNG functions. I don't require accreditation for members to reuse these functions either. I simply don't want any credit. I only require that you respectfully put it to "good and proper use" complimenting the elaborate script you have in mind. I would however like to see some great ideas utilizing these when I randomly and accidentally come across them in the public library. I didn't know where to put this script, so I just tossed it into the "Trend Analysis" category.
The comments section below is solely just for commenting and other remarks, ideas, compliments, etc... regarding only this indicator, not others. When available time provides itself, I will consider your inquiries, thoughts, and concepts presented below in the comments section, should you have any questions or comments regarding this indicator. When my indicators achieve more prevalent use by TV members, I may implement more ideas when they present themselves as worthy additions. As always, "Like" it if you simply just like it with a proper thumbs up, and also return to my scripts list occasionally for additional postings. Have a profitable future everyone!
Z Score Enhanced Time Segmented Volume (Multi MA)**THIS VERSION HAS BEEN STANDARDIZED WITH A Z SCORE CALCULATION AND ALLOWS THE USER TO SELECT WHICH MOVING AVERAGE THEY WOULD LIKE TO UTILIZE FOR THE SIGNAL LINE**
Chart shows the Non-Standardized Enhanced Time Segmented Volume (Multi MA) with default settings on top and the Standardized version with default settings on the bottom.
Time Segmented Volume was developed by Worden Brothers, Inc to be a leading indicator by comparing various time segments of both price and volume . Essentialy it is designed to measure the amount of money flowing in and out of an instrument.
Time Segmented Volume was originally ported to TradingView by user @liw0 and later corrected by user @vitelot. I never quite understood how to read Time Segmented Volume until I ran across a version by user @storma where they indicated when price would be long or short, but that code also utilized the incorrect calculation from user @liw0.
In an effort to make Time Segmented Volume more accessible and easier to read, I have re-coded it here. The calculations are based on the code from @vitelot and I have added direction indicators below the chart.
If the histogram (TSV) is greater than zero and greater than the moving average, price should be moving long and there will be a green box below the chart.
If TSV falls below the moving average while still being greater than zero, the trend may be exhausting and has been coded to read Price Action Long - FAILURE with a black x below the chart.
If the histogram (TSV) is less than zero and less than the moving average, price should be moving short and there will be a red box below the chart.
If TSV rises above the moving average while still being less than zero, the trend may be exhausting and has been coded to read Price Action Short - FAILURE with a black x below the chart.
At times, the moving average may be above zero while TSV is below zero or vice versa. In these situations the chart will indicate long or short based on whether or not TSV is greater or less than zero. It is possible a new trend may be forming as the moving average obviously lags, but also possible price is consolidating with little volume and causing TSV to oscillate close to zero.
**Z Score // Standardized Option **
Thist Standardized code implements all of the above but also allows the user to select a threshold level that should not need to be adjusted for each instrument (since the output is standardized).
If the TSV value meets the long and short signal requirements above and TSV is greater than the threshold values a green or red box will print ABOVE the oscillator. The histogram will also change color based on which threshold TSV has met.
This calculation allows us to compare current volatility to the mean (moving average) of the population (Z-Length). The closer the TSV Z-Score is to the mean, the closer it will be to the Zero Line and therefore price is likely consolidating and choppy. The farther TSV Z-Score is from the mean, the more likely price is trending.
The MA Mode determines the Moving Average used to calculate TSV itself. The Z-Score is ALWAYS calculated with a simple moving average (as that is the standard calculation for Z-Score).
The Threshold Levels are the levels at which TSV Z-Score will change from gray to yellow, orange, green ( bullish ), or red ( bearish ).
Statistically speaking, confidence levels in relation to Z-Score are noted below. The built in Threshold Levels are the positive and negative values for 90%, 95%, and 99%. This would indicate when volatility is greater than these values they are out of the ordinary from the standard range. You may wish to adjust these levels for TSV Z-Score to be more responsive to your trading needs
80% :: 1.28
85% :: 1.44
90% :: 1.64
95% :: 1.96
99% :: 2.58
The Z Length is the period for which the Z Score is calculated
More information regarding Time Segmented Volume can be found here: www.worden.com
Original code ported by @liw0
Corrected by @vitelot
Updated/Enhancements by @eylwithsteph with inspiration from @storma
Multiple MA Options Credits to @Fractured and @lejmer
Bits and Pieces from @AlexGrover, @Montyjus, and @Jiehonglim
As always, trade at your own risk.

Enhanced Time Segmented Volume (Multi MA)**THIS VERSION ALLOWS THE USER TO SELECT WHICH MOVING AVERAGE THEY WOULD LIKE TO UTILIZE FOR THE SIGNAL LINE**
Chart shows two different options of many. Top option is the default settings and bottom option is a different moving average with no other changes.
Time Segmented Volume was developed by Worden Brothers, Inc to be a leading indicator by comparing various time segments of both price and volume. Essentialy it is designed to measure the amount of money flowing in and out of an instrument.
Time Segmented Volume was originally ported to TradingView by user @liw0 and later corrected by user @vitelot. I never quite understood how to read Time Segmented Volume until I ran across a version by user @storma where they indicated when price would be long or short, but that code also utilized the incorrect calculation from user @liw0.
In an effort to make Time Segmented Volume more accessible and easier to read, I have re-coded it here. The calculations are based on the code from @vitelot and I have added direction indicators below the chart.
If the histogram (TSV) is greater than zero and greater than the moving average, price should be moving long and there will be a green box below the chart.
If TSV falls below the moving average while still being greater than zero, the trend may be exhausting and has been coded to read Price Action Long - FAILURE with a black x below the chart.
If the histogram (TSV) is less than zero and less than the moving average, price should be moving short and there will be a red box below the chart.
If TSV rises above the moving average while still being less than zero, the trend may be exhausting and has been coded to read Price Action Short - FAILURE with a black x below the chart.
At times, the moving average may be above zero while TSV is below zero or vice versa. In these situations the chart will indicate long or short based on whether or not TSV is greater or less than zero. It is possible a new trend may be forming as the moving average obviously lags, but also possible price is consolidating with little volume and causing TSV to oscillate close to zero.
More information regarding Time Segmented Volume can be found here: www.worden.com
Original code ported by @liw0
Corrected by @vitelot
Updated/Enhancements by @eylwithsteph with inspiration from @storma
Multiple MA Options Credits to @Fractured and @lejmer
Bits and Pieces from @AlexGrover, @Montyjus, and @Jiehonglim
As always, trade at your own risk.

Wolfs ADX + DII have created an alternative visualisation of the ADX + DI indicator created by MasaNakamura, credits to them for providing the source code! :-)
The histogram represents the distance between the DI+ and the DI-. The crossing of the histogram is equal to the crossing of the DI lines.
The ADX line is coloured based on the threshold.
This creates a clean representation of the ADX + DI.

Underworld Hunter + Base ZoneUnderworld Hunter + Base Zone is designed to keep traders out of ranging markets by establishing a "dead zone" between the bands where price may be choppy or trends may be short lived. The original Underworld Hunter from @greenmask9 adapted Bollinger Bands by changing the basis from SMA to the EMA of the EMA of the EMA. This version now allows the user to select which moving average they would like to utilize for the calculation.
If price is outside of the upper bands, price may be bullish. If price is outside the lower bands, price may be bearish.
If price is within the green or red areas of the bands, a trend may be forming.
The system also plots when RSI has become over extended above the thresholds selected (70/20 is the default).
MA Period is the length/period the moving average is calculated with
MA Mode is the type of moving average that will be utilized in the basis calculation
The "Standard MA Calculation" Option changes the basis to calculate the moving average selected in MA Mode only once, instead of 3 times
Deviation 1 and Deviation 2 determine how far the dead zone bands will be from the basis
RSI Period is the length/period the RSI function is calculated with
RSI Extended - High Cutoff is the level RSI must reach to be marked as over extended. Most traders refer to this zone as "Overbought"
RSI Extended - Low Cutoff is the level RSI must reach to be marked as over extended. Most traders refer to this zone as "Oversold"
As many NNFx traders know, overbought and oversold essentially do not exist, though the zones can still be utilized
The remaining options are utilized for specific moving average calculations and are set to what is typically considered as "standard" for their values.
There are many options available for this code. The code has not been optimized but merely compiled. Settings should be adjusted for the instrument(s) you are trading.
Adapted from user @greenmask9
Multiple MA Options Credits to @Fractured and @lejmer
Bits and Pieces from @AlexGrover, @Montyjus, and @Jiehonglim
As always, trade at your own risk.

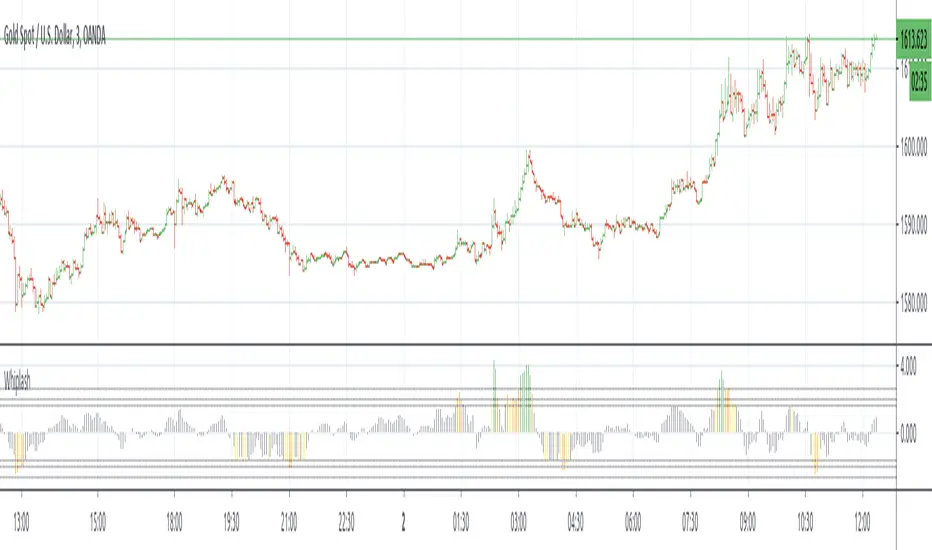
WhipLashThis is a study to determine if small candle bodies (little difference between open and close), regardless of overall candle length (high/low), can be used to filter choppy markets.
The indicator will calculate the selected average "MA Mode" of (close-open). To standardize this result and ensure any filters/thresholds do not need to be recalculated for each instrument the result will be used to calculate the Z Score.
The idea is that when candle bodies are small there is very little actual price movement, and therefore price is choppy. When considering the Z Score of that result, any outliers ie larger candle bodies, could show a potential trend forming. This indicator is similar to QStick but allows more customization by the user.
MA Mode determines which MA is used to smooth the results of (close-open)
Price Smoothing is the number of running periods the MA Mode is calculated for.
The three Thresholds are preset to the 90%, 95%, and 99% levels for Z Score. If these thresholds are altered you may wish to also alter the horizontal lines programmed for each level on the positive and negative sides.
The Z Length is the period for which the Z Score is calculated
Multiple MA Options Credits to @Fractured
Bits and Pieces from @AlexGrover, @Montyjus, and @Jiehonglim
As always, trade at your own risk.
[e2] EDS Key & AvwapThis indicator shows a Key Level Support & Resistance level and VWAP that resets on your choice of the stock's Earnings , Dividends or Splits release date.
A maximum of 8 bands calculated using a factor of the anchored VWAP's standard deviation can be displayed.
Note
The script is designed for stock-trading only.
Credits
Inspired by timwest , LazyBear 's Earnings S/R Levels and MichelT 's Earnings, Splits, Dividends scripts.

FRAMA - Supertrend strategyFRAMA Strategy
I found this strategy on internet, in a well-known forex forum.
I have translated the two indicators mentioned in that strategy (originally in mq4) in pine script.
Thanks to Fractured and Shizaru for the FRAMA snippets, to mejialucas for Supertrend snippet, to JayRogers for trade management snippet and to Trost for backtesting snippet.
I also added some code to have FRAME with a deiiferent timeframe
Indicators set-up:
FRAMA period 24 (it was originally 25 but it's better to use an even number)
FRAMA timefarme lower then chart timeframe (e.g. daily chart and weekly FRAMA)
Supertrend indicator as it is.
Of course, it is better to adapt above setting to traded instrument.
Long/Buy rules:
1 - Enter at crossover between FRAMA and its signal
2 - Option to filter entries based on supertrend signal
3 - Exit when Supertrend change direction;
4 - Exit long when short signal occurs;
Short/Sell rules:
1 - Enter at crossunder between FRAMA and its signal
2 - Option to filter entries based on supertrend signal
3 - Exit when Supertrend change direction;
4 - Exit short when long signal occurs;
VERY IMPORTANT NOTE: this is a trend following strategy, so the target is to stay in the trade as much as possible (drawdown my be high). If your trading style is more focused on scalping and/or pullbaks, this strategy is not for you.
Credits to who developed this startegy (google it).
Thanks to all pinescripters mentined in the code for their snippets.
I have also a study with alerts.
Please use comment section for any feedback or contact me if you need support.

VQZL Z-ScoreVolatility Qaulity Zero Line attempts to keep a trader out of ranging markets, but the original calculation on TradingView had to be adjusted for each instrument. To avoid this issue, I have applied a z-score calculation to the VQZL so the result is standardized for all instruments. A Z-Score is simply a value's relationship to the mean (average) of a group of values, measured in terms of standard deviations from the mean.
This calculation allows us to compare current volatility to the mean (moving average) of the population (Z-Length). The closer the VQZL Z-Score is to the mean, the closer it will be to the Zero Line and therefore price is likely consolidating and choppy. The farther VQZL Z-Score is from the mean, the more likely price is trending.
The MA Mode determines the Moving Average used to calculate VQZL itself. The Z-Score is ALWAYS calculated with a simple moving average (as that is the standard calculation for Z-Score).
The Threshold Levels are the levels at which VQZL Z-Score will change from gray to yellow, orange, green (bullish), or red (bearish). These levels can be adjusted but you should adjust the Threshold Lines as well (in the style section), so they line up with your adjusted values.
Statistically speaking, confidence levels in relation to Z-Score are noted below. The built in Threshold Levels are the positive and negative values for 90%, 95%, and 99%. This would indicate when volatility is greater than these values they are out of the ordinary from the standard range. You may wish to adjust these levels for VQZL Z-Score to be more responsive to your trading need
80% :: 1.28
85% :: 1.44
90% :: 1.64
95% :: 1.96
99% :: 2.58
As always, trade at your own risk.
VQZL Created by Investo And Adapted From @sarangab
Multiple MA Options Credits to @Fractured
Bits and Pieces from @AlexGrover and @Montyjus

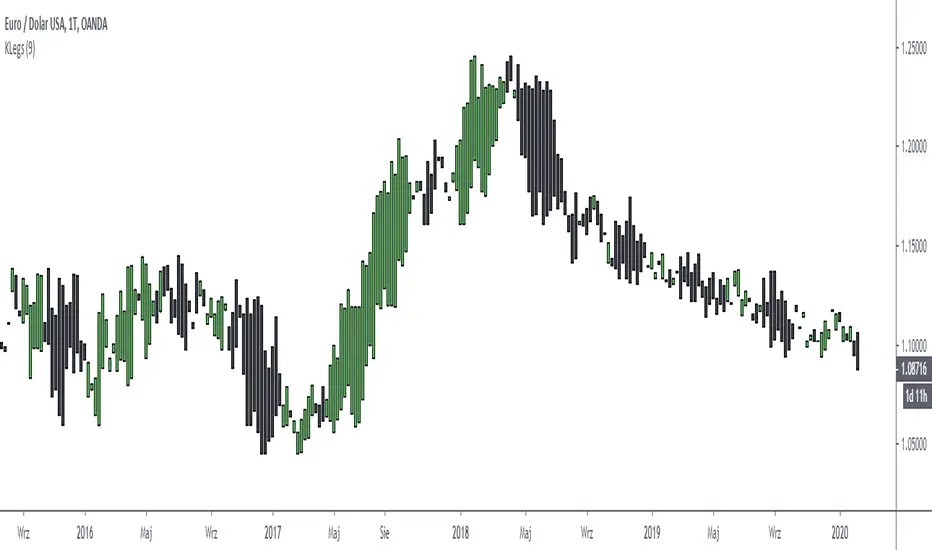
Kyushu LegsKyushu Legs
Ver 1.0 13.02.2020
Rewritten by Grzechu789
Credits to unknown autor!
BIG THANKS to majql for providing the code and an anonymous person who wrote it. I'm just republishing the code to have it in my library.
Enjoy!

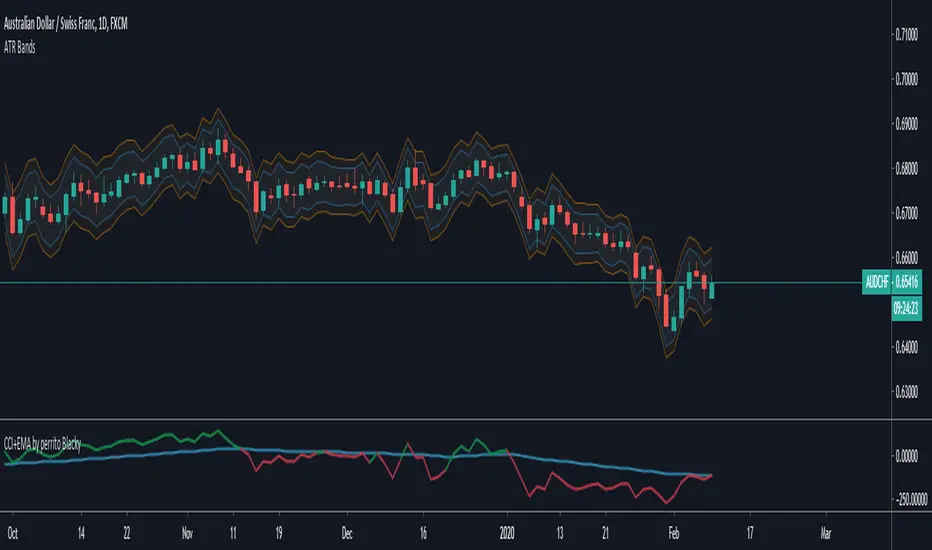
ATR BandsThe NNFX way
This indicator makes it easy to see the ATR values of the chart.
The red lines are at 1.5 ATR
The blue lines are at 1 ATR
Credits to www.tradingview.com for the code he published. I've extracted only the ATR to create this indicator. Many thanks ❤
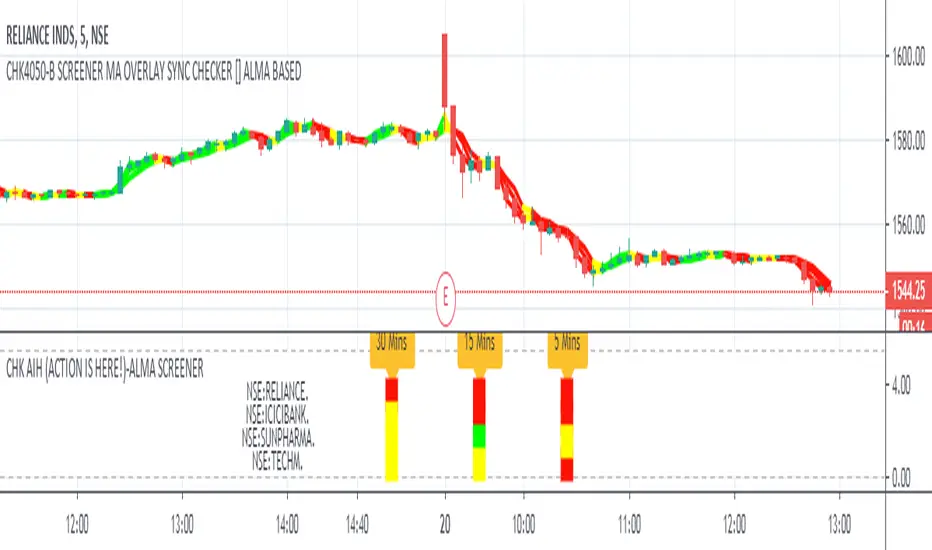
CHK AIH (ACTION IS HERE!)-ALMA SCREENERWe do not like to stare at the screen whole day, instead we like to jump where the
action is.... The Screener was written with this in mind
CHK AIH (ACTION IS HERE!)-ALMA BASED SCREENER
FEATURES
User can enter 3 Resolutions of his/her choice
User can select 3 Mov Avg Length of his her choice, which would be identical for all the three timeframes
User can enter stock basis his/her region's stock exchange
User can shift the screener left or right if not visible in a Multiscreen mode
Uses ALMA (Arnaud Legoux Mov Avg) as it smooth and reactive
Code is also provided below of MTF ALMA Moving Average OVERLAY on which this screener is based
LOGIC
For a particular timeframe If all the Moving Average are calibrated in one direction, it will show the requisite color.
For Example in an ideal scenario for a bull trend ALMA(5)> ALMA(13) > ALMA(21), once such a situation is identified, the screener will show green.
Yellow means lack of Calibration.
When 3 timeframes are calibrated, it becomes a high Probability Trade
BUGS
It is not allowing to enter the D/W/M timeframes, timeframe in numbers ...5/15/60 is working fine. If somebody can fix it
it would be great
LIMITATIONS
Because of TV's limitations only 4 scrips can be entered, however one add the indicator again with new scrips
//////////// CREDITS ////////////////////////////////////////////////////////////////////////////////////
//// hxxps://www.tradingview.com/script/rwdgyEZe/
/// Thank You Inno14 for graciously sharing your work. Your work has helped immensely !!!
////////////////////////////////////////////////////////////////////////////////////////////////////////
ICICIBANK
TECHMAHINDRA
YESBANK
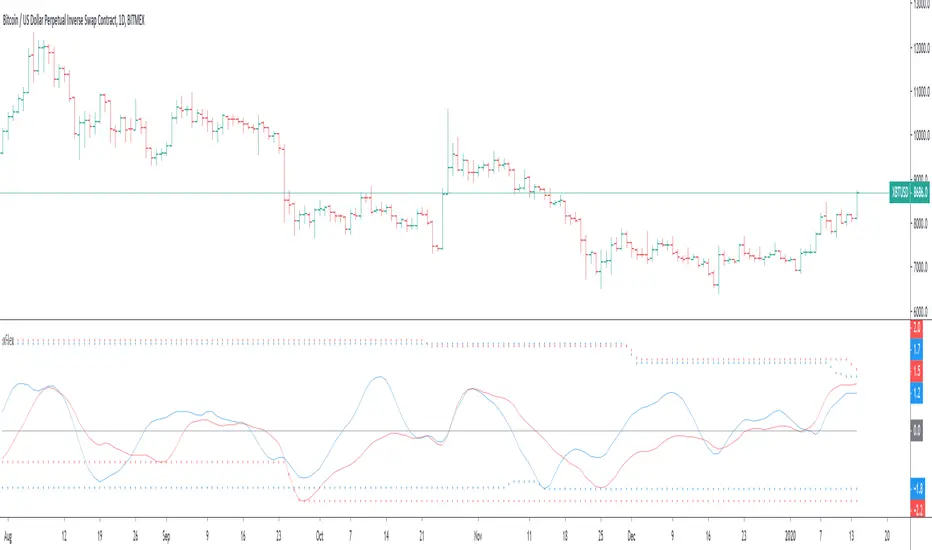
[e2] Reflex & TrendflexNew Indicator from John F. Ehlers issued in the February 2020 Technical Analysis of Stocks and Commodities article "Reflex: A New Zero-Lag Indicator"
This indicator includes both studies described in the article and intend to significantly reduce the lag of the signal compared to other oscillators.
Reflex for the cycle component and is more sensitive to major reversals, Trendflex for the trend component.
Pivot Max range as the borders for top and bottom reading of the indicators (the script will plot separate borders for both components) and divergences were added.
Divergence function is the interpretation of built-in divergence script, optimized the code and added option to show real-time divs (without offset), all credits to ...)
daily*tip: I must say that very quickly I began to realize how fragmented and imperfectly modern economic knowledge is and how little can be taken from fundamental science in terms of practical recipes. (c) Andrey Movchan.
stay safe ;)
HighImpactBarsHighlights bars with open to close exceeding the ATR EMA.
Idea Credits (the boss): /u/ElanBension/

Volatility Traders Minds Strategy (VTM Strategy)Volatility Traders Minds Strategy (VTM Strategy)
I found this startegy on internet, with a video explaingin how it works.
Conditions for entry:
1 - Candles must to be above or bellow the 48 MA (Yellow line)
2 - Candles must to break the middle of bollinger bands
3 - Macd must to be above or bellow zero level;
4 - ADX must to be above 25 level
Credits to who developed this startegy (google it).
Thanks to all pinescripters mentined in the code for their snippets.
It could be improved with stop loss based on ATR etc.
I have also a study with alerts.
Please use comment section for any feedback or contact me if you need support.

CHK TimeSeriesLagReductionFilter[MULTI MA]This script is an improvement on the idea published on " Time Series Lag Reduction Filter "
This script allows users to select the Moving Average of his choice. Helps precise entries and precise exits.
Since every Moving Average is different, play with the settings to get the best fit. If the "Lag Reduce" overshoots bring down the number.
CREDITS ::
TO theheirophant for this idea
TO NEOBUTANE for his MULTI TYPE MOV AVG GUPPY
Thank You NEOBUTANE and Theheirophant.
This is my first publication :)
Sharing few examples what this script can do

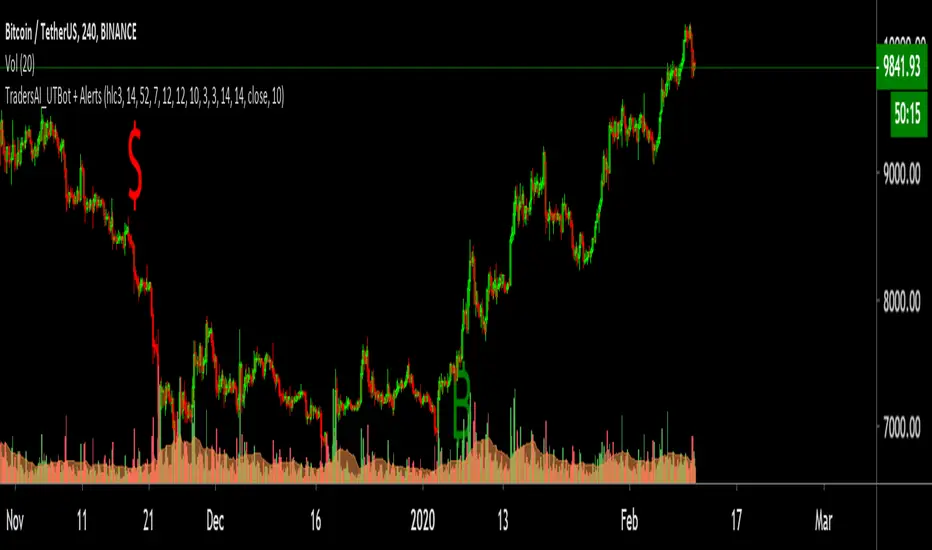
SSL HybridThis script is designed for the NNFX Method, so it is recommended for Daily charts only.
Tried to implement a few VP NNFX Rules
This script has a SSL / Baseline (you can choose between the SSL or MA), a secondary SSL for continiuation trades and a third SSL for exit trades.
Alerts added for Baseline entries, SSL2 continuations, Exits.
Baseline has a Keltner Channel setting for "in zone" Gray Candles
Added "Candle Size > 1 ATR" Diamonds from my old script with the criteria of being within Baseline ATR range.
Credits go to:
Strategy causecelebre www.tradingview.com
SSL Channel ErwinBeckers www.tradingview.com
Moving Averages jiehonglim www.tradingview.com
Moving Averages everget www.tradingview.com
"Many Moving Averages" script Fractured www.tradingview.com

CryptOli 3 MAs long/short Backtest// this is an educational Script - basicly its very simple - you can see how minimal changes impact results, thats why i posted it
// Credits to Quantnomad to publish tons of free educational script
// this Script is based on Quantnomads Ultimate MA Indicator
// HA - Option for calcultion based on HA-Candles (very famous recently)
// Source Input - Option (Candletype for calculation, close, ohlc4 ect.) --- there are huge differences --- try it by your own

Red and Green Ignored Bar by Oliver VelezOn this occasion I present a script that detects Ignored Red Candles and Ignored Green Candles, basically it is a Price Action event that indicates a possible continuation of the current trend and gives the opportunity to climb it with a Very tight risk, before delving into detail I would like to leave this note:
Note: the detection of this event does not guarantee that the signal will be good, the trader must have the ability to determine its quality based on aspects such as trend, maturity, support / resistance levels, expansion / contraction of the market, risk / benefit, etc, if you do not have knowledge about this you should not use this indicator since using it without a robust trading plan and experience could cause you to partially or totally lose your money, if this is your case you should train before If you try to extract money from the market, this script was created to be another tool in your trading plan in order to configure the rules at your discretion, execute them consistently and have AUTOMATIC ALERTS when the event occurs, which is where I find more value because you can have many instruments waiting for the event to be generated, in the time frame you want and without having to observe the mer When the alert is generated, the Trader should evaluate the quality of the alert and define whether or not to execute it (higher timeframes, they can give you more time to execute the operation correctly).
Let's continue….
This event was created by Oliver Velez recognized trader / mentor of price action, the event has a very interesting particularity since it allows to take a position with a very limited risk in trend movements, this achieves favorable operations of good ratio and small losses when taking An adjusted risk, if the trade works, a good ratio is quickly achieved and we agree with a key point in the “Keep small losses and big profits” trading, this makes it easier to have a positive mathematical hope when your level of Success is not very high, so leave you in the field of profitability.
THE EVENT:
The event has a bullish configuration (Ignored Red Candle) and a bearish configuration (Ignored Green Candle), below I detail the “Hard” rules (later I explain why “Hard”):
1- Last 3 bars have to be GREEN-RED-GREEN (possible bullish configuration) or RED-GREEN-RED (possible bearish configuration), the first bar is called Control Bar, the second is called Ignored Bar and the third Signal Bar as shown in the following image:
2- Be in a trend determined by simple moving averages (Slow of 20 periods and Fast of 8 periods), as a general rule you can take the direction of MA20 but the Trader has to determine if there is a trend movement or not.
3- Control bar of good range, little tail and with a body greater than 55%.
4- Ignored bar preferably narrow range, little tail and that is located in the upper 1/3 of the control bar.
5- Signal bar cannot override the minimum of the ignored bar.
6- Activation / Confirmation of event by means of signal bar in overcoming the body of the ignored bar.
Some examples of ignored bars (with “Hard” and “Flexible” rules):
Features and configuration of the indicator:
To access the indicator settings, press the wheel next to the indicator name VVI_VRI "Configuration options".
- Operation mode (Filtering Type):
• Filtering Complete: all filters activated according to the configuration below.
• Without Filtering: all filters deactivated, all VRI / VVI are displayed without any selection criteria.
• Trend Filter only: shows only VRI / VVI that are in accordance with what is set in “Trend Settings”
- Configuration Moving Averages:
• See Slow Media: slow moving average display with direction detection and color change.
• See Fast Media: display of fast moving average with direction detection and color change.
• Type: possibility to choose the type of media: DEMA, EMA, HullMA, SMA, SSMA, SSMA, TEMA, TMA, VWMA, WMA, ZEMA)
• Period: number of previous bars.
• Source: possibility to choose the type of source, open, close, high, low, hl2 hlc3, ohlc4.
• Reaction: this configuration affects the color change before a change of direction, 1 being an immediate reaction and higher values, a more delayed reaction obtaining les false "changes of direction", a value of 3 filters the direction quite well.
- Trend Configuration
• Uptrend Condition P / VRI: possibility to select any of these conditions:
o Bullish MA direction
o Quick bullish MA direction
o Slow and fast bullish MA direction
o Price higher than slow MA
o Price higher than fast MA
o Price higher than slow and fast MA
o Price higher than slow MA and bullish direction
o Price higher than fast MA and bullish direction
o Price higher than slow, fast MA and bullish direction
o No condition
• Condition P / VVI bear trend: possibility of selecting any of these conditions:
o Slow bearish MA direction
o Fast bearish MA direction
o Slow and fast bearish MA direction
o Price less than slow MA
o Price less than fast MA
o Price less than slow and fast MA
o Price lower than slow MA and bearish direction
o Price less than fast MA and bearish direction
o Price less than slow, fast MA and bearish direction
o No condition
- Control bar configuration
• Minimum body percentage%: possibility to select what body percentage the bar must have.
• Paint control bar: when selected, paint the control bar.
• See control bar label: when selected, a label with the legend BC is plotted.
- Configuration bar ignored
• Above X% of the control bar: possibility to select above what percentage of the control bar the ignored bar must be located.
• Paint ignored bar: when selected, paint the ignored bar.
- Signal bar configuration
• You cannot override the minimum of the ignored bar: when selected, the condition is added that the signal bar cannot override the minimum of the ignored bar.
• Paint signal bar: when selected, paint the signal bar.
• See arrow: when selected it shows the direction arrow of the possible movement.
• See bear and arrow: when selected it shows bear and arrow label
• See bull and arrow: when selected it shows bull and arrow label
The following image shows the ignored bar and painted signal:
- Take profit / loss
The profit / loss taking varies depending on the trader and its risk / monetary plan, the proposal is a recommendation based on the nature of the event that is to have a small risk unit (stop below the minimum of the ignored bar), look for objectives in ratios greater than 2: 1 and eliminate the risk in 1: 1 by taking the stop to BE, all parameters are configurable and are the following:
• See recommended stop loss and take profit: trace the levels of Stop, BE, TP1 and TP2, as well as their prices to know them quickly based on the assumed risk
• To: select which event you want to draw the SL and TP (VRI, VVI)
• Extend stop loss line x bars: allows extending the stop line by x number of bars
• Extend take profit line x bars: allows extending the stop line by x number of bars
• Ratio to move to break even: allows you to select the minimum ratio to move stop to break even (default 1: 1)
• Take profit 1 ratio: allows you to select the ratio for take profit 1 (default 2: 1)
• Take profit 2 ratio: allows you to select the ratio for take profit 2 (default 4: 1)
- Alerts
• It is possible to configure the following alerts:
-VRI DETECTED
-VVI DETECTED
-VRI / VVI DETECTED
Final Notes:
- The term hard rules refers to the fact that an event is sought with the rules detailed above to obtain a high quality event but this brings 2 situations to consider, less
number of events and events that are generated in a strong impulse may be leaked, a very large control bar followed by an ignored narrow body away from moving averages, despite having a good chance of continuing, taking a stop very tight in a strong impulse you can touch it by the simple fact of the own volatility at that time.
- The setting of the parameters “Minimum body percentage% (control bar)”, “Above x% of the control bar (bar ignored)” and “Cannot override the minimum of the ignored bar” can bring large Benefits in terms of number of events and that can also be of high quality, feel free to find the best configuration for your instrument to operate.
- It is recommended to look for trending events, near moving averages and at an early stage of it.
- The display of several nearby VRIs or VVIs in an advanced trend may indicate a depletion of it.
- The alerts can be worked in 2 ways: at the closing of the candle (confirms event but the risk unit may be larger or smaller) or immediately the body of the ignored bar is exceeded, in case you are operating from the mobile and miss many events because of the short time I recommend that you operate in a superior time frame to have more time.
- The indicator is configured with “flexible” rules to have more events, but without any important criteria, each trader has to look for the best configuration that suits his instrument.
- It is recommended to partially close the operation based on the ratio and always keep a part of the position to apply manual trailing stop and try to maximize profits.
The code is open feel free to use and modify it, a mention in credits is appreciated.
If you liked this SCRIPT THUMB UP!
Greetings to all, I wish you much green!

CustomCrossCorrelations+AlertsJust a bunch of neatly displayed commonly used/_reused_ indicators that I mainly use alongside cross-correlation. Simply put, this script might help other traders to enter trades indicative of moves to the upside/downside and want to see more confirmation such as crosses and/or confluence areas.
Feel free to customize to your liking and adjust the options as needed. Credits are given to the other authors whose scripts were referenced and used as boilerplate. Feedback appreciated as well!
Disclaimer: Potential signals are subjective, to each his own. Although some settings may need to be tweaked to the trader's preferences, some prove worthy.
