NQ 300+ Point Day Checklist (Bias + Alerts + Markers)This indicator helps identify high-range (≥300-point) days on Nasdaq-100 futures (NQ / MNQ) using a clear, rule-based checklist.
It evaluates volatility, compression, price displacement, prior-day structure, and overnight activity to generate a daily expansion score (0–6). Higher scores signal an increased likelihood of a strong trending or expansion day.
The script also provides:
Expansion probability levels (Normal / Watch / High-Prob)
Bullish, bearish, or neutral bias
On-chart markers and background highlights
Optional alerts for early awareness
Best used on the Daily timeframe to help traders focus on high-opportunity days and avoid overtrading during consolidation.
This is a context and probability tool — not a trade signal.
ابحث في النصوص البرمجية عن "NQ"

NQ Futures VWAP on QQQOverlay NQ1 vwap for QQQ
Track NQ future's vwap on your QQQ chart to scale with optional bands

NQ Scalping WMAThis indicator plots two Weighted Moving Averages (WMAs) derived from the high and close to visualize short-term momentum extremes on NQ (Nasdaq futures). I built it for myself for scalping reversals on the 1-minute timeframe.
The area between the upper WMA (“Top-Source”) and lower WMA (“Bot-Source”) is filled with contextual color: green when price is above the top WMA, red when price is below the bottom WMA, and neutral gray otherwise. This makes it easy to spot overextensions, potential snap-back zones, and quick mean-reversion opportunities. Inputs include WMA length, line color, and separate sources for top/bottom WMAs, allowing fast tuning for changing intraday volatility.
The original code I used to make this is from PlayBit EMA by FFriZz

NQ/MNQ Position Sizing
Despite having my own position sizing calculator in an excel sheet, the manual process of having to identify my next trade, switch tabs/screens, input my values into the sheet, go back into TV, input the trade parameters with appropriate contract sizing, has always really gotten to me. I also found that I would often miss ideal entries due to the delay this caused.
I searched TV for position sizing calculators but almost all the ones I found seemed to be similar: based on some form of manual input for the entry and stop parameters, many of which had way more settings and parameters than I needed, also over complicated things.
I just needed something that would allow me to dynamically set my entry and stop levels directly on the chart, and spit out the appropriate contracts I should be using, either on NQ or MNQ, to maintain my desired level of risk, so I could quickly execute the necessary trade.
So, I coded my own and it's been a huge help to me already, so I thought I may as well publish the script as can't imagine there aren't others out there that also hate the manual data entry process of calculating risk.
Upon first load, the script will ask you to set your Entry and Stop levels, before drawing respective lines for these on the chart, and calculating contract sizing based on your risk settings, which you can update directly. The reset values may be buggy, will be easier to just remove the script and re-apply it to your chart if you ever lose track of the levels you've set.
Hope it's useful.
PropKorea US10Y Monitor for NQPropKorea US10Y Monitor for NQ
Overview This indicator is specifically designed for Nasdaq (NQ) day traders and scalpers. It visualizes the real-time fluctuations of the US 10-Year Treasury Yield (US10Y), which historically has a strong Inverse Correlation with tech stocks.
By monitoring the US10Y yield in real-time, traders can gauge the macro pressure on the Nasdaq. This script features a Smart Smoothing Algorithm to filter out tick noise on lower timeframes (e.g., 1-minute chart) and uses a "Neon" visual effect to intuitively display market sentiment (Risk On/Off).
Key Features
Neon Trend Signals (Risk Gauge)
🔴 Red Zone: Yield is UP vs. Previous Close (Bearish pressure on NQ → Short Bias).
🟢 Green Zone: Yield is DOWN vs. Previous Close (Bullish pressure on NQ → Long Bias).
⚪ Gray (Neutral): Trend is reversing or consolidating (Wait or Exit signal).
Smart Smoothing (Noise Filter)
Apply a customizable Moving Average filter to ignore minor tick whipsaws on 1-minute charts.
Adjust the Smoothing Strength in settings to fit your trading style.
1:1 Candle Matching (Dot Style)
Supports "Line + Dots" style to align yield data points perfectly with NQ candles for precise timing.
Session Filter
The Neon effect activates only during the main NY Session (08:30 – 17:00 EST) to focus on high-liquidity hours.
How to Use
Add this indicator to a separate pane below your NQ chart.
Short Setup: If the background/line is Red, look for Short opportunities when NQ bounces.
Long Setup: If the background/line is Green, look for Long opportunities when NQ dips.
Caution: If the color turns Gray, the yield trend is losing momentum. Consider tightening stops or waiting.
Disclaimer This tool is for informational purposes only and does not guarantee profits. Please be aware that markets can decouple from yields during major news events (e.g., Earnings surprises).
개요 (Overview) 이 지표는 나스닥(NQ) 데이 트레이더와 스캘퍼를 위해 제작되었습니다. 기술주와 강력한 **역상관 관계(Inverse Correlation)**를 가지는 **미국 10년물 국채 금리(US10Y)**의 실시간 변동을 시각화하여 트레이딩에 도움을 줍니다.
1분봉 이하의 빠른 스캘핑 환경에서도 틱 노이즈(Noise)에 속지 않도록 스마트 스무딩(Smart Smoothing) 알고리즘이 적용되어 있으며, 네온(Neon) 효과를 통해 현재 시장의 분위기(Risk On/Off)를 직관적으로 파악할 수 있습니다.
핵심 기능 (Key Features)
네온 트렌드 신호 (Neon Trend)
🔴 레드존 (Red Zone): 전일 대비 금리 상승 중 (나스닥 하방 압력 → 매도 우위)
🟢 그린존 (Green Zone): 전일 대비 금리 하락 중 (나스닥 상방 압력 → 매수 우위)
⚪ 회색 (Gray): 추세 반전 또는 횡보 구간 (관망 또는 청산 신호)
스마트 스무딩 (노이즈 제거)
이동평균 필터를 적용하여 1분봉 차트에서의 자잘한 틱 튀김 현상을 걸러냅니다.
설정에서 노이즈 제거 강도를 조절하여 본인의 스타일에 맞게 튜닝할 수 있습니다.
1:1 캔들 매칭 (Dot Style)
"Line + Dots" 스타일을 지원하여 나스닥 캔들과 금리 데이터를 1:1로 매칭해 정확한 타점을 볼 수 있습니다.
세션 필터 (Session Filter)
유동성이 풍부한 뉴욕 본장(08:30~17:00 EST) 시간에만 네온 효과가 켜지고, 그 외 시간에는 눈의 피로를 줄이기 위해 차분한 회색으로 전환됩니다.
사용 가이드 (How to Use)
NQ 차트 하단 패널에 이 지표를 추가하십시오.
매도 진입: 배경과 선이 붉은색일 때, 나스닥이 반등하면 매도 포지션 진입을 고려합니다.
매수 진입: 배경과 선이 초록색일 때, 나스닥이 눌림목을 주면 매수 포지션 진입을 고려합니다.
주의: 선명하던 색상이 회색으로 변하면 금리 추세가 멈추거나 반전되고 있다는 신호이므로 주의가 필요합니다.
주의 사항 (Disclaimer) 본 지표는 보조 도구일 뿐이며 절대적인 수익을 보장하지 않습니다. 강력한 개별 호재(실적 발표 등)가 있는 날에는 금리와 디커플링(Decoupling) 될 수 있음을 유의하십시오.
Developed by PropKorea

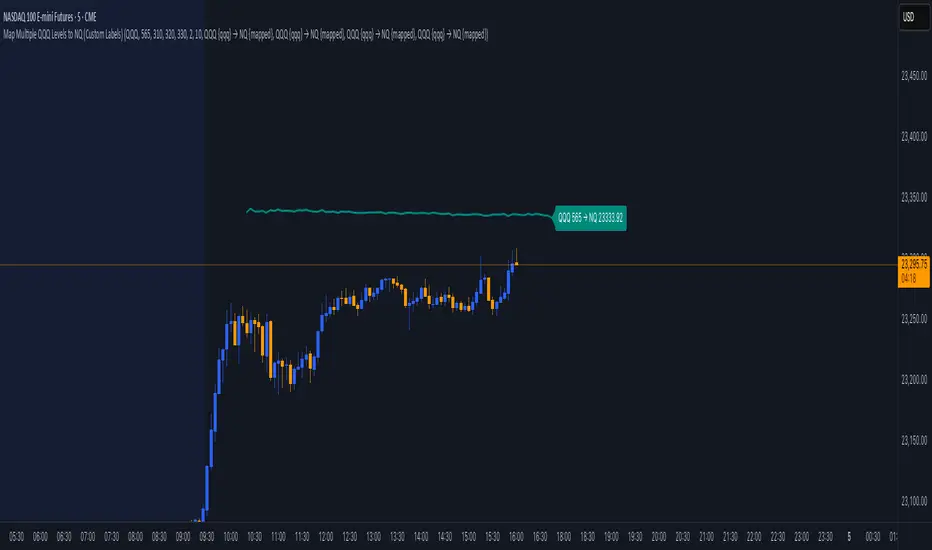
Map Multiple QQQ Levels to NQ (Custom Labels)maps user-defined price levels from the QQQ (Invesco QQQ Trust, tracking the NASDAQ-100) to equivalent levels on the NQ (NASDAQ-100 futures) chart, displaying them as colored lines with optional labels. It’s designed to overlay on the NQ chart, helping traders visualize QQQ price levels in terms of NQ values based on the ratio between their prices.
Key Features:
Inputs for QQQ Levels: Users can specify up to four QQQ price levels (default: 300, 310, 320, 330) with a step of 0.1 for precision.
Customizable Appearance: Each level has its own color (default: teal, orange, purple, green) and a shared line width (default: 2).
Time Filters:
Option to display levels only for the current day (show_today_only).
Option to show levels only after 9:30 AM Eastern Time (show_after_open), aligning with market open.
Custom Labels: Each level can have a toggleable label with a customizable template (e.g., "QQQ {qqq} → NQ {mapped}"), showing the QQQ level and its mapped NQ value, formatted to two decimal places.
Dynamic Mapping: Calculates the ratio between NQ and QQQ closing prices to map QQQ levels to NQ equivalents in real-time.
Conditional Display: Levels are plotted only when user-defined conditions (day and time filters) are met, otherwise hidden (na).
Label Placement: Labels are displayed on the last confirmed historical bar, unaffected by time filters, ensuring visibility without cluttering real-time bars.
BOCS Channel Scalper Strategy - Automated Mean Reversion System# BOCS Channel Scalper Strategy - Automated Mean Reversion System
## WHAT THIS STRATEGY DOES:
This is an automated mean reversion trading strategy that identifies consolidation channels through volatility analysis and executes scalp trades when price enters entry zones near channel boundaries. Unlike breakout strategies, this system assumes price will revert to the channel mean, taking profits as price bounces back from extremes. Position sizing is fully customizable with three methods: fixed contracts, percentage of equity, or fixed dollar amount. Stop losses are placed just outside channel boundaries with take profits calculated either as fixed points or as a percentage of channel range.
## KEY DIFFERENCE FROM ORIGINAL BOCS:
**This strategy is designed for traders seeking higher trade frequency.** The original BOCS indicator trades breakouts OUTSIDE channels, waiting for price to escape consolidation before entering. This scalper version trades mean reversion INSIDE channels, entering when price reaches channel extremes and betting on a bounce back to center. The result is significantly more trading opportunities:
- **Original BOCS**: 1-3 signals per channel (only on breakout)
- **Scalper Version**: 5-15+ signals per channel (every touch of entry zones)
- **Trade Style**: Mean reversion vs trend following
- **Hold Time**: Seconds to minutes vs minutes to hours
- **Best Markets**: Ranging/choppy conditions vs trending breakouts
This makes the scalper ideal for active day traders who want continuous opportunities within consolidation zones rather than waiting for breakout confirmation. However, increased trade frequency also means higher commission costs and requires tighter risk management.
## TECHNICAL METHODOLOGY:
### Price Normalization Process:
The strategy normalizes price data to create consistent volatility measurements across different instruments and price levels. It calculates the highest high and lowest low over a user-defined lookback period (default 100 bars). Current close price is normalized using: (close - lowest_low) / (highest_high - lowest_low), producing values between 0 and 1 for standardized volatility analysis.
### Volatility Detection:
A 14-period standard deviation is applied to the normalized price series to measure price deviation from the mean. Higher standard deviation values indicate volatility expansion; lower values indicate consolidation. The strategy uses ta.highestbars() and ta.lowestbars() to identify when volatility peaks and troughs occur over the detection period (default 14 bars).
### Channel Formation Logic:
When volatility crosses from a high level to a low level (ta.crossover(upper, lower)), a consolidation phase begins. The strategy tracks the highest and lowest prices during this period, which become the channel boundaries. Minimum duration of 10+ bars is required to filter out brief volatility spikes. Channels are rendered as box objects with defined upper and lower boundaries, with colored zones indicating entry areas.
### Entry Signal Generation:
The strategy uses immediate touch-based entry logic. Entry zones are defined as a percentage from channel edges (default 20%):
- **Long Entry Zone**: Bottom 20% of channel (bottomBound + channelRange × 0.2)
- **Short Entry Zone**: Top 20% of channel (topBound - channelRange × 0.2)
Long signals trigger when candle low touches or enters the long entry zone. Short signals trigger when candle high touches or enters the short entry zone. This captures mean reversion opportunities as price reaches channel extremes.
### Cooldown Filter:
An optional cooldown period (measured in bars) prevents signal spam by enforcing minimum spacing between consecutive signals. If cooldown is set to 3 bars, no new long signal will fire until 3 bars after the previous long signal. Long and short cooldowns are tracked independently, allowing both directions to signal within the same period.
### ATR Volatility Filter:
The strategy includes a multi-timeframe ATR filter to avoid trading during low-volatility conditions. Using request.security(), it fetches ATR values from a specified timeframe (e.g., 1-minute ATR while trading on 5-minute charts). The filter compares current ATR to a user-defined minimum threshold:
- If ATR ≥ threshold: Trading enabled
- If ATR < threshold: No signals fire
This prevents entries during dead zones where mean reversion is unreliable due to insufficient price movement.
### Take Profit Calculation:
Two TP methods are available:
**Fixed Points Mode**:
- Long TP = Entry + (TP_Ticks × syminfo.mintick)
- Short TP = Entry - (TP_Ticks × syminfo.mintick)
**Channel Percentage Mode**:
- Long TP = Entry + (ChannelRange × TP_Percent)
- Short TP = Entry - (ChannelRange × TP_Percent)
Default 50% targets the channel midline, a natural mean reversion target. Larger percentages aim for opposite channel edge.
### Stop Loss Placement:
Stop losses are placed just outside the channel boundary by a user-defined tick offset:
- Long SL = ChannelBottom - (SL_Offset_Ticks × syminfo.mintick)
- Short SL = ChannelTop + (SL_Offset_Ticks × syminfo.mintick)
This logic assumes channel breaks invalidate the mean reversion thesis. If price breaks through, the range is no longer valid and position exits.
### Trade Execution Logic:
When entry conditions are met (price in zone, cooldown satisfied, ATR filter passed, no existing position):
1. Calculate entry price at zone boundary
2. Calculate TP and SL based on selected method
3. Execute strategy.entry() with calculated position size
4. Place strategy.exit() with TP limit and SL stop orders
5. Update info table with active trade details
The strategy enforces one position at a time by checking strategy.position_size == 0 before entry.
### Channel Breakout Management:
Channels are removed when price closes more than 10 ticks outside boundaries. This tolerance prevents premature channel deletion from minor breaks or wicks, allowing the mean reversion setup to persist through small boundary violations.
### Position Sizing System:
Three methods calculate position size:
**Fixed Contracts**:
- Uses exact contract quantity specified in settings
- Best for futures traders (e.g., "trade 2 NQ contracts")
**Percentage of Equity**:
- position_size = (strategy.equity × equity_pct / 100) / close
- Dynamically scales with account growth
**Cash Amount**:
- position_size = cash_amount / close
- Maintains consistent dollar exposure regardless of price
## INPUT PARAMETERS:
### Position Sizing:
- **Position Size Type**: Choose Fixed Contracts, % of Equity, or Cash Amount
- **Number of Contracts**: Fixed quantity per trade (1-1000)
- **% of Equity**: Percentage of account to allocate (1-100%)
- **Cash Amount**: Dollar value per position ($100+)
### Channel Settings:
- **Nested Channels**: Allow multiple overlapping channels vs single channel
- **Normalization Length**: Lookback for high/low calculation (1-500, default 100)
- **Box Detection Length**: Period for volatility detection (1-100, default 14)
### Scalping Settings:
- **Enable Long Scalps**: Toggle long entries on/off
- **Enable Short Scalps**: Toggle short entries on/off
- **Entry Zone % from Edge**: Size of entry zone (5-50%, default 20%)
- **SL Offset (Ticks)**: Distance beyond channel for stop (1+, default 5)
- **Cooldown Period (Bars)**: Minimum spacing between signals (0 = no cooldown)
### ATR Filter:
- **Enable ATR Filter**: Toggle volatility filter on/off
- **ATR Timeframe**: Source timeframe for ATR (1, 5, 15, 60 min, etc.)
- **ATR Length**: Smoothing period (1-100, default 14)
- **Min ATR Value**: Threshold for trade enablement (0.1+, default 10.0)
### Take Profit Settings:
- **TP Method**: Choose Fixed Points or % of Channel
- **TP Fixed (Ticks)**: Static distance in ticks (1+, default 30)
- **TP % of Channel**: Dynamic target as channel percentage (10-100%, default 50%)
### Appearance:
- **Show Entry Zones**: Toggle zone labels on channels
- **Show Info Table**: Display real-time strategy status
- **Table Position**: Corner placement (Top Left/Right, Bottom Left/Right)
- **Color Settings**: Customize long/short/TP/SL colors
## VISUAL INDICATORS:
- **Channel boxes** with semi-transparent fill showing consolidation zones
- **Colored entry zones** labeled "LONG ZONE ▲" and "SHORT ZONE ▼"
- **Entry signal arrows** below/above bars marking long/short entries
- **Active TP/SL lines** with emoji labels (⊕ Entry, 🎯 TP, 🛑 SL)
- **Info table** showing position status, channel state, last signal, entry/TP/SL prices, and ATR status
## HOW TO USE:
### For 1-3 Minute Scalping (NQ/ES):
- ATR Timeframe: "1" (1-minute)
- ATR Min Value: 10.0 (for NQ), adjust per instrument
- Entry Zone %: 20-25%
- TP Method: Fixed Points, 20-40 ticks
- SL Offset: 5-10 ticks
- Cooldown: 2-3 bars
- Position Size: 1-2 contracts
### For 5-15 Minute Day Trading:
- ATR Timeframe: "5" or match chart
- ATR Min Value: Adjust to instrument (test 8-15 for NQ)
- Entry Zone %: 20-30%
- TP Method: % of Channel, 40-60%
- SL Offset: 5-10 ticks
- Cooldown: 3-5 bars
- Position Size: Fixed contracts or 5-10% equity
### For 30-60 Minute Swing Scalping:
- ATR Timeframe: "15" or "30"
- ATR Min Value: Lower threshold for broader market
- Entry Zone %: 25-35%
- TP Method: % of Channel, 50-70%
- SL Offset: 10-15 ticks
- Cooldown: 5+ bars or disable
- Position Size: % of equity recommended
## BACKTEST CONSIDERATIONS:
- Strategy performs best in ranging, mean-reverting markets
- Strong trending markets produce more stop losses as price breaks channels
- ATR filter significantly reduces trade count but improves quality during low volatility
- Cooldown period trades signal quantity for signal quality
- Commission and slippage materially impact sub-5-minute timeframe performance
- Shorter timeframes require tighter entry zones (15-20%) to catch quick reversions
- % of Channel TP adapts better to varying channel sizes than fixed points
- Fixed contract sizing recommended for consistent risk per trade in futures
**Backtesting Parameters Used**: This strategy was developed and tested using realistic commission and slippage values to provide accurate performance expectations. Recommended settings: Commission of $1.40 per side (typical for NQ futures through discount brokers), slippage of 2 ticks to account for execution delays on fast-moving scalp entries. These values reflect real-world trading costs that active scalpers will encounter. Backtest results without proper cost simulation will significantly overstate profitability.
## COMPATIBLE MARKETS:
Works on any instrument with price data including stock indices (NQ, ES, YM, RTY), individual stocks, forex pairs (EUR/USD, GBP/USD), cryptocurrency (BTC, ETH), and commodities. Volume-based features require data feed with volume information but are optional for core functionality.
## KNOWN LIMITATIONS:
- Immediate touch entry can fire multiple times in choppy zones without adequate cooldown
- Channel deletion at 10-tick breaks may be too aggressive or lenient depending on instrument tick size
- ATR filter from lower timeframes requires higher-tier TradingView subscription (request.security limitation)
- Mean reversion logic fails in strong breakout scenarios leading to stop loss hits
- Position sizing via % of equity or cash amount calculates based on close price, may differ from actual fill price
- No partial closing capability - full position exits at TP or SL only
- Strategy does not account for gap openings or overnight holds
## RISK DISCLOSURE:
Trading involves substantial risk of loss. Past performance does not guarantee future results. This strategy is for educational purposes and backtesting only. Mean reversion strategies can experience extended drawdowns during trending markets. Stop losses may not fill at intended levels during extreme volatility or gaps. Thoroughly test on historical data and paper trade before risking real capital. Use appropriate position sizing and never risk more than you can afford to lose. Consider consulting a licensed financial advisor before making trading decisions. Automated trading systems can malfunction - monitor all live positions actively.
## ACKNOWLEDGMENT & CREDITS:
This strategy is built upon the channel detection methodology created by **AlgoAlpha** in the "Smart Money Breakout Channels" indicator. Full credit and appreciation to AlgoAlpha for pioneering the normalized volatility approach to identifying consolidation patterns. The core channel formation logic using normalized price standard deviation is AlgoAlpha's original contribution to the TradingView community.
Enhancements to the original concept include: mean reversion entry logic (vs breakout), immediate touch-based signals, multi-timeframe ATR volatility filtering, flexible position sizing (fixed/percentage/cash), cooldown period filtering, dual TP methods (fixed points vs channel percentage), automated strategy execution with exit management, and real-time position monitoring table.

PSP - NQ ES YMThe PSP - NQ ES YM indicator tracks the price movements of the NQ, ES, and YM futures to identify correlation and divergence between them.
🔸 Orange dot (above candle) → When NQ and ES have opposite trends (one up, one down).
🔹 Blue dot (below candle) → When YM differs from either NQ or ES, but NQ and ES are aligned.
🟠🔹 Both dots on the same candle → When NQ and ES differ, and one of them also differs from YM.
🟢 Green dot (above candle at 12 AM NY time) → Marks the daily open at 12 AM New York time.
This helps traders spot market divergence patterns between major indices and potential trading opportunities. 🚀

SPX → NQ Levels ConverterSPX → NQ Levels Converter is a Pine Script indicator that projects key S&P 500 (SPX) levels onto the NASDAQ 100 (NQ) chart using a configurable conversion ratio.
• Dynamic ratio: calculates the live SPX/NQ ratio in real time.
• Static ratio: allows manual input of a fixed ratio.
• Supports up to 10 custom SPX levels, automatically converted into their equivalent NQ values.
• Each level is displayed with a line and label (SPX → NQ) with independent color settings.
• Advanced visualization controls:
• line extension (right, left, both, or fixed)
• line length & placement
• label side & offset.
• Lines and labels auto-update on every bar to stay accurate over time.
Use case: particularly useful for traders who track SPX option levels or support/resistance zones but execute trades on the NQ.

Risk-On / Risk-Off Toolkit [SB1] (NQ, RTY, YM) VIXDescription:
The Risk-On / Risk-Off Toolkit is a professional-grade market context indicator designed to help traders quickly identify broad market sentiment shifts and gauge risk appetite. By combining major US equity futures (NQ, RTY, YM) with VIX dynamics, this toolkit provides clear visual signals of “Risk-On” (bullish, lower volatility environment) and “Risk-Off” (bearish, higher volatility environment) conditions. This is ideal for traders using discretionary analysis, swing strategies, intraday scalping, or portfolio positioning decisions.
My Personal Thoughts: Utilize all 3 charts to Identify which is Leading and who is lagging between the 3 (NQ, RTY, YM) Key Features:
Futures Trend Analysis:
Monitors the Nasdaq 100 (NQ), Russell 2000 (RTY), and Dow Jones (YM) futures in real-time.
Determines bullish/bearish bias based on each futures contract’s current close relative to its open.
Identifies when all three indices are moving in sync, highlighting broad market directional alignment.
VIX Confirmation:
Integrates the CBOE Volatility Index (VIX) to gauge market risk sentiment.
Confirms Risk-On conditions when VIX is falling while all three futures are bullish.
Confirms Risk-Off conditions when VIX is rising while all three futures are bearish.
Optional background shading visually highlights Risk-On (green) and Risk-Off (red) conditions for quick, intuitive assessment.
Strong Body Candle Signals:
Detects high conviction candlestick moves where the body represents at least 85% of the total range.
Confirms whether the candle closes near its extreme (top for bullish, bottom for bearish) within 15% of the range.
Plots arrows for strong bullish or bearish candles:
Green triangle-up for bullish strong candles
Red triangle-down for bearish strong candles
Provides a visual cue for intraday or swing traders to confirm trend momentum without cluttering the chart with labels.
Alert System:
Alerts can be set for Risk-On alignment: all monitored futures are bullish and VIX is falling.
Alerts can also be set for Risk-Off alignment: all monitored futures are bearish and VIX is rising.
Ensures traders never miss shifts in broad market sentiment, suitable for both intraday and end-of-day review.
Table Summary:
Provides a top-right summary table of each monitored market and VIX:
Displays Index Name and Current Bias (Bullish/Bearish/Neutral).
Highlights bullish conditions in green and bearish conditions in red.
Includes VIX status as “↓ Falling”, “↑ Rising”, or “Flat”, providing a quick visual reference of volatility trends.
Customizable Visuals:
Control the visibility of strong candle arrows.
Maintains dynamic bar coloring for strong candle moves (green for bullish, red for bearish).
How to Use the Risk-On / Risk-Off Toolkit:
Trend Confirmation: Use the alignment of NQ, RTY, and YM to determine whether the overall market environment is bullish or bearish.
Risk Sentiment Filter: Use VIX confirmation to identify if traders are in a risk-on or risk-off sentiment. This is especially useful for adjusting position sizing, hedging, or timing entries.
Momentum Validation: Strong candle arrows indicate decisive moves, providing additional confirmation for trade entries, breakouts, or trend continuation.
Alerts & Visual Cues: Set alerts to be notified whenever Risk-On or Risk-Off conditions are met, helping you act in real-time.
Quick Reference: Use the summary table for a bird’s-eye view of market alignment across indices and VIX, avoiding the need to track multiple charts simultaneously.
Why This Indicator is Unique:
Combines three major US indices with volatility confirmation to identify true macro market sentiment shifts.
Provides both visual and alert-based signals for actionable insights.
The inclusion of strong candle arrows gives intraday and swing traders a clear, low-latency cue for high-probability moves.
Perfect for multi-timeframe analysis and adaptable to both short-term and long-term strategies.
Indicator Name Justification:
The name “Risk-On / Risk-Off Toolkit ” accurately reflects the core function: identifying broad market risk appetite and sentiment alignment across key indices with volatility confirmation. It communicates instantly that the tool helps traders understand when the market is favoring risk-taking (Risk-On) versus risk-aversion (Risk-Off).

ES/NQ Price Action Sync See when ES & NQ move in syncSee when ES & NQ move in sync — revealing real market momentum at a glance.”
⚖️ ES/NQ Price Action Sync
Discover when the market moves as one.
This indicator tracks when S&P 500 Futures (ES1!) and Nasdaq Futures (NQ1!) align in momentum — helping you spot broad-market confirmation or early divergence in real time.
🧠 Concept
The ES/NQ relationship often reveals the market’s underlying strength or hesitation. When both indices turn bullish or bearish together with meaningful movement, that’s a sign of true market alignment.
When they disagree — expect mixed momentum and possible reversals.
⚙️ Features
✅ Highlights new bullish and bearish syncs on chart
✅ Dynamic info table showing % change and direction for each index
✅ Optional triangle markers for clean visual cues
✅ Alert conditions for new sync events
✅ Adjustable lookback and minimum-move filters
💡 How to Use
Use this as a market-context tool, not a direct buy/sell signal.
When both indices sync, intraday trends often hold better; when they diverge, momentum may fade.
Combine it with your own system or higher-time-frame analysis for confirmation.
📊 Why Traders Love It
Simple idea — powerful insight.
This tool helps traders instantly see when “the market machine” is running in harmony… or pulling in opposite directions.
⚠️ Disclaimer:
This script is for educational and analytical purposes only.
It does not provide financial advice or trading signals. Always perform your own research before making trading decisions.

(ES, NQ) Trend Checker SB1(ES, NQ) Trend Checker SB1
Stay ahead of the market by tracking whether the E-mini S&P 500 (ES) and the Nasdaq 100 (NQ) are moving in sync.
📊 How it works:
The script checks whether each index is bullish (close > open) or bearish (close < open).
If both are aligned (all bullish or all bearish), conditions are stable.
If they diverge, the indicator instantly flags a mismatch in trend.
🎯 Features:
Background shading to highlight mismatched conditions.
Real-time alerts when ES and NQ fall out of sync.
Works on any timeframe.
🔥 Why it matters:
When ES and NQ move together, market momentum is usually stronger and cleaner.
But when they disagree, expect choppiness, fakeouts, or caution zones — the perfect heads-up before entering trades.
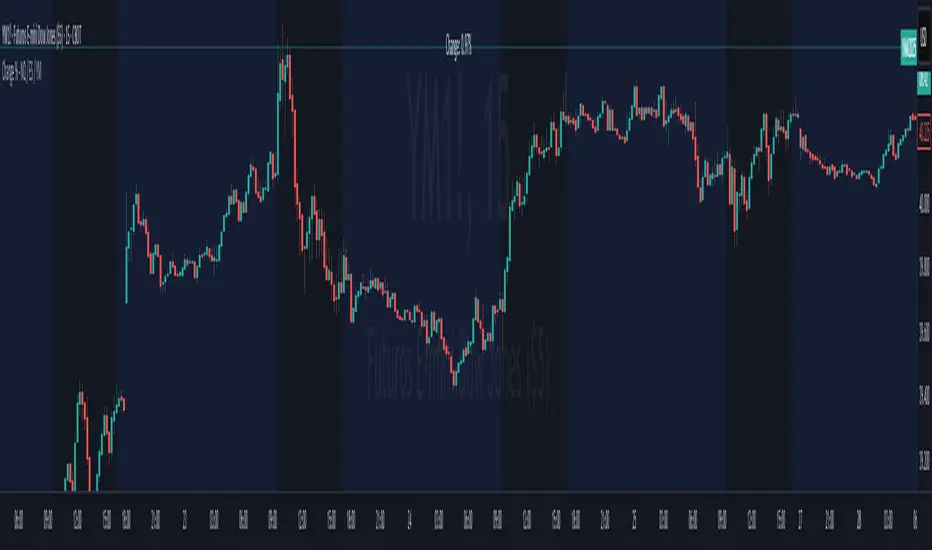
MNQ/NQ Rotations [Tiestobob]### Indicator Description: MNQ/NQ Rotations
TO BE USED ONLY ON THE CONTINOUS CONTRACTS NQ1! and MNQ1! It will not work on others or the forward contracts of these.
#### Overview
The MNQ/NQ Rotations indicator is designed for traders of Nasdaq futures (MNQ and NQ) to visualize key price levels where typical market rotations occur. This indicator identifies and highlights the xxx.20 and xxx.80 levels based on empirical data and trading experience, allowing traders to recognize potential support and resistance points during trading sessions.
#### Key Features
- **Timeframe Selection**: The indicator allows users to specify a timeframe for identifying breakout candles, ensuring flexibility across different trading strategies.
- **Active Trading Range**: Users can define an active trading range, focusing the analysis on specific hours when the market is most active.
- **Visual Representation**: The indicator paints horizontal lines at key price levels (xxx.20 and xxx.80), extending them across a user-defined length to aid in visual analysis.
- **Customization**: Users can customize the color of the lines to match their charting preferences.
#### Inputs
- **Timeframe (`tf`)**: Defines the timeframe to select the breakout candle (default: 1 minute).
- **Active Trading Range (`session`)**: Specifies the time range for identifying breakout candles (default: 08:00-12:00).
- **Line Color (`line_color`)**: Allows customization of the line color (default: purple).
#### Logic
1. **Session Validation**: The indicator checks if the current bar falls within the specified active trading range.
2. **Price Point Calculation**: For each candle close, the indicator calculates the nearest xxx.20 and xxx.80 levels.
3. **Line Drawing**: Horizontal lines are drawn at these key levels, extending a specified length forward to highlight potential rotation points.
#### Use Cases
- **Support and Resistance Identification**: By highlighting the xxx.20 and xxx.80 levels, traders can easily spot areas where the market is likely to reverse or consolidate.
- **Breakout Trading**: Traders can use the indicator to identify breakout levels and set appropriate entry points.
- **Risk Management**: The visual cues provided by the indicator can help traders set more effective stop-loss and take-profit levels.
#### Example
A trader using a 1-minute timeframe with an active trading range from 08:00 to 12:00 will see horizontal lines painted at the nearest xxx.20 and xxx.80 levels for each candle close during this period. These lines serve as visual markers for typical rotation points, aiding in decision-making and trade planning.
#### Conclusion
The MNQ/NQ Rotations indicator is a powerful tool for traders looking to enhance their market analysis of Nasdaq futures. By focusing on empirically derived rotation levels, this indicator provides clear visual cues for identifying key price levels, supporting more informed trading decisions.
SMT + CVD (NQ vs ES) w/ AlertsSMT + CVD (NQ vs ES) w/ Alerts
This tool combines Smart Money Technique (SMT) and Cumulative Volume Delta (CVD) to highlight high-probability inflection points on NQ (primary) versus ES (secondary).
How it works
SMT condition: the primary breaks its most recent swing (High for bearish / Low for bullish) while the secondary does not break the corresponding swing within a small retest window.
CVD confirmation: at the same time, the primary’s CVD shows divergence (higher price but lower/equal CVD for shorts, lower price but higher/equal CVD for longs).
When both align, the script plots a marker/label and draws a line from the primary swing to the signal bar. Alerts are fired.
Signals & Alerts
Labels: “SMT+CVD DOWN/UP” on the signal bar.
Lines: connects the primary swing → signal bar so you can see the structure that produced the signal.
Alert names: “SMT+CVD Bearish” and “SMT+CVD Bullish.”
Inputs
Primary / Secondary symbols: defaults NQ & ES (you can change them).
Resolution: use chart timeframe or specify one.
Swing Left/Right Bars: pivot detection depth (higher = larger swings).
Break Window Bars: how many bars the secondary has to not break for SMT to be valid.
CVD Up/Down By: Close vs Previous Close (default) or Close vs Open.
Anchor CVD Daily: resets CVD at session/day start.
CVD Smoothing (EMA): smooths the CVD line (optional show).
FAST Pivots (no future bars): left-only swing detection so signals appear sooner and behave well in Replay/live.
Require Secondary Pivot: if ON, SMT checks wait for a confirmed secondary swing; if OFF, signals can appear while the secondary swing is still forming (useful for Replay/testing).
Show CVD line: optional, may compress price scale.
Non-repaint notes
With FAST Pivots ON, swings are detected with no future bars (minimal latency = leftBars).
With FAST Pivots OFF, standard pivots require rightBars future bars to confirm the swing (classic, but naturally delayed).
Tips
For intraday futures, keep leftBars/rightBars small (e.g., 3/3) and Break Window 1–3.
In Replay, enable FAST Pivots and consider disabling Require Secondary Pivot if you want signals to appear as soon as the primary breaks.
Combine with session filters, execution rules, or liquidity zones for context.

Dominus US Indici - Core4 (ES,NQ,YM,RTY) - EditabileOne-liner
“Dominus US Indici ranks ES, NQ, YM, RTY at the NY open using a blended Score (return from window start + VWAP delta) to highlight the strongest long/short and give clean BUY/SELL signals.”
Short paragraph
“Dominus US Indici analyzes the four core US indices (ES, NQ, YM, RTY) from the New York open. It builds a single Score by combining momentum from the window start with distance from VWAP, ranks the indices, and flags only the top, high-quality opportunity. Optional ‘Alpha vs S1’ (beta-neutral), macro gate (DXY & US10Y), editable symbols/timezone, and a freeze snapshot keep decisions consistent.”
Bullets
Core4: ES, NQ, YM, RTY (editable).
Score = Return from start + VWAP delta (weighted).
Live table + ranking; threshold → BUY/SELL signals.
Optional Alpha vs S1 and macro filter (DXY, US10Y).
Custom window/timezone + freeze at window end.
If you want, I can add a tighter IG caption + hashtags in your Dominus style.

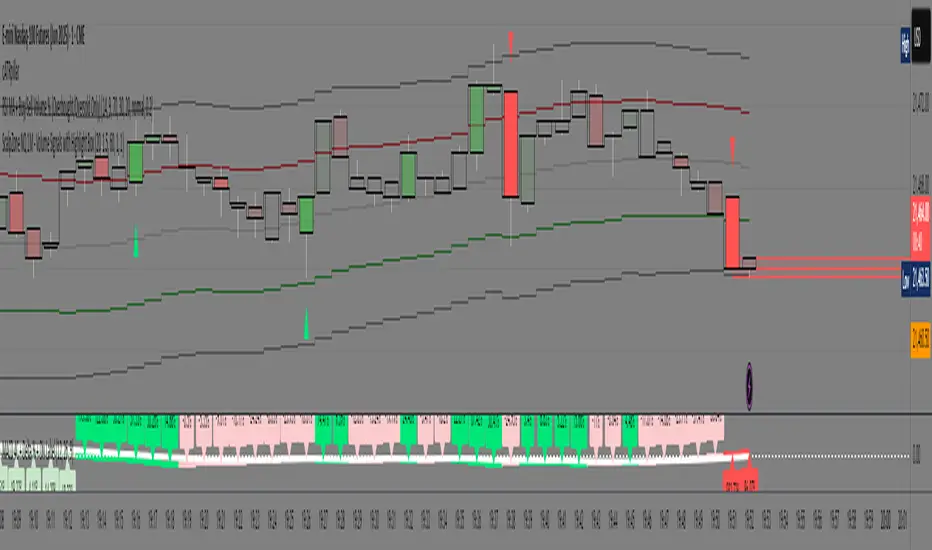
ScalpZone NQ 1M - Volume Signals with Highlight Box📊 ScalpZone NQ 1M - Volume Signals with Highlight Box
ScalpZone is a professional-grade indicator designed specifically for 1-minute scalping on Nasdaq Futures (NQ), focusing on high-volume price action zones. It automatically detects aggressive buying/selling activity based on volume spikes and visualizes potential entry zones with dynamic horizontal lines and price boxes.
🔍 Key Features:
Volume Spike Detection: Identifies high-volume candles using an adjustable EMA-based volume threshold.
Directional Volume Signals: Highlights candles with directional momentum (bullish or bearish) based on real-time volume dominance.
Scalp Zone Visualization:
Draws horizontal support/resistance lines at volume signal prices.
Renders price boxes around those levels to highlight actionable zones.
Zones automatically extend when respected by price, and disappear when invalidated.
Visual Candle Enhancement: Dynamically colors candles to reflect normalized volume intensity and direction.
Customizable Parameters:
Volume EMA & threshold multiplier
Line and box dimensions
Toggle zone visibility
🛠️ Use Case:
Perfect for scalpers and short-term traders looking to exploit volume-based reversals or breakout traps on the NQ 1-minute chart. Traders can use the visual cues to time entries, manage stops, or validate confluence with other tools (e.g., order flow, delta spikes, or footprint charts).
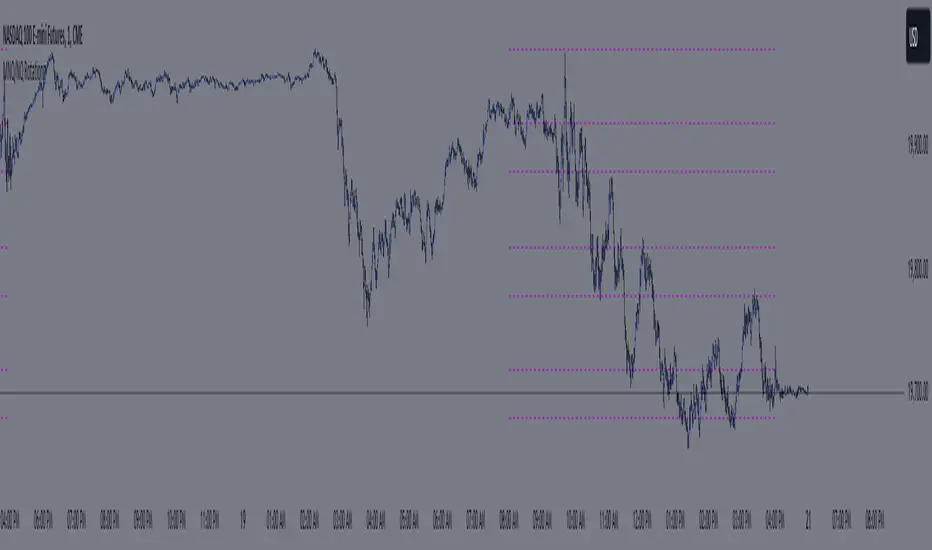
Price Guide NQ### **Price Guide NQ - Indicator Description (English)**
The **Price Guide NQ** indicator is designed to plot horizontal guide lines at specific price levels based on the **daily opening price** of the Nasdaq (NQ) index. Instead of dynamically adjusting with each new candle, the levels remain fixed throughout the trading day, providing a stable reference for traders.
#### **Key Features:**
- **Daily Open-Based Levels**: The indicator captures the market's opening price each day and calculates the price guide levels from that fixed point.
- **Predefined Price Increments**: It plots **30 levels above and below** the opening price in increments of 10 points (e.g., 19810, 19820, 19830, etc.).
- **Clear Visualization**: The guide lines are drawn with a **dotted style** and a neutral **gray color** to avoid cluttering the chart while providing key reference levels.
- **Automatic Line Management**: Each time a new trading day starts, the previous day's lines are removed, and new ones are plotted based on the fresh opening price.
#### **Usage:**
This indicator is particularly useful for traders looking to identify psychological price levels or areas of potential support and resistance throughout the trading session.
Let me know if you'd like any modifications or enhancements! 🚀

Trading Value RSI (NQ Tuned)The Trading Value RSI (NQ Tuned) is an indicator that applies the RSI calculation to trading value, defined as volume × close, rather than just price. It is specifically tuned for Nasdaq 100 futures (NQ), with a default RSI length of 24, overbought level at 75, and oversold level at 25 to filter out false signals from high volatility. The indicator visually colors the RSI line based on overbought (red), oversold (green), or neutral (blue) conditions. A horizontal midline at 50 helps identify potential trend direction changes or confirm ongoing momentum. This tool allows traders to monitor capital flow intensity, giving insight into when strong buying or selling pressure may drive short-term market moves.

Ichimoku + VWAP + OBV + ATR Full System (NQ Daytrade)Extended Indicator Description
Ichimoku + VWAP + OBV + ATR Full System is a rule-based intraday trading indicator designed specifically for NQ day trading, focusing on trend alignment, participation confirmation, and volatility-aware execution.
This indicator does not rely on a single signal or crossover. Instead, it integrates multiple market dimensions into one structured framework to help traders identify high-probability trend continuation scenarios while avoiding low-quality, range-bound conditions.
System Philosophy
The core idea of this system is simple:
trade only when trend, price location, volume, and volatility are aligned.
Each component plays a specific role and is not meant to be used in isolation. The indicator works best when all conditions reinforce the same directional bias.
Component Breakdown
Ichimoku Cloud
Used to define the primary market structure and directional bias. The system favors trades only when price action aligns clearly above or below the cloud, helping filter out indecisive or transitional phases.
VWAP
Acts as a session-based equilibrium reference. Price position and distance relative to VWAP are used to confirm whether the market is trending with intent rather than reverting to the mean.
OBV (On-Balance Volume)
Provides participation and flow confirmation. OBV helps validate whether price movement is supported by volume, reducing the likelihood of false breakouts or weak trend signals.
ATR (Average True Range)
Used as a volatility filter and risk-awareness tool. ATR conditions help the system avoid low-volatility environments and support more realistic expectations for intraday movement.
Trade Logic Overview
The system is designed around trend-following pullbacks, not prediction or counter-trend trading.
When trend structure is established and confirmed by VWAP positioning and OBV behavior, pullback zones within the trend become areas of interest. ATR conditions ensure that trades are taken only when sufficient movement potential exists.
Rather than generating frequent signals, the system prioritizes selectivity and clarity, making it suitable for disciplined day traders who value context over quantity.
Intended Use
This indicator is built for:
NQ intraday and day trading
Trend continuation and pullback strategies
Traders who prefer structured, confirmation-based systems
Lower to mid intraday timeframes such as 3-minute, 5-minute, and 15-minute charts
Important Notes
This is not an automated trading system and does not provide guaranteed results. The indicator is designed as a decision-support tool to assist with market context, directional bias, and trade timing. Risk management, execution, and position sizing remain the responsibility of the user.
롱/숏 삼각형 시그널
동그라미 청산 시그널
VWAP 밴드 기반 방향성
OBV 보조지표
이름 (Name)
BTC Scalping Signal – VWAP + OBV
짧은 설명 (Short Description)
VWAP 밴드와 OBV를 기반으로 방향성, 진입·청산 시그널을 제공하는 스캘핑 지표입니다.
긴 설명 (Long Description)
이 지표는 BTC 단기 스캘핑을 위해 설계된 것으로, 특히 15분봉 환경에 최적화되어 있습니다.
VWAP 밴드의 위치와 추세 판별 로직을 기반으로 롱·숏 진입 신호를 제공합니다.
OBV 모멘텀을 보조 필터로 사용하여 돌파 및 되돌림 가능성을 판단합니다.
시장 변동성이 축소되거나 평균회귀 신호가 감지될 때 청산 시그널을 표시합니다.
삼각형(진입), 원형(청산) 등 직관적 시각 요소를 통해 빠른 의사결정을 지원합니다.

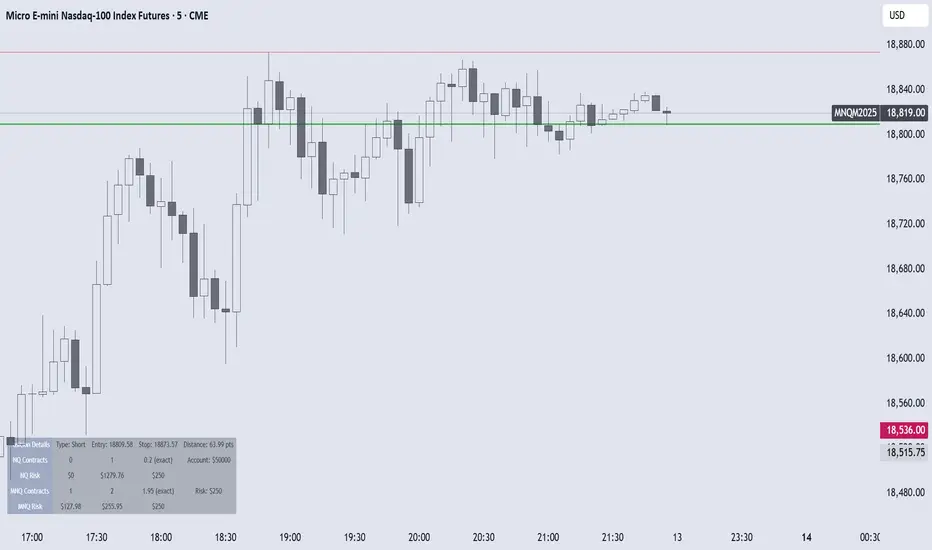
Micro/Mini P&L [LDT]Overview
Micro/Mini P&L is a risk and P&L visualization tool built primarily for futures traders.
It provides accurate dollar-based calculations for either micros or minis, regardless of which contract type you are currently charting.
The indicator automatically detects your instrument (NQ, MNQ, ES, MES, YM, RTY, CL, GC, etc.) and adjusts point-value data accordingly, allowing you to chart one contract while evaluating risk for another.
This removes the need for manual conversions and keeps your position data consistent at all times.
Although optimized for futures, the tool also works on any other asset for general trade-level visualization.
Features
• Automatic instrument detection for major futures markets including NQ/MNQ, ES/MES, YM/MYM, RTY/M2K, CL/MCL, GC/MGC and others.
Point-value logic adjusts instantly based on the detected symbol ensuring accurate calculations without manual configuration.
• Micro/Mini display toggle, allowing you to calculate dollar values for either contract type regardless of which contract is on your chart.
Useful for traders who prefer charting minis whilst trading micros or the opposite.
• Trade-level visualization, including Entry, Take Profit and Stop Loss levels with automatically drawn lines and optional TP/SL zone shading for clear and structured display on the chart.
• Dynamic P/L calculations, showing both point-based and dollar-based metrics in real time.
This includes TP/SL dollar values, points to target/stop, real-time P/L and an optional risk-reward ratio.
• Adaptive risk table, displaying contract counts from 1 up to your selected maximum, total dollar risk for each row and highlighting your chosen contract size.
This provides a straightforward method for evaluating risk, scaling and position sizing.
• Customizable display options, including color settings, label visibility, extension length, bar offsets and table positioning.
This allows the tool to remain clean, unobtrusive and easy to integrate into any chart layout.
Purpose
This tool is designed to give futures traders a clear, consistent and reliable way to view dollar-accurate risk per contract without performing manual conversions.
Whether you trade micros or minis, the displayed values always align with your selected contract type, even when charting the opposite market.

NDX Ladder → Adjusted to Active Ticker (5s & 10s)This indicator allows you to a grid of NDX levels directly on the NQ! (E-mini NASDAQ 100 Futures) chart, automatically adjusting for the spread between NDX and NQ1!. This is particularly useful for traders who perform technical analysis on SPX but execute trades on NQ1!.
Features:
Renders every 5 and 10 points steps of the NDX in your current chart.
The script adjusts these levels in real-time based on the current spread between NDX and NQ / MNQ
Plots updated horizontal lines that move with the spread

MNQ/NQ Risk Management ToolThis tool helps MNQ and NQ futures traders automatically calculate position size based on either a fixed dollar risk or a percentage of account balance.
Simply enter your stop loss level and choose whether to risk a set dollar amount or a percentage of your account. The script will display how many contracts to trade based on your setup.
Features:
Calculates contracts based on stop loss and risk size
Toggle between dollar-based or percent-of-account risk
Works with both MNQ ($2/point) and NQ ($20/point)
Automatically updates based on current price and direction (long or short)
Displays a clean info box on your chart with risk, contracts, and settings
This tool is ideal for intraday or swing traders who want to stay consistent with risk management across trades.

Change % Inteligente - NQ / ES / YMTopstep Compliance: Daily Price Change % Alert (NQ / ES / YM)
Script Purpose
This script helps funded traders (especially those using Topstep or similar programs) monitor the real-time percentage change of major equity index futures: Nasdaq (NQ), S&P 500 (ES), and Dow Jones (YM).
⚠️ Why it matters
Topstep prohibits trading within 2% of the daily price limits set by the CME. If a trader holds a position too close to those limits, they risk account disqualification.
📊 How it works
• Detects the instrument: NQ1!, ES1!, YM1!, or M2025 contracts
• Calculates the real-time % change from today’s market open
• Simulates daily CME price limits (+7% / -7%)
• Highlights when price enters the last 2% of the limit range (prohibited zone)
• Displays a clean, floating panel with the current % change and a warning if necessary
• Sends a visual and optional audio alert when in the prohibited zone
🧠 What makes this script unique?
This tool is **not for technical analysis**. It focuses exclusively on **funding program compliance** and **account protection**, which is not covered by other public scripts. It’s lightweight, intuitive, and designed for traders who manage risk like professionals.
✅ Open-source and ready for review.
✅ CHART SETUP FOR PUBLICATION
✔️ Use a clean chart
✔️ Only apply this script
✔️ Make sure the panel is visible (top-right or top-center recommended)
❌ No extra indicators or drawings
✔️ Use NQM2025, ESM2025 or YMM2025 on a volatile day (to show -1% to -3% range)
INSTRUCTIONS
1. Add the script to your chart.
2. Use it with NQ1!, ES1!, or YM1! (or M2025 contracts).
3. The panel will show today’s price change %.
4. If the market is within the last 2% of the CME price limit, a warning will appear.
5. Use this to avoid violating Topstep’s trading rules during volatile days.