High & Low Of Custom Session - Breakout True Open [cognyto]This indicator is based on the High & Low Of Custom Session - OpeningRange Breakout (Expo) created by Zeiierman.
It adds new functionality and enhances existing settings, targeting ES, NQ, and YM:
Manages session defaults to 12:00 to 13:00
New true opening fully customizable (default 13:00)
Manages timeframe visualization (default 15m and below)
Manages session draw length until the end of the current session (default NY)
Manages previous sessions, allowing the to be hidden
Improves timezone selection (default NY)
Following the strategy called Paradox detailed by DayTradingRauf, it works with indices like ES, NQ, and YM.
The rules consider three possible profiles:
First
AM session as consolidation (08:00-12:00)
Lunch hour range as consolidation (less than 100 points)
PM session breaking either side of the session range
Second
AM session trending lower (08:00-12:00)
Lunch hour range as consolidation (less than 100 points)
PM session trending higher
Third
AM session trending higher (08:00-12:00)
Lunch hour range as consolidation (less than 100 points)
PM session trending lower
After the session ends, the opening price at 13:00 is automatically drawn as it is a key point for the entry strategy.
The strategy can be monitored using a 5-minute or 15-minute timeframe as follows:
- Wait for a liquidity hunt (either the high or low of the lunch session range or AM is taken).
- If liquidity is taken, switch to the 1-minute timeframe and wait for a CISD (change in the state of delivery), where the price closes below an OB, or consider a breaker block or iFVG to enter the trade.
- Bullish entries should happen below the opening price at 13:00, and bearish entries should happen above.
- Consider a 1:2 reward ratio. However, runners can target the opposite side of the range that was not yet taken.
This indicator is for informational purposes only and you should not rely on any information it provides as legal, tax, investment, financial or other advice. Nothing provided by this indicator constitutes a solicitation, recommendation, endorsement or offer by cognyto or any third party service provider to buy or sell any securities or other financial instruments in this or any other jurisdiction in which such solicitation or offer would be unlawful under the securities laws of such jurisdiction.
ابحث في النصوص البرمجية عن "NQ"

Intermarket Correlation TableThe Correlation Coefficient is used to measure the correlation between two sets of data. In the trading world, the Correlation Coefficient is a measure of the correlation between two data sets of financial instruments. The correlation between two financial instruments is the degree in which they are related. Correlation is based on a scale of 1 to -1. The closer the Correlation Coefficient is to 1, the higher their positive correlation. The instruments will move up and down together. The closer the Correlation coefficient is to -1, the more they move in opposite directions. A value at 0 indicates that there is no correlation.
This indicator uses the built in ta.correlation function to calculate the correlation coefficient between DXY and NQ, ES, YM, US10Y, and ZN respectively. It then presents the data in a customizable table that is view as an overlay on your chart.
Adjust the length of the correlation factor to calculate higher time frame correlation.
Asset background changes based on current candle direction.
Coefficient background color changes based on whether the assets are properly correlated.
DXY is inversely correlated to NQ, ES, YM, and ZN.
DXY is directly correlated to US10Y.
The colors are reflected as such.

Range Average Retest Model [LuxAlgo]The Range Average Retest Model tool highlights setups from the range average retest entry model, a model using the retest of the average between two opposite swing points as an entry.
This tool uses long-term volatility coupled with user-defined multipliers to filter out swing areas and set take profit and stop loss levels for all trades.
Key features include:
Draw up to 165 swing areas and their associated trades
Filter out swing areas using Pivot Length , Selection Mode and Threshold parameters
Filter out trades with Maximum Distance and Minimum Distance parameters
Enable or disable swing areas and select default colors
Enable or disable overlapping trades and change the default colors for Take Profit and Stop Loss zones
🔶 USAGE
The "Range Average Retest Model" is an entry model that enters a position when the price retests the average made between two swing points. Users can determine the period of the detected swing points from the "Pivot Length" setting.
The conditions for long or short trades, regardless of whether the swing area is bullish or bearish, are as follows:
Long positions: the current bar close is below the swing area average and the last bar close was above it.
Short positions: the current bar close is above the swing area average price and the last bar close was below it.
Each trade is displayed on the chart with a line connecting it to its swing area highlighting the range average, a green area for the take profit, and a red area for the stop loss.
Both the Take Profit and Stop Loss levels are calculated by applying your own multiplier in the settings panel to the long-term volatility measure, in this case, the average true range over the last 200 bars.
Trades will remain open until they reach either the Stop Loss or Take Profit price levels.
🔹 Filtering Swing Areas
The daily chart of the Nasdaq-100 futures (NQ) with pivot length 2 and bullish selection mode: it only detects bullish swing areas, but they are smaller and more numerous.
Traders can manipulate the behavior of the swing areas from the settings panel.
The Selection mode will filter areas by bias: it will detect bullish areas, bearish areas, or both.
The Threshold parameter is applied to the long-term volatility to filter out areas where the average prices are too close together; the higher the value, the greater the difference between the average prices must be.
🔹 Trades
3-minute chart of the Nasdaq-100 futures (NQ) with pivot length 5, bearish selection mode maximum distance 4, and stop loss 2: many trades detected with very asymmetric risk/reward.
The behavior of the trades is also manipulated from the settings panel.
The maximum and minimum distance parameters specify the number of bars a trade must be away from a swing area.
The Take Profit and Stop Loss parameters are applied to the long-term volatility to obtain their respective price levels.
🔹 Overlapping Trades
Same chart as before, but with overlapping trades: messy, right?
By default the tool does not show overlapping trades, this allows for a cleaner chart.
In the settings panel traders can enable overlapping mode, in which case the tool will show all available trades.
Traders must be aware that the chart can be very crowded.
🔶 SETTINGS
🔹 Swings
Pivot Length: How many bars are used to confirm a swing point. The larger this parameter is, the larger and fewer swing areas will be detected.
Selection Mode: Swing area detection mode, detect only bullish swings, only bearish swings, or both.
Threshold: Swing area comparator. This threshold is multiplied by a measure of volatility (average true range over the last 200 bars), for a new swing area to be detected it must have an average level that is sufficiently distant from the average level of any untouched swing area, this parameter controls that distance.
🔹 Trades
Maximum distance: Maximum distance allowed between a swing area and a trade.
Minimum distance: Minimum distance allowed between a swing area and a trade.
Take profit: The size of the take profit - this threshold is multiplied by a measure of volatility (the average true range over the last 200 bars).
Stop loss: The size of the stop-loss: this threshold is multiplied by a measure of volatility (the average true range over the last 200 bars).

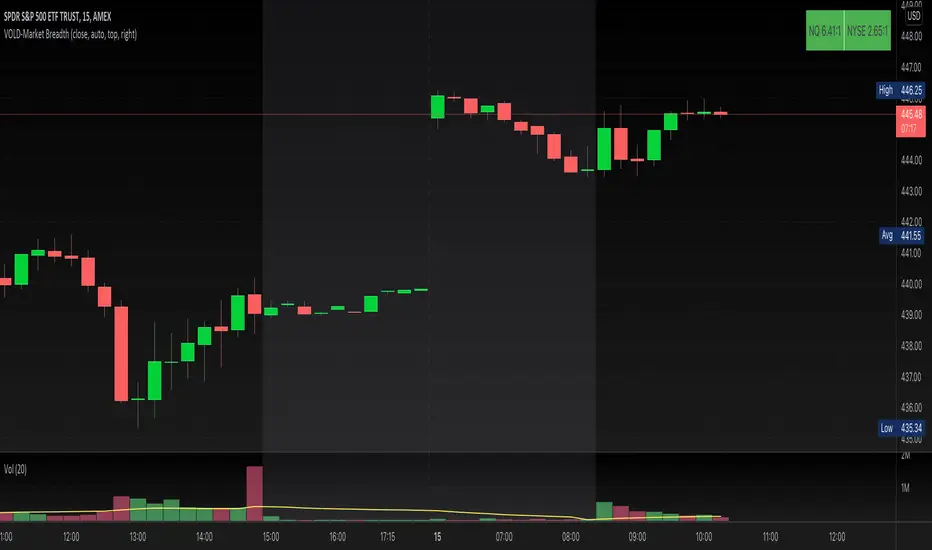
VOLD-MarketBreadth-RatioThis script provides NASDAQ and NYSE Up Volume (volume in rising stocks) and Down Volume (volume in falling stocks) ratio. Up Volume is higher than Down Volume, then you would see green label with ratio e.g 3.5:1. This means Up Volume is 3.5 times higher than Down Volume - Positive Market Breadth. If Down Volume is higher than Up Volume, then you would see red label with ratio e.g -4.5:1. This means Down Volume is 4.5 times higher than Up Volume.
For example, ratio is 1:1, then it is considered Market Breadth is Neutral.
PS: Currently TradingView provides only NASDAQ Composite Market volume data. I have requested them to provide Primary NASDAQ volume data. If they respond with new ticket for primary NQ data, I will update the script and publish the updated version. So if you have got similar table on ToS, you would see minor difference in NQ ratio.
Session Levels - Ultimate Range IndicatorSession Levels - Ultimate Range Indicator
Primarily developed for trading the E-MINI Futures Markets like NQ or ES from the CME Group,
but also more than suitable for Crypto or other instruments.
This indicator highlights the chosen session, which can be Globex, Asian, London and New York.
It plots the important levels and also renders the Opening Range as it forms (a.k.a. Initial Balance).
After the 1st hour Opening Range is finished, it can plot the Standard Deviations / Projections.
See below for a complete feature list.
All Opening Ranges on chart and for the New York session the Range Projections are turned on:
s3.tradingview.com
How to use (example):
If you are trading the Nasdaq Futures (NQ!)
Enable the Globex Overnight session. Basically in the Futures Market, the Globex session is everything outside of US trading hours of Stocks. This draws the important overnight levels, like the Low, 25%, 50%, 75% and the High.
Enable the New York Session with Levels and Opening Range. Generally, 70% of the time the 1st hour will put a Low or High of the day.
If the price is trading above the Globex Low, most likely the Low of the Day is formed and the price target for the day will be 1.5x Standard Deviation and 2x Standard Deviation.
[*} Deviation of the Initial Balance depends on the volume ad overall market structure.
** This is not financial advice or any guarantee **
Features:
Show each Session Highlighted on Intraday chart in it's own color (each session can be turned off and has customizable times and color)
Show Line Levels of each session: Low, 25%, 50%, 75% and the High (customizable color)
Show the Opening Range (Initial Balance) of the Asian, London and New York session. Note: NY has more options.
Opening Range is displayed as a box with level lines (customizable color)
Levels are drawn to the end of the NY Cash session (customizable time)
Show IB Standard Deviations 0.5 - 3.0. Calculated from the Opening Range (Initial Balance)
Option to display Higher Timeframe levels: Previous Day Open/Close and Previous Week Open/Close
All level lines and OR boxes size dynamically as the session progresses
Built in Alerts for when price hits key levels. e.g. Alert when price crosses the NY Opening Range High. Or an Alert when the first STDEV is hit.
Option to toggle display of drawings for Today's trading session only, or Show all recent session levels. This keeps the chart clean or not.
Extras:
The NY Opening Range also has a 50% level line
The NY Opening Bar can be highlighted separately
The Level Lines can have small labels turned on/off. Values are only shown on mouse over to keep a clean chart
Keep in mind:
1) This indicator works on all instruments, but on instruments with limited market hours, your chart setting
has to be set to "Extended Hours" otherwise. For example TSLA on NASDAQ.
2) The Exchange Time Zone for the CME Group is Chicago UTC-6. So the session times you configure in the settings menu are based on that timezone too.
3) Globex opens at 5pm CST and closes when the US session starts 8:30CST.
4) When enabling the Alerts in the Indicator settings, be sure to also create an alarm for this indicator using the Alarm function of Tradingview.

Nasdaq Day and night breakdownOrange: the (close - open) of NQ before market open
Blue: the (close - open) if NQ after market open
White wicks: the vibrating range of that day

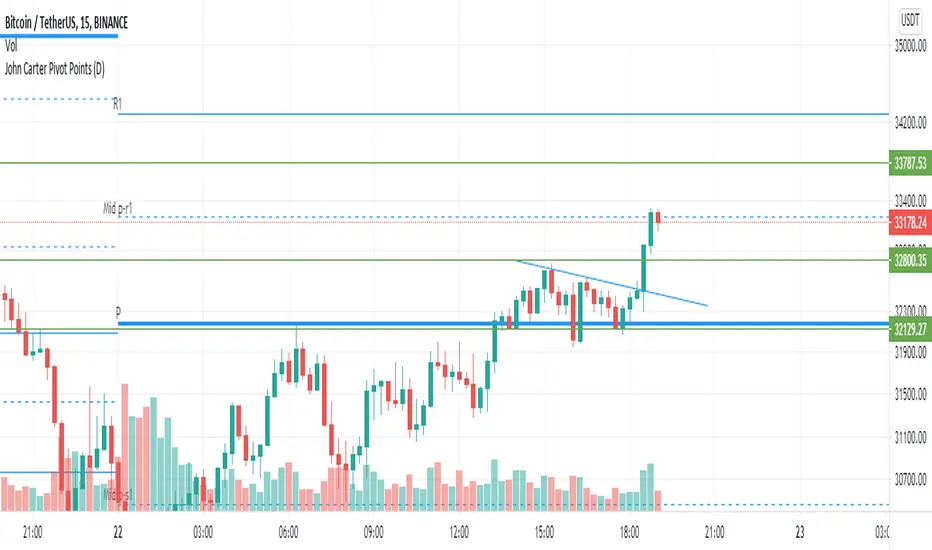
John Carter Pivot Points
This script is based on John Carter Mastering The Trade book. Pivot calculation is based on the previous day high, low, and close.
What Are the Trading Rules for Pivot Buys on Trending Days?
Sells are reversed.
1. Each day I update the appropriate pivot levels on the charts to reflect the previous day’s action. On Mondays, I also
update the weekly pivots, and on the first trading day of a new month, I update the monthly pivots.
2. The first pivot play is done in conjunction with the gap, if there is one. If there is a gap down, then I buy a decline into
the closest pivot level. If there isn’t a playable gap (more than 10 YM points or 1 ES point), then I will wait until
9:45 a.m. eastern to initiate the first play.
3. If the volume on the five-minute ES chart is more than 25,000 contracts, then I’ll wait for the markets to penetrate a
pivot level and move up at least a quarter of the way to the next pivot level. Once this happens, I will then set up a
bid to buy the first retracement back to the violated pivot level.
4. I enter my trades with limit orders only. I place orders “just in front of” the pivot. For the YM, I use 3 points; for the
ES, 0.25 point; for the NQ, 0.50 point; for the TF, 0.20 point; and for individual stocks, 5 cents. For example, if I’m
trading the YM and the pivot level is 10,000, then I would buy a decline to 10,003 and short a rally to 9997
.Sometimes the pivot will be an odd number, such as 1117.38 on the ES. In this case, I always round in the direction of
the trade. So, if I’m bidding for a long, I will round 1117.38 to 1117.50, and my bid will be 1117.75. If I’m offering a
short, I will round 1117.38 down to 1117.25 and place my offer at 1117.00. My stops and targets, then, would be “just
in front of” these appropriate long and short levels.
5. Once filled, I place an order to close the first half at the next pivot level and the second half at the pivot level after
that, using the same “just in front of” parameters.
6. I place a stop at 20 points for the YM, 2 points for the ES, 4 points for the NQ, and 1.50 points for the Russell. For
stocks, I will use a stop based roughly on the price of the stock. If the stock is under $10 a share, I will use a stop of
20 cents. If it is between $10 and $20, I will use a stop of 30 cents; if it is between $20 and $30, I will use a stop of
40 cents, and so on, adding another 10 cents for each $10 increment in price. (A $75 stock would have an 80-cent
stop, for example.)
7. If the first target is hit, I will then move up the stop to my entry-level pivot, minus the “just in front of” fractions
discussed in rule 3. For example, if I get in a YM long at 10,003 and the pivot is at 10,000, then my new stop would
be 9997 once the first target is hit.
8. If I am in a trade at the market close and neither my stop nor my target has been hit, I will close out my position “at the
market” at 4:10 p.m. eastern for futures, and at 3:58 p.m. eastern for stocks.
9. I don’t initiate any new positions after 3:30 p.m. eastern, but I will manage existing positions into the close.
10. The markets rarely have a sustained move above R3 or below S3. If I trade to those levels, I will always fade the
move.
11. After two losers in a row, I’m done with pivots for the day.
What Are the Trading Rules for Pivot Buys on Choppy Days?
Once again, sells are the same, just reversed. The rules for choppy days are identical except for the targets. On choppy days, I
just focus on the YM and the ES. My first target is mechanical: 10 points for the YM and 1 point for the ES on half of my
position. Once this is hit, I will trail up my stop in the same way I would for a trending trade. The second target becomes the
“just in front of” level for the actual next pivot level
Open Interest Rank-BuschiEnglish:
One part of the "Commitment of Traders-Report" is the Open Interest which is shown in this indicator (source: Quandl database).
Unlike my also published indicator "Open Interest-Buschi", the values here are not absolute but in a ranking system from 0 to 100 with individual time frames-
The following futures are included:
30-year Bonds (ZB)
10-year Notes ( ZN )
Soybeans (ZS)
Soybean Meal (ZM)
Soybean Oil (ZL)
Corn ( ZC )
Soft Red Winter Wheat (ZW)
Hard Red Winter Wheat (KE)
Lean Hogs (HE)
Live Cattle ( LE )
Gold ( GC )
Silver (SI)
Copper (HG)
Crude Oil ( CL )
Heating Oil (HO)
RBOB Gasoline ( RB )
Natural Gas ( NG )
Australian Dollar (A6)
British Pound (B6)
Canadian Dollar (D6)
Euro (E6)
Japanese Yen (J6)
Swiss Franc (S6)
Sugar ( SB )
Coffee (KC)
Cocoa ( CC )
Cotton ( CT )
S&P 500 E-Mini (ES)
Russell 2000 E-Mini (RTY)
Dow Jones Industrial Mini (YM)
Nasdaq 100 E-Mini (NQ)
Platin (PL)
Palladium (PA)
Aluminium (AUP)
Steel ( HRC )
Ethanol (AEZ)
Brent Crude Oil (J26)
Rice (ZR)
Oat (ZO)
Milk (DL)
Orange Juice (JO)
Lumber (LS)
Feeder Cattle (GF)
S&P 500 ( SP )
Dow Jones Industrial Average Index (DJIA)
New Zealand Dollar (N6)
Deutsch:
Ein Bestandteil des "Commitment of Traders-Report" ist das Open Interest, das in diesem Indikator dargestellt wird (Quelle: Quandl Datenbank).
Anders als in meinem ebenfalls veröffentlichten Indikator "Open Interest-Buschi" werden hier nicht die absoluten Werte dargestellt, sondern in einem Ranking-System von 0 bis 100 mit individuellen Zeitrahmen.
Folgende Futures sind enthalten:
30-jährige US-Staatsanleihen (ZB)
10-jährige US-Staatsanleihen ( ZN )
Sojabohnen(ZS)
Sojabohnen-Mehl (ZM)
Sojabohnen-Öl (ZL)
Mais( ZC )
Soft Red Winter-Weizen (ZW)
Hard Red Winter-Weizen (KE)
Magerschweine (HE)
Lebendrinder ( LE )
Gold ( GC )
Silber (SI)
Kupfer(HG)
Rohöl ( CL )
Heizöl (HO)
Benzin ( RB )
Erdgas ( NG )
Australischer Dollar (A6)
Britisches Pfund (B6)
Kanadischer Dollar (D6)
Euro (E6)
Japanischer Yen (J6)
Schweizer Franken (S6)
Zucker ( SB )
Kaffee (KC)
Kakao ( CC )
Baumwolle ( CT )
S&P 500 E-Mini (ES)
Russell 2000 E-Mini (RTY)
Dow Jones Industrial Mini (YM)
Nasdaq 100 E-Mini (NQ)
Platin (PL)
Palladium (PA)
Aluminium (AUP)
Stahl ( HRC )
Ethanol (AEZ)
Brent Rohöl (J26)
Reis (ZR)
Hafer (ZO)
Milch (DL)
Orangensaft (JO)
Holz (LS)
Mastrinder (GF)
S&P 500 ( SP )
Dow Jones Industrial Average Index (DJIA)
Neuseeland Dollar (N6)

Open Interest-Buschi
English:
One part of the "Commitment of Traders-Report" is the Open Interest which is shown in this indicator (source: Quandl database).
The following futures are included:
30-year Bonds (ZB)
10-year Notes (ZN)
Soybeans (ZS)
Soybean Meal (ZM)
Soybean Oil (ZL)
Corn (ZC)
Soft Red Winter Wheat (ZW)
Hard Red Winter Wheat(KE)
Lean Hogs (HE)
Live Cattle (LE)
Gold (GC)
Silver (SI)
Copper (HG)
Crude Oil (CL)
Heating Oil (HO)
RBOB Gasoline (RB)
Natural Gas (NG)
Australian Dollar (A6)
British Pound (B6)
Canadian Dollar (D6)
Euro (E6)
Japanese Yen (J6)
Swiss Franc (S6)
Sugar (SB)
Coffee (KC)
Cocoa (CC)
Cotton (CT)
S&P 500 E-Mini (ES)
Russell 2000 E-Mini (RTY)
Dow Jones Industrial Mini (YM)
Nasdaq 100 E-Mini (NQ)
Platin (PL)
Palladium (PA)
Aluminium (AUP)
Steel (HRC)
Ethanol (AEZ)
Brent Crude Oil (J26)
Rice (ZR)
Oat (ZO)
Milk (DL)
Orange Juice (JO)
Lumber (LS)
Feeder Cattle (GF)
S&P 500 (SP)
Dow Jones Industrial Average Index (DJIA)
New Zealand Dollar (N6)
Deutsch:
Ein Bestandteil des "Commitment of Traders-Report" ist das Open Interest, das in diesem Indikator dargestellt wird (Quelle: Quandl Datenbank).
Folgende Futures sind enthalten:
30-jährige US-Staatsanleihen (ZB)
10-jährige US-Staatsanleihen (ZN)
Sojabohnen(ZS)
Sojabohnen-Mehl (ZM)
Sojabohnen-Öl (ZL)
Mais(ZC)
Soft Red Winter-Weizen (ZW)
Hard Red Winter-Weizen (KE)
Magerschweine (HE)
Lebendrinder (LE)
Gold (GC)
Silber (SI)
Kupfer(HG)
Rohöl (CL)
Heizöl (HO)
Benzin (RB)
Erdgas (NG)
Australischer Dollar (A6)
Britisches Pfund (B6)
Kanadischer Dollar (D6)
Euro (E6)
Japanischer Yen (J6)
Schweizer Franken (S6)
Zucker (SB)
Kaffee (KC)
Kakao (CC)
Baumwolle (CT)
S&P 500 E-Mini (ES)
Russell 2000 E-Mini (RTY)
Dow Jones Industrial Mini (YM)
Nasdaq 100 E-Mini (NQ)
Platin (PL)
Palladium (PA)
Aluminium (AUP)
Stahl (HRC)
Ethanol (AEZ)
Brent Rohöl (J26)
Reis (ZR)
Hafer (ZO)
Milch (DL)
Orangensaft (JO)
Holz (LS)
Mastrinder (GF)
S&P 500 (SP)
Dow Jones Industrial Average Index (DJIA)
Neuseeland Dollar (N6)

Reversal RadarReversal Radar
Unified exhaustion detection across 5 distinct reversal patterns — see confluence at a glance.
What It Does
Reversal Radar consolidates 5 independent reversal detection algorithms into a single indicator with a stacked diamond visualization. When any detector fires, you see a vertical stack of diamonds — colored diamonds show which specific patterns triggered, ghost (white) diamonds show which didn't.
More colored diamonds = stronger confluence = higher conviction setup.
The 5 Detectors
Diamond Detector What It Finds
🔴 Red Liquidity Trap Pivot reversal with wick rejection, liquidity sweep, and momentum trap (fading trapped traders)
🟠 Orange Structural Divergence Pivot at new extreme with RSI divergence against major structure
🔵 Light Blue Band Rejection Full candle body outside Bollinger Bands with rejection wick
🟢 Green Panic Snap 5-bar waterfall (consecutive lower lows) snapping back during VIX spike — Long only
🟣 Purple Capitulation Engulf Bullish engulfing at lower BB with steep band decline during elevated VIX — Long only
How To Read It
Long Signals (below bar): 5-diamond stack
• Bottom to top: Liquidity Trap → Structural Divergence → Band Rejection → Panic Snap → Capitulation Engulf
Short Signals (above bar): 3-diamond stack
• Bottom to top: Band Rejection → Structural Divergence → Liquidity Trap
Ghost diamonds (faded white) = that detector did NOT fire Colored diamonds = that detector fired
Colors are consistent between long and short — same detector = same color regardless of direction.
Key Features
• Confluence visualization — instantly see how many independent patterns agree
• No parameter tweaking — all detector settings are pre-tuned and hardcoded
• VIX-aware — the two "capitulation" detectors (Panic Snap, Capitulation Engulf) only fire during elevated VIX conditions
• Session filtering — built-in BOD/EOD blocking to avoid noisy open/close periods
• MTF Bias Table — optional multi-timeframe trend bias display (5m/15m/1H/4H/D)
• Detector Legend — on-chart reference showing what each color means (adjustable size and position)
• Bollinger Bands — optional BB overlay display
Settings
Module Toggles — Enable/disable each of the 5 detectors independently:
• Enable Liquidity Trap
• Enable Structural Divergence
• Enable Band Rejection
• Enable Panic Snap (Long Only)
• Enable Capitulation Engulf (Long Only)
Session Blocking — Define trading session and minutes to block at open/close
Display — Toggle Bollinger Bands, MTF Bias Table position
Legend — Toggle detector legend, adjust position and text size (tiny/small/normal)
Best Used For
• Identifying high-probability reversal zones where multiple exhaustion signatures align
• Filtering out weak signals (single detector) vs strong setups (2-3+ detectors)
• Spotting capitulation bottoms during VIX spikes (Panic Snap + Capitulation Engulf)
• Mean reversion plays at Bollinger Band extremes
Notes
• This indicator is designed for intraday reversal trading on liquid instruments (SPY, QQQ, ES, NQ, etc.)
• The VIX-gated detectors (Panic Snap, Capitulation Engulf) are long-only by design — they're specifically tuned for capitulation bottoms
• Works best on 3m-15m timeframes
• All detector parameters are locked to tested values — this is intentional to keep the indicator simple and consistent
"When multiple exhaustion patterns converge, the market is telling you something."

NY Session 15 min ORB + Fib RetracementThis indicator builds a New York session Opening Range (ORB) and plots Fibonacci retracement levels based on that range.
What it does
Defines the Opening Range using the NY cash open (default: 9:30–9:45 ET)
Tracks the ORB high and low during that window
Locks the ORB once the window ends (recommended)
Draws Fibonacci retracement levels from the ORB range
Optionally fills the space between fib levels
Displays price tags for ORB levels and fib levels on the right side
Sessions
ORB window is configurable (default: 9:30–9:45 ET)
Fib levels are only shown during the selected plot session
(default: 9:30–16:00 ET)
Nothing plots outside the selected fib session
Prevents lines from connecting across trading days
Fib behavior
Fibs are calculated from the ORB high and low
Direction can be:
High → Low (default)
Low → High
Common fib ratios are included by default:
0.236
0.382
0.500
0.618
0.786
All ratios are user-editable
Visuals
ORB High = green line
ORB Low = red line
Fib levels = gray lines
Optional shaded fill between fib levels
Optional right-side labels showing:
ORB High / Low price
Fib ratio and exact price
Recommended use
Designed for intraday trading
Best used on NY session instruments (ES, NQ, SPY, QQQ, etc.)
Works well on lower timeframes (1–15 min)
Locking the ORB at session end is recommended for consistency
Notes
Indicator does not generate trade signals
Levels are intended as reference only
Always use proper risk management

Buy / Sell Volume LabelsINDICATOR NAME:
Buy/Sell Volume Labels
DESCRIPTION:
Buy/Sell Volume Labels displays real-time buying and selling volume with dynamic color-coded labels that highlight market dominance. The indicator automatically emphasizes the dominant side (buy or sell) with bright green or red backgrounds, while the non-dominant side fades to gray for instant visual clarity.
Key Features:
- Dynamic Color Coding: Dominant volume side displays in bright green (buy) or red (sell), non-dominant side in gray
- Trend Indicator: Optional "Bullish Trend", "Bearish Trend", or "Neutral" label shows current market bias
- Flexible Display Options: Choose to show percentages only, volume only, or both
- Customizable Position: Place labels anywhere on chart (top, center, bottom; left, center, right)
- Adjustable Size: Six size options from Tiny to Huge, including Auto
- Lookback Period: Calculate volume for current bar or sum across multiple bars
- Neutral Threshold: Define when market is considered neutral vs. trending
How It Works:
- The indicator calculates buying and selling volume based on where price closes within each bar's range. When buying volume dominates, the Buy label turns bright green with black text while the Sell label turns gray. When selling dominates, the Sell label turns bright red with white text while the Buy label turns gray. This makes it immediately obvious which side controls the market.
Perfect For:
- Day traders and scalpers on futures (/MNQ, /ES, /NQ)
- Identifying accumulation vs. distribution phases
- Confirming trend strength and reversals
- Quick visual assessment of market pressure
- All timeframes from tick charts to daily
Settings:
- Header location (9 positions)
- Display mode (Volume, Percent- age, or Both)
- Table size (Tiny to Huge + Auto)
- Lookback period (bars)
- Trend label toggle
- Neutral threshold percentage
Created by NPR21 for the TradingView community.

MACD Signals with Impulse ScoresCustom indicator to generat buy sell signals. optimized for 5min NQ during RTH

15:50 AnticipeThis indicator is designed to anticipate the market behavior around a specific time of day (by default 15:50) by evaluating market conditions one minute before the target candle.
It is primarily intended for intraday trading on 1-minute charts, especially on index futures such as NQ / MNQ.
The logic combines trend, volatility compression, momentum, volume, and VWAP positioning, using a scoring system to determine whether a LONG, SHORT, or NEUTRAL bias is statistically favored before the target candle prints.
Core Concept
At the anticipation candle (15:49 by default), the indicator evaluates multiple technical conditions.
Each condition adds points to a LONG score or SHORT score.
If one side reaches the required score threshold and is stronger than the opposite side, a persistent signal is generated and held through the 15:50 candle.
The 15:50 candle is highlighted in yellow for visual reference.
Indicators Used
The system combines:
• Bollinger Bands to detect volatility compression
• EMA 9 / EMA 21 / EMA 89 for short-term and structural trend
• RSI for momentum confirmation
• Volume Spike Detection based on a volume SMA multiplier
• Anchored VWAP, reset daily and anchored at a configurable time
• Optional Reversal Mode for mean-reversion setups
Scoring Logic
Each side (LONG / SHORT) accumulates points based on conditions such as:
• Bollinger Band compression
• EMA 9 vs EMA 21 alignment
• Price location relative to EMA 9 and BB basis
• RSI above or below threshold
• Volume spike confirmation
• Price position relative to Anchored VWAP
If Reversal Mode is enabled, additional points are added when:
• Price touches or exceeds Bollinger extremes
• RSI divergence is detected
• Price deviates significantly from Anchored VWAP
Reversal conditions carry more weight, favoring exhaustion and snap-back setups.
Signal Generation
At the anticipation candle:
• LONG signal
Triggered when LONG score ≥ required threshold and stronger than SHORT score.
• SHORT signal
Triggered when SHORT score ≥ required threshold and stronger than LONG score.
• NEUTRAL signal
Displayed when neither side has a clear statistical edge.
Signals are displayed as labels above or below price, positioned dynamically using ATR to avoid candle overlap.
Once triggered, the signal remains active through the 15:50 candle and can be used for trade execution or confirmation.
Anchored VWAP
The Anchored VWAP:
• Resets automatically each trading day
• Starts calculating from a user-defined hour and minute
• Acts as a directional and mean-reversion reference
• Is fully integrated into both trend and reversal logic
Alerts
The indicator provides alert conditions for:
• Anticipated LONG setup
• Anticipated SHORT setup
• NEUTRAL condition
Alerts trigger when the anticipation signal becomes active, allowing automation or discretionary execution.
Intended Use
This indicator is best used as:
• A directional bias tool before a known time-based volatility event
• A confirmation layer, not a standalone entry system
• A way to structure disciplined trades instead of reacting emotionally to the 15:50 candle
It favors clarity, confluence, and probability, not prediction.

Aggressive ScalpingAggressive Scalping — EMA × RSI × VWAP × ADX Mesh-Up
Aggressive Scalping is a precision intraday indicator designed for range-to-early expansion environments, where most scalping strategies either over-trade or get chopped up.
This indicator intentionally meshes four complementary tools—EMA structure, RSI momentum, VWAP bias, and ADX regime detection—to isolate high-probability micro-moves while filtering out trend exhaustion and late entries.
The goal is simple:
trade only when price is aligned, momentum is controlled, and the market is quiet enough to move cleanly.
Why This Mesh-Up Exists
Most scalping indicators fail because they:
Trade every EMA cross
Ignore market regime
Chase overextended RSI
Enter against VWAP
This script solves that by assigning one clear job to each component:
1️⃣ EMA Structure (Fast vs Slow)
Defines short-term directional bias
Triggers precise entry timing
Provides clean crossover signals (▲ / ▼)
EMAs answer: Which side should I be on right now?
2️⃣ RSI Control (Not Overbought / Oversold)
Prevents chasing extended moves
Filters entries when momentum is already spent
Keeps scalps inside continuation windows
RSI answers: Is there still fuel left for a scalp?
3️⃣ VWAP Bias (Institutional Fair Value)
Aligns trades with institutional positioning
Blocks longs below VWAP and shorts above VWAP (optional)
Greatly reduces counter-trend noise
VWAP answers: Am I trading with or against the real money?
4️⃣ ADX Regime Filter (Range Detection)
Allows entries only when ADX is below a threshold
Avoids high-ADX trend exhaustion and fake pullbacks
Highlights scalp-friendly compression zones
ADX answers: Is the market calm enough to scalp?
How to Use the Signals
🔺 EMA Bullish Crossover (Green Triangle Up)
Fast EMA crosses above Slow EMA
Early directional shift
Can be used as:
Standalone momentum trigger
Confirmation for pullback entries
🔻 EMA Bearish Crossover (Red Triangle Down)
Fast EMA crosses below Slow EMA
Early downside signal
Ideal for quick downside scalps or fades
🟢 Long Entry Signal (Larger Green Triangle)
Triggers only when ALL conditions align:
EMA bullish structure
RSI not overbought
ADX below threshold (range mode)
Price above VWAP (if enabled)
🔴 Short Entry Signal (Larger Red Triangle)
Triggers only when:
EMA bearish structure
RSI not oversold
ADX below threshold
Price below VWAP (if enabled)
These are high-quality scalp entries, not constant signals.
Best Market Conditions
✔ Choppy to mildly trending sessions
✔ Open, mid-day, power hour rotations
✔ Large-cap & mega-cap stocks
✔ Index futures (ES, NQ)
✔ VWAP-respecting instruments
🚫 Not designed for:
Strong trend days
News-driven momentum explosions
Illiquid small caps
Final Notes
This indicator is not a prediction tool.
It is a structure-and-regime alignment tool.
Use it to:
Reduce over-trading
Improve entry precision
Trade fewer, cleaner setups
Stay aligned with market context
Pair it with:
Strict risk management
Session awareness
Price action confirmation

CandelaCharts - SMT 📝 Overview
The CandelaCharts – SMT indicator is a professional-grade Smart Money Technique (SMT) divergence detector designed to compare price action between correlated markets (intermarket analysis).
It identifies moments where the main chart makes a swing high or low while one or more comparison symbols fail to confirm the move—revealing potential institutional imbalance, distribution, or accumulation .
By automatically detecting pivot-based divergences and drawing clean, contextual lines and labels directly on price, SMT helps traders spot high-probability reversal or continuation zones driven by relative strength and weakness across markets.
📦 Features
Automatic SMT divergence detection – Identifies divergences between the main chart and up to two comparison symbols.
Pivot-based logic – Uses swing highs and swing lows to ensure structurally meaningful SMT signals.
Dual-symbol comparison – Compare the main market against one or two correlated instruments simultaneously.
Bullish & bearish SMT filtering – Show only bullish, bearish, or both divergence types.
Clear visual mapping – Divergence lines are drawn directly between pivots for intuitive price-context reading.
Smart labels – Compact labels display symbol(s), volume, and directional markers.
Detailed tooltips – Hover tooltips include divergence type, symbols involved, prices, volume, timestamps, and pivot settings.
Highly customizable visuals – Control colors, line width, and label styling.
⚙️ Settings
Lookback – Pivot lookback length used to detect swing highs and lows. Higher values produce fewer but more significant SMT signals.
Bias – Control which SMTs are displayed: Both, Bearish or Bullish
Swing High Color – Line and label color for SMT at swing highs.
Swing Low Color – Line and label color for SMT at swing lows.
Line Width – Thickness of SMT divergence lines.
Symbol 1 – Enable and select the first comparison instrument (e.g., NQ vs ES).
Symbol 2 – Enable and select the second comparison instrument (optional).
⚡️ Showcase
Bullish and Bearish SMTs
Bearish SMTs
Bullish SMTs
🚨 Alerts
This indicator does not include built-in alert conditions.
⚠️ Disclaimer
This indicator is provided for educational and informational purposes only and does not constitute financial or investment advice. Trading and investing involve substantial risk, and losses can exceed expectations. Past performance is not indicative of future results. You are solely responsible for your trading decisions. CandelaCharts assumes no liability for any outcomes resulting from the use of this indicator.

SA Range Rank NQ 1.13.2026 PM SESSION15 MINUTE — PREPARE / POSITION MODE
Developer Note: Bias & Position Framing
This daily view is preparatory, not executable.
The purpose of the Daily timeframe is to define directional bias, not entries.
It helps frame which side of the market deserves attention and which activity should be ignored.
The goal here is context, not action.
________________________________________
Purpose on Daily
The Daily timeframe is used to:
• Define directional bias for the week
• Prepare position-building zones
• Identify environments where participation is unnecessary or elevated-risk
• Reduce overtrading by narrowing focus
Daily charts answer one question only:
“If I participate this week, which side makes sense?”
________________________________________
What Matters Most (Public View)
SA Range Indicator (RI):
→ Is the market transitioning or trending?
→ Is energy building, releasing, or rotating?
SA ZoneEngine (visual context only):
→ Are daily moves aligned with higher-timeframe structure?
→ Is price operating with or against dominant bias?
These visuals explain environment, not decisions.
________________________________________
How to Interpret Public Daily Posts
• Daily is not timing
• Daily is not execution
• Daily is not a signal
Daily charts prepare the trader mentally and structurally by clarifying:
• what deserves patience
• what deserves caution
• what deserves no attention at all
________________________________________
Messaging Line
“Daily charts prepare the trade — they don’t execute it.”
________________________________________
SEO Intent
daily equity bias, position preparation, market structure analysis
________________________________________
🤝 For Those Who Find Value
If these daily posts help you see the market more clearly:
• Follow, boost, and share my scripts, Ideas, and MINDS posts
• Feel free to message me directly with questions or build requests
• Constructive feedback and collaboration are always welcome
For traders who want to go deeper, optional memberships may include:
• Additional signal access
• Early previews
• Occasional free tools and upgrades
🔗 Membership & Signals
trianchor.gumroad.com
________________________________________
________________________________________
⏱ 15-MIN — PREPARE / POSITION MODE
Developer Note: Setup Formation Phase
The 15-minute timeframe is where setups begin to form, not where they are acted on.
This view exists to separate developing structure from noise.
________________________________________
Purpose on 15-Minute
The 15-minute timeframe is used to:
• Spot trap-prone conditions
• Identify developing structure
• Observe compression, rotation, or early expansion
• Prepare for execution — without acting
This timeframe answers a different question:
“Is something forming — or is this noise?”
________________________________________
What Matters Most (Public View)
SA Range Indicator (RI):
→ Compression → expansion transitions
→ Energy buildup vs premature release
SA CloudRegimes (visual only):
→ Whether price behavior reflects continuation, pullback, or contraction
→ Whether movement is controlled or impulsive
These visuals describe behavior, not entries.
________________________________________
How to Interpret Public 15-Minute Posts
• 15m is setup formation
• 15m is environmental awareness
• 15m is not execution
Most errors occur when traders act before structure has finished forming.
This timeframe exists to slow that impulse down.
________________________________________
Messaging Line
“Preparation happens before the move — not during it.”
________________________________________
________________________________________
🤝 For Those Who Find Value
If these posts help you better recognize developing structure:
• Follow, boost, and share my scripts, Ideas, and MINDS posts
• Feel free to message me directly with questions or build requests
• Constructive feedback and collaboration are always welcome
For traders who want to go deeper, optional memberships may include:
• Additional signal access
• Early previews
• Occasional free tools and upgrades
🔗 Membership & Signals
trianchor.gumroad.com
15 Minute (15m) — Tactical Entry Alignment / “Permission + Timing”
Goal: Convert higher-timeframe permission into tradable timing.
How to use:
• Trade the first clean reclaim after a pullback.
• Avoid taking a reclaim if price is already extended far beyond the wake edge (late reclaim).
Best conditions:
• Works extremely well when:
o 1H agrees
o session structure is active (open/close windows)
o reclaim occurs near VWAP or a key level you already respect
Settings:
• dispMult 0.75–1.05
• reclaimWindow 6–14
• cooldown 3–6
🟠 15-MINUTE — Intraday Structure & Session Logic
1️⃣ Range Indicator (RI)
• Session compression → impulse likely
• Expansion → follow, don’t fade
Use:
Defines session behavior.
________________________________________
2️⃣ ZoneEngine (Structure)
• Filters session traps
• Explains failed breakouts
Use:
Keeps you aligned with real participation.
________________________________________
3️⃣ Cloud / Reclaim (Behavior)
• Identifies pullback vs continuation
• Reclaim confirms acceptance
Use:
Contextual confirmation.
________________________________________
4️⃣ Stop-Hunt Proxy
• Session liquidity sweeps
• Common near opens and transitions
Use:
Stop-hunt + compression = likely session impulse.

Synthetic Renko Overlay + Instant Expansion Alert✔ Builds Renko bricks internally
✔ Overlays them on ANY chart (3m recommended)
✔ Detects sudden aggressive brick growth
✔ Fires alert on the FIRST push
✔ Works for NQ / ES / BTC / any market

Statistical Probability Entry & ExitWHAT THIS INDICATOR WILL DO
This indicator will:
✅ Identify market direction
✅ Analyze the last 2–5 candles statistically
✅ Trigger BUY / SELL signals when continuation probability is high
✅ Trigger EXIT signals when probability collapses
✅ Be fast, made for 1-minute NQ trading
✅ Avoid laggy indicators (no RSI, MACD spam)
CORE LOGIC (HOW PROBABILITY IS ESTIMATED)
We estimate probability using conditional continuation logic:
Bullish continuation is likely when:
Price is above EMA (trend bias)
Last candles show:
Higher closes
Strong bodies (not wicks)
Volume expands in direction of move
Momentum doesn’t stall (no large opposite candle)
Same logic inverted for shorts.

Enhanced MTF Bias Table by Odegos# Enhanced MTF Bias Table - Publication Description
## Short Description (for TradingView listing)
Multi-timeframe bias indicator combining Market Structure Shifts (MSS) with EMA analysis. Displays real-time bias across 7 timeframes (5m-Weekly) with distance metrics and volatility measurements. Perfect for identifying trend alignment and potential reversal points.
---
## Full Description
### Overview
The **Enhanced MTF Bias Table** is a comprehensive multi-timeframe analysis tool designed to help traders quickly identify market bias across different time horizons. By combining Market Structure Shift (MSS) detection with Exponential Moving Average (EMA) analysis, this indicator provides a clear, color-coded view of market sentiment from short-term (5-minute) to long-term (weekly) timeframes.
### What This Indicator Does
**Core Functionality:**
- **Multi-Timeframe Analysis**: Simultaneously monitors 7 different timeframes (5m, 15m, 30m, 1h, 4h, Daily, Weekly)
- **Market Structure Detection**: Identifies when price breaks previous swing highs/lows, indicating potential trend changes
- **EMA-Based Bias**: Combines market structure with price distance from a customizable EMA to determine bias strength
- **Visual Market Structure Shifts**: Draws horizontal lines on the chart when significant market structure shifts occur
- **Real-Time Metrics**: Displays distance from EMA and ATR (volatility) for each timeframe
### How It Works
**Bias Calculation Logic:**
The indicator uses a sophisticated two-factor approach to determine market bias:
1. **Market Structure Analysis**:
- Tracks swing highs and lows using pivot points
- Identifies when price breaks above previous highs (bullish structure) or below previous lows (bearish structure)
- Uses a customizable lookback period to filter noise
2. **EMA Distance Analysis**:
- Measures how far price is from the selected EMA
- Strong bias requires BOTH structure break AND significant distance from EMA
- Neutral zone prevents false signals when price consolidates near the EMA
**Bias Categories:**
- **Strong ↑** (Dark Green): Bullish market structure + price above EMA threshold
- **Weak ↑** (Light Green): Bullish structure OR price moderately above EMA
- **Neutral** (Orange): Price within neutral zone around EMA
- **Weak ↓** (Light Red): Bearish structure OR price moderately below EMA
- **Strong ↓** (Dark Red): Bearish market structure + price below EMA threshold
### Key Features
**📊 Customizable Table Display:**
- Two table styles: Compact (minimal) or Full (detailed with labels)
- 9 position options to fit any chart layout
- Toggle distance from EMA and ATR displays
- Shows current symbol, timeframe, and date
**📈 Flexible Indicator Settings:**
- Adjustable EMA length (default: 50)
- Customizable MSS lookback period (5-50 bars)
- Breakout threshold adjustment for different instruments
- Neutral zone configuration to reduce noise
**📍 Visual Market Structure Shifts:**
- Draws horizontal lines at significant structure breaks
- Customizable colors for bullish/bearish MSS
- Optional text labels ("MSS") for easy identification
- Adjustable line width and style (solid, dashed, dotted)
**📉 EMA Overlay:**
- Optional EMA display on chart
- Full customization: color, width, line style
- Helps visualize the reference point for bias calculations
**🎨 Full Color Customization:**
- Independent color controls for all bias levels
- Customize header and table appearance
- Matches any chart theme or preference
### Best Use Cases
**1. Trend Alignment:**
Use the MTF table to identify when multiple timeframes align in the same direction. When 5-6 or more timeframes show the same bias, it indicates strong directional momentum.
**2. Divergence Detection:**
Look for disagreements between timeframes. For example, if higher timeframes (Daily/Weekly) show bearish bias while lower timeframes (5m/15m) show bullish bias, it may indicate a counter-trend bounce or potential reversal setup.
**3. Entry Timing:**
Use higher timeframe bias for direction and lower timeframe bias for entry timing. Enter trades when your trading timeframe aligns with higher timeframe bias.
**4. Risk Management:**
When lower timeframes show opposite bias to higher timeframes, it suggests trading against the major trend—requiring tighter stops and smaller positions.
**5. Market Structure Confirmation:**
The MSS lines help identify key levels where market structure changed, useful for:
- Stop loss placement (below/above MSS levels)
- Target setting (previous structure points)
- Breakout confirmation
### Recommended Settings by Instrument
**Index Futures:**
- **ES (S&P 500)**: Breakout Threshold: 0.15%, Neutral Zone: 0.15%
- **NQ (Nasdaq)**: Breakout Threshold: 0.25%, Neutral Zone: 0.20%
- **YM (Dow Jones)**: Breakout Threshold: 0.20%, Neutral Zone: 0.20%
**Forex Pairs:**
- **Major Pairs**: Breakout Threshold: 0.10%, Neutral Zone: 0.10%
- **Volatile Pairs**: Breakout Threshold: 0.20%, Neutral Zone: 0.15%
**Cryptocurrencies:**
- Breakout Threshold: 0.30-0.50%, Neutral Zone: 0.25-0.40%
- Higher volatility requires larger thresholds
### Understanding the Metrics
**Distance from EMA (%):**
- Positive values = Price above EMA (bullish territory)
- Negative values = Price below EMA (bearish territory)
- Larger absolute values = Stronger deviation from mean
- Useful for identifying overextended moves
**ATR (%):**
- Measures current volatility as percentage of price
- Higher values = More volatile conditions
- Helps adjust position sizing and stop distances
- Compare across timeframes to see where volatility concentrates
### Tips for Optimal Use
1. **Start with higher timeframes**: Check Daily and Weekly bias first to understand the bigger picture
2. **Use the 50 EMA default**: It's widely used and provides reliable support/resistance
3. **Adjust MSS lookback for your style**: Lower values (5-7) for day trading, higher values (15-25) for swing trading
4. **Watch for neutral zones**: Orange/neutral readings often precede significant moves
5. **Combine with price action**: Use MSS lines as reference points for entries and exits
6. **Don't ignore weak signals**: "Weak" bias often precedes strong moves as structure builds
### What Makes This Different
Unlike simple moving average indicators, this script:
- Combines TWO confirmation factors (structure + distance) for more reliable signals
- Provides context across multiple timeframes simultaneously
- Visually marks important market structure changes on your chart
- Offers both compact and detailed display modes
- Includes volatility measurement to gauge market conditions
### Technical Notes
- Uses `request.security()` to fetch data from multiple timeframes
- Implements `pivothigh()` and `pivotlow()` for swing detection
- All calculations use `lookahead=barmerge.lookahead_off` to prevent repainting
- MSS lines drawn in real-time as structure breaks occur
- Optimized for performance with minimal script resources
### Disclaimer
This indicator is a tool for analysis and does not provide trading signals or financial advice. Always:
- Use proper risk management
- Combine with other forms of analysis
- Test thoroughly in a demo environment
- Understand that past performance doesn't guarantee future results
- Consider market conditions and fundamental factors
---
## Tags (for TradingView)
multi-timeframe, market-structure, bias, trend, EMA, momentum, support-resistance, price-action, volatility, ATR, swing-trading, day-trading
## Category
Trend Analysis / Multi-Timeframe Analysis
---
## Quick Start Guide
**For Day Traders:**
1. Add indicator to your chart
2. Focus on 5m, 15m, 30m, and 1h timeframes
3. Look for alignment across these timeframes
4. Use MSS lines as entry/exit reference points
**For Swing Traders:**
1. Add indicator to your chart
2. Focus on 4h, Daily, and Weekly timeframes
3. Wait for 2-3 timeframe alignment
4. Use lower timeframes only for entry timing
**For Position Traders:**
1. Add indicator to your chart
2. Focus on Daily and Weekly timeframes
3. Ignore short-term noise
4. Enter when both show same strong bias

Aivance Opening Range & Vol FactorAivance Opening Range & Volume Factor
Overview
The Aivance Opening Range & Volume Factor is a comprehensive tool designed for Day Traders and Scalpers who rely on the "Opening Drive" or "Opening Range Breakout" (ORB) strategies.
The first candle of the trading session often sets the tone for the entire day. This indicator not only visualizes the price action of that critical first candle but also contextualizes the Volume to help you determine if there is enough institutional participation to sustain a trend.
Key Features
1. Opening Volume Factor
Unlike standard volume indicators, this tool calculates a specific Volume Factor for the opening candle:
Formula: (Volume of 1st Candle / Total Volume of Previous Day) * 100
Why it matters: A high Volume Factor (thresholds vary significantly depending on the chart timeframe and asset) suggests strong institutional interest immediately at the open. This often increases the probability of a sustained trend day rather than a choppy range day.
2. Automatic Session Detection
No manual time inputs are required.
The indicator uses time("D") to automatically detect the start of the trading day.
RTH vs. ETH: It adapts to your chart settings. If you use "Regular Trading Hours" (RTH), it marks the 09:30 NY open. If you use "Extended Trading Hours" (ETH), it marks the pre-market open.
3. Visual Opening Range
Box & Lines: Draws a box highlighting the High/Low and the Body (Open/Close) of the opening candle.
Extension: Extends support/resistance lines across the session to help identify breakouts or retests of the opening range later in the day.
4. Smart "Pullback" Logic (Optional)
This script includes a unique filter called "Show only on Pullback":
Default (False): The range is drawn immediately when the first candle closes.
Enabled (True): The range is hidden until the market prints a candle in the opposite direction of the opening move.
Strategy: This helps filter out impulsive moves and encourages trading the "retest" or the failure of the initial drive, rather than chasing the first tick.
How to Use
Trend Confirmation: Look for a breakout of the Opening Box combined with a high Volume Factor.
Support/Resistance: Use the extended gray lines (High/Low of the first candle) as key pivot points for stop-losses or entry targets.
Context: Compare the Volume Factor across different days to establish a baseline for your specific asset (e.g., what constitutes "High Volume" for NQ vs. ES vs. AAPL).
Settings
Colors: Fully customizable colors for Long (Bullish) and Short (Bearish) opening ranges.
Volume Factor: Toggle the text label on/off and adjust size/color.
Logic: Toggle the "Pullback" requirement on/off.
Disclaimer: This tool is for informational purposes only and does not constitute financial advice. Always manage your risk.

Orion Time Matrix | ICT Macros [by AK]ORION TIME MATRIX | ICT MACRO SUITE
The Orion Time Matrix is a precision timing instrument designed to decipher the algorithmic "Heartbeat" and the timing of institutional order flow in US Index Futures markets, specifically Nasdaq (NQ) and S&P 500 (ES).
Inspired by the "Time & Price" teachings of Michael J. Huddleston (The Inner Circle Trader), this tool maps out the specific time windows where algorithms seek liquidity and price delivery is most efficient.

Al Brooks_BarCount_Start from Opening🔹 Key Features
Counts from the RTH open every trading day
Stocks: 09:30–16:00 (New York Time)
Futures: 08:30–15:15 (Chicago Time)
Automatically detects stocks vs futures
Always displays the first bar of the session
Optional display every N bars to reduce chart clutter
Custom highlight rules
Highlight specific bar numbers (e.g. bar 18)
Highlight bar multiples (e.g. every 12 bars)
Fully customizable label size and colors
🔹 Why count from the open?
In Al Brooks’ Price Action framework:
The first 30–60 bars after the open often define the day’s structure
Trends, failed breakouts, and trading ranges frequently align with specific bar counts
Counting across overnight or pre-market sessions can distort intraday analysis
👉 This indicator resets precisely at the RTH open, keeping the count aligned with real trading decisions.
🔹 Inputs Overview
Display at every X bars
Show bar numbers at fixed intervals (bar 1 is always shown)
Count From RTH Open (Session Filter)
Limits counting strictly to regular trading hours (recommended ON)
Special Color Multiple
Highlights every N-th bar
Special Number 1 / 2
Highlights specific bar numbers
Label Size / Colors
Visual customization options
🔹 Markets Supported
✅ US index futures (ES, MES, NQ, MNQ, GC, CL – RTH)
✅ US stocks and indices (NYSE / NASDAQ)
❗ Not intended for 24h markets (e.g. crypto)
🔹 Usage Tips (Al Brooks Style)
Observe price behavior around early session bars (5–10)
Watch key counts like 12, 18, 24 for acceleration or failure
Combine with EMAs, trend lines, and trading-range highs/lows
