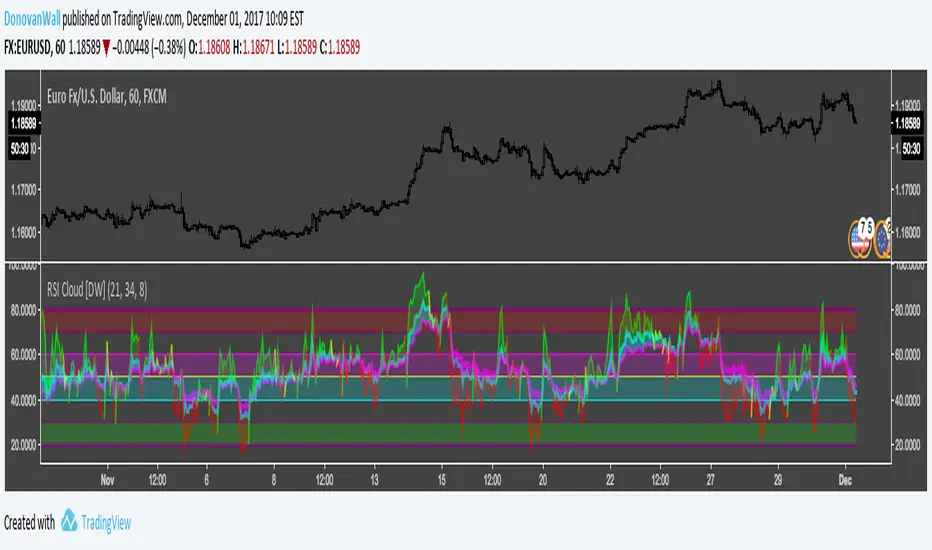
RSI Cloud [DW]This is a simple experimental study utilizing multiple RSIs and their divergences to visualize price activity.
ابحث في النصوص البرمجية عن "Rsi"
RSI/MFI with Volatility Bands [GVD]This is an edit of the LAzyBear script.
The script is adjusted to show both the RSI and the MFI on 1 chart.


RSI with small Take Profit - Long-onlyThis script open a long position when RSI < 30 and close the position after a small take profit. No stop loss but if you analyse List of Trades then you'll see that several position are closed for unknow reason.

RSI HistoAlert Strategy This simple indicator modified RSI
You can use in the xPrice any series: Open, High, Low, Close, HL2, HLC3, OHLC4 and ect...
You can change long to short in the Input Settings
Please, use it only for learning or paper trading. Do not for real trading.

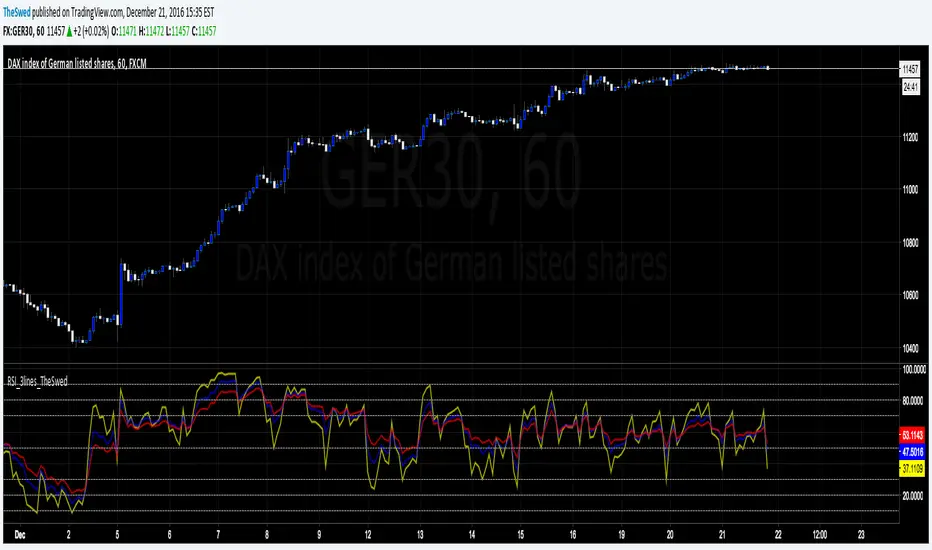
RSI_3lines_TheSwedRSI script with 3 lines. Also added lines: 90, 80, 20 and 10 to the script as I use this for trading.
RSI(2) Buy/Sell SignalLong/Short entry signaling based on extreme RSI-2 values. The modeling indicates this a good strategy. It's possible to improve profitability by using discretion to enter trades at a more optimal price (i.e. close of the signaled day rather than the open of the following day) and to let the trades run a little longer, but I have not been successful in scripting those scenarios.

RSI Oversold/UndersoldThe study script will place GREEN BUY arrows BELOW oversold conditions and RED SHORT arrows ABOVE overbought conditions. You can configure the period
Most RSI(14) indicators use a 14-period, I prefer a 5-period. The period, overbought and oversold periods are settings that can easily be changed by adding this study to your chart and clicking the "gear" icon next to the study inside your chart.

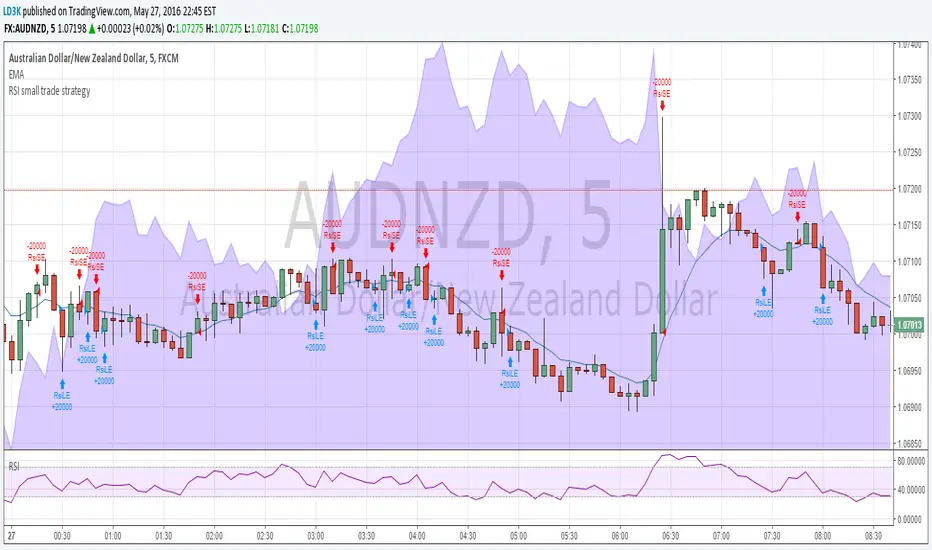
RSI small trade strategyTrialling a small gains strategy.
Unfortunately it caps out at 2000 trades otherwise I would be improving the maximum loss of stopping out trades once the RSI entered an overbought or oversold region
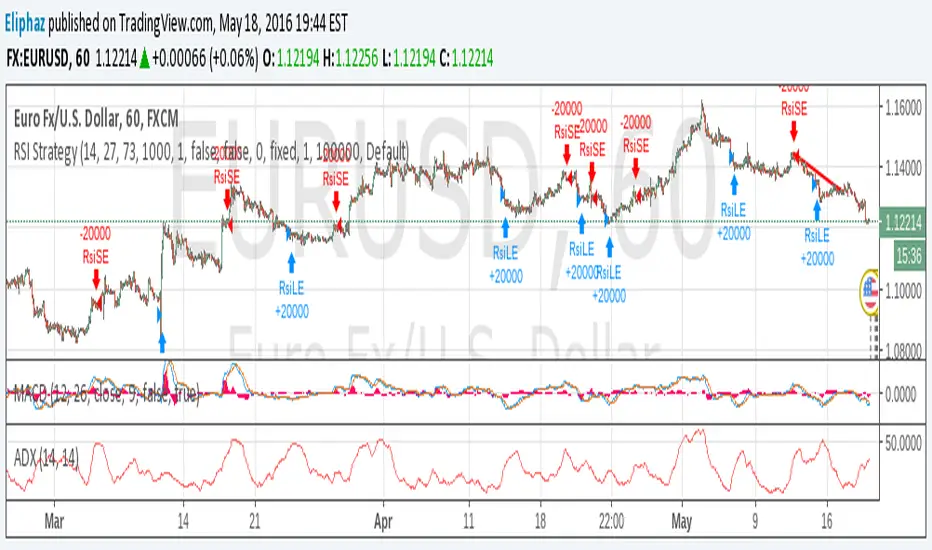
RSI Strategy EUR/USD 1H 700%A rsi strategy that has potential to do over 700% annually on the EURUSD 1h


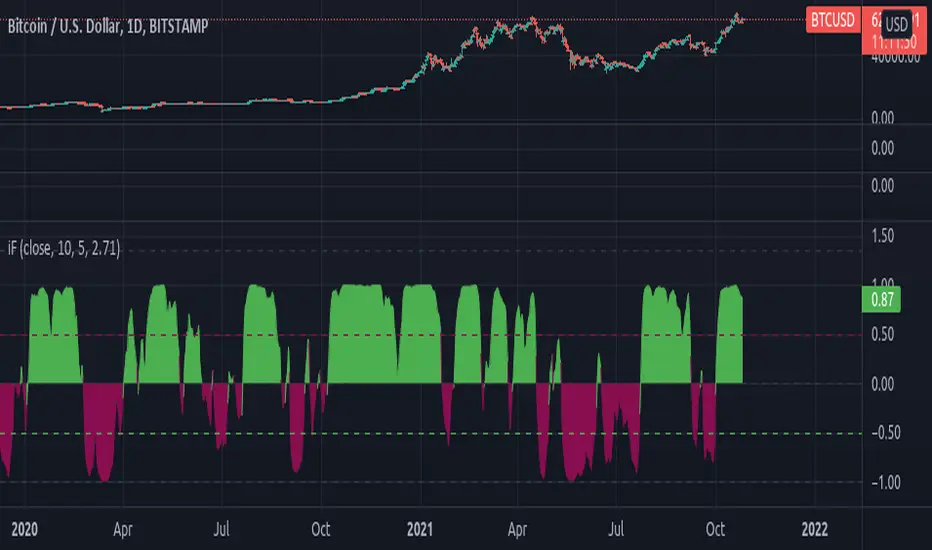
[RS]RSI Inverse Fisher Transform V1RSI inverse fisher transform (fishy turbo) as described here:
autotradingstrategy.wordpress.com
forexsb.com
update:
added color conditional.