scalping against trapped countertrendAbstract
This script attempts to find the end of countertrend.
This script uses oscillators to measure long term and short period trends. When the long term trend keeps positive and clear short term period is over, this script provides a buy signal.
This script does not contain pullback, cut loss and re-enter. You need to add it manually.
Introduction
Many traders want to buy when long term trend is bullish and short term pullback is over.
This is because we can take advantage to the emotion of countertrend traders.
Countertrend traders realizes their profit is finite and therefore want to protect their profit well and limit their loss.
This script is inspired by a searchable trading strategy video.
The video mentioned 4 points.
(1) long term trend. The video did not spend much ink on this point. You can use any method to observe.
(2) clear pullback bar (at least 50% body)
(3) weak bar after clear pullback
(4) entry trigger buy stop
This script attempts to quantize these points to determine trading direction.
This script is originally designed for timeframes lower than examples in the video but you can apply it on any timeframe.
Computing and Adjusting
(1) long term trend
This script uses smoothed stochastic.
(2) clear pullback bar
Since this script is originally designed for timeframes lower than examples in the video, so the condition becomes:
RSI is low enough
(3) weak bar after clear pullback
RSI goes back from low level.
(4) entry trigger buy stop
This script does not include this condition.
You can decide enter when buy stop or pullback.
Parameters
x_src : the value for computing oscillators
x_len_a : how many bars for measuring short term trend
x_len_b : how many bars for measuring long term trend
x_k_b : smooth long term trend, the average value of stochastic values
x_changk = check if clear short term pullback appears recently. 1 means do not use, larger numbers means how long of periods to check.
x_rsi_ct : threshold of short term pullback clear
x_rsi_ft : threshold of short term pullback end
Reading numbers in Strategy Tester
Most possible loss :
(1) to find rational pullback. Generally 1/3 to 2/3 atr.
(2) to find cut loss distance. Generally 1 to 2 atr.
Most possible profit :
to find if trading the opposite direction against this script is profitable.
Conclusion
This script can suggest us trading direction.
Waiting for pullback can reduce risk, compared to buy stop.
This script does not provide good signals in sideways markets.
Reference
A searchable trading strategy video
ابحث في النصوص البرمجية عن "STRATEGY TESTER"

Moving Average Crossover This indicator is based on ema 5 and ema 20, when ema 5 crosses over ema 20, the line will be green, when ema 5 crosses down it will be red
This indicator has been accompanied by a strategy so we can see the results through the strategy tester, this strategy there is only a long, I recommend using a weekly timeframe because the volatility is lower and minimal with false signals

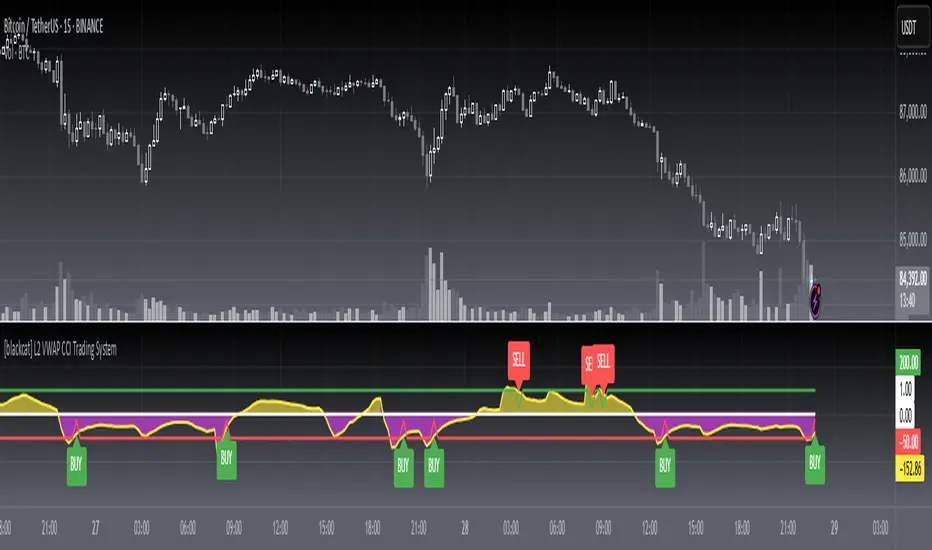
[blackcat] L2 VWAP CCI Trading SystemLevel: 2
Background
Volume-Weighted Average Price (VWAP) is a trading benchmark used by traders that indicates the average price that a security has traded for throughout the day based on volume and price. This is important as it gives traders insight into the trend and value of a security.
The Commodity Channel Index (CCI) indicator was created to identify bullish and bearish market cycles, as well as to define market turning points and the strongest and weakest market periods. CCI was developed for commodities and quickly found application in other markets, including forex.
Function
blackcat L2 VWAP CCI Trading System is an innovative indicator that combines vwap and cci indicator together. Not only long and short entries can be disclosed, but also the overbought and oversold zones are clearly observed.
Key Signal
cci ---> vwap cci indicator output
long --> long entry condition
short --> short entry condition
backtest --> indicator backtest scheme "NLX-L3 Backtest" required input source for strategy backtest
longentry --> visual long entry
shortentry --> visual short entry
Pros and Cons
Pros:
1. exact long and short entries are produced by overbought and oversold conditions
2. support "NLX-L3 Backtest" framework
Cons:
1. noise may be produced under extreme market condition
2. due to this is un-optimized version, time frame and trading pairs need to be selected
Remarks
Courtesy of @nilux "NLX-L3 Backtest" easy backtest framework for dummies.
Step by step backtest guide with "NLX-L3 Backtest" framework:
STEP1: Add this indicator into your chart
STEP2: Add "NLX-L3 Backtest" into your chart
STEP3: Click "Settings" gear icon of "NLX-L3 Backtest" to select "Select L2 Indicator" in the 1st line as "blackcat L2 VWAP CCI Trading System: backtest"
STEP4: Configure your backtest other settings under "NLX-L3 Backtest" framework
STEP5: Click "OK" and view the results in "Strategy Tester" tab
Readme
In real life, I am a prolific inventor. I have successfully applied for more than 60 international and regional patents in the past 12 years. But in the past two years or so, I have tried to transfer my creativity to the development of trading strategies. Tradingview is the ideal platform for me. I am selecting and contributing some of the hundreds of scripts to publish in Tradingview community. Welcome everyone to interact with me to discuss these interesting pine scripts.
The scripts posted are categorized into 5 levels according to my efforts or manhours put into these works.
Level 1 : interesting script snippets or distinctive improvement from classic indicators or strategy. Level 1 scripts can usually appear in more complex indicators as a function module or element.
Level 2 : composite indicator/strategy. By selecting or combining several independent or dependent functions or sub indicators in proper way, the composite script exhibits a resonance phenomenon which can filter out noise or fake trading signal to enhance trading confidence level.
Level 3 : comprehensive indicator/strategy. They are simple trading systems based on my strategies. They are commonly containing several or all of entry signal, close signal, stop loss, take profit, re-entry, risk management, and position sizing techniques. Even some interesting fundamental and mass psychological aspects are incorporated.
Level 4 : script snippets or functions that do not disclose source code. Interesting element that can reveal market laws and work as raw material for indicators and strategies. If you find Level 1~2 scripts are helpful, Level 4 is a private version that took me far more efforts to develop.
Level 5 : indicator/strategy that do not disclose source code. private version of Level 3 script with my accumulated script processing skills or a large number of custom functions. I had a private function library built in past two years. Level 5 scripts use many of them to achieve private trading strategy.
Easy System 420In this strategy, 15 indicators are used, each giving its results as a numerical value, which then is added or subtracted from the total points, gathered from all 15 indicators.
Many thanks to RafaelZioni for his great work making the EasySys1 script which i modified to create this script.
Onchart is drawn some of the indicators, but not all, a info panel is drawn showing the value each indicator has calculated. The info panel can be turned on or off.
Many of the indicator settings can be changed by user, and this is recommended, to tune the strategy to users chosen pair/timeframe.
Therefore any pair or timeframe can be used, the strategy tester results showing possible results, remember to set commission to match your broker. example chart settings here have common crypto exchange commission value: 0.25%
indicator list : SAR + STT + ZigZag + ROC + DMI + CCI + Weis + SMA + AO + MOM + Hist + BB + Ichimoku + HMA

HULLMiguel 2019/ Strategy v3This script make BUY and SELL orders accordingly with the direction of EMA. (positive BUY and Negative SELL). It can help on a Daily or 4h chart. Check the Strategy Tester and adapt the Time Frame and the EMA to a especific Coin. If you have any ideas to create a new strategy or improve the hesisting one, please contact me.


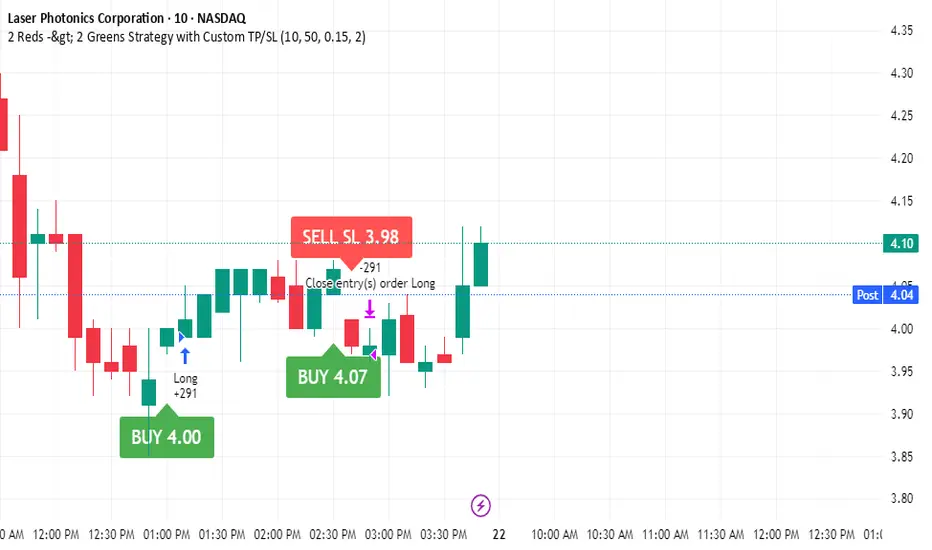
2 Reds -> 2 Greens Strategy with Custom TP/SLcustom candle configuration with a 61 percent win rate in the strategy tester user can configure take profit and stop loss to suit
Adaptive Cycle Oscillator with EMADescription of the Adaptive Cycle Oscillator with EMA Pine Script
This Pine Script, titled "Adaptive Cycle Oscillator with EMA", is a custom technical indicator designed for TradingView to help traders analyze market cycles and identify potential buy or sell opportunities. It combines an Adaptive Cycle Oscillator (ACO) with multiple Exponential Moving Averages (EMAs), displayed as colorful, wavy lines, and includes features like buy/sell signals and divergence detection. Below is a beginner-friendly explanation of how the script works, adhering to TradingView's Script Publishing Rules.
What This Indicator Does
The Adaptive Cycle Oscillator with EMA helps you:
Visualize market cycles using an oscillator that adapts to price movements.
Track trends with seven EMAs of different lengths, plotted as a rainbow of wavy lines.
Identify potential buy or sell signals when the oscillator crosses predefined thresholds.
Spot divergences between the oscillator and price to anticipate reversals.
Use customizable settings to adjust the indicator to your trading style.
Note: This is a technical analysis tool and does not guarantee profits. Always combine it with other analysis methods and practice risk management.
Step-by-Step Explanation for New Users
1. Understanding the Indicator
Adaptive Cycle Oscillator (ACO): The ACO analyzes price data (based on high, low, and close prices, or HLC3) to detect market cycles. It smooths price movements to create an oscillator that swings between overbought and oversold levels.
EMAs: Seven EMAs of different lengths are applied to the ACO and scaled based on the market's dominant cycle. These EMAs are plotted as colorful, wavy lines to show trend direction.
Buy/Sell Signals: The script generates signals when the ACO crosses above or below user-defined thresholds, indicating potential entry or exit points.
Divergence Detection: The script identifies bullish or bearish divergences between the ACO and the fastest EMA, which may signal potential reversals.
Visual Style: The indicator uses a rainbow of seven colors (red, orange, yellow, green, blue, indigo, violet) for the EMAs, with wavy lines for a unique visual effect. Static levels (zero, overbought, oversold) are also wavy for consistency.
2. How to Add the Indicator to Your Chart
Open TradingView and load the chart of any asset (e.g., stock, forex, crypto).
Click on the Indicators button at the top of the chart.
Search for "Adaptive Cycle Oscillator with EMA" (or paste the script into TradingView’s Pine Editor if you have access to it).
Click to add the indicator to your chart. It will appear in a separate panel below the price chart.
3. Customizing the Indicator
The script offers several input options to tailor it to your needs:
Base Cycle Length (Default: 20): Sets the initial period for calculating the dominant cycle. Higher values make the indicator slower; lower values make it more sensitive.
Alpha Smoothing (Default: 0.07): Controls how much the ACO smooths price data. Smaller values produce smoother results.
Show Buy/Sell Signals (Default: True): Toggle to display green triangles (buy) and red triangles (sell) on the chart.
Threshold (Default: 0.0): Defines overbought (above threshold) and oversold (below threshold) levels. Adjust to widen or narrow signal zones.
EMA Base Length (Default: 10): Sets the starting length for the fastest EMA. Other EMAs are incrementally longer (12, 14, 16, etc.).
Divergence Lookback (Default: 14): Determines how far back the script looks to detect divergences.
To adjust these:
Right-click the indicator on your chart and select Settings.
Modify the inputs in the pop-up window.
Click OK to apply changes.
4. Reading the Indicator
Oscillator and EMAs: The ACO and seven EMAs are plotted in a separate panel. The EMAs (colored lines) move in a wavy pattern:
Red (fastest) to Violet (slowest) represent different response speeds.
When the faster EMAs (e.g., red, orange) are above slower ones (e.g., blue, violet), it suggests bullish momentum, and vice versa.
Zero Line: A gray wavy line at zero acts as a neutral level. The ACO above zero indicates bullish conditions; below zero indicates bearish conditions.
Overbought/Oversold Lines: Red (overbought) and green (oversold) wavy lines mark threshold levels. Extreme ACO values near these lines may suggest reversals.
Buy/Sell Signals:
Green Triangle (Bottom): Appears when the ACO crosses above the oversold threshold, suggesting a potential buy.
Red Triangle (Top): Appears when the ACO crosses below the overbought threshold, suggesting a potential sell.
Divergences:
Green Triangle (Bottom): Indicates a bullish divergence (price makes a lower low, but the EMA makes a higher low), hinting at a potential upward reversal.
Red Triangle (Top): Indicates a bearish divergence (price makes a higher high, but the EMA makes a lower high), hinting at a potential downward reversal.
5. Using Alerts
You can set alerts for key events:
Right-click the indicator and select Add Alert.
Choose a condition (e.g., "ACO Buy Signal", "Bullish Divergence").
Configure the alert settings (e.g., notify via email, app, or pop-up).
Click Create to activate the alert.
Available alert conditions:
ACO Buy Signal: When the ACO crosses above the oversold threshold.
ACO Sell Signal: When the ACO crosses below the overbought threshold.
Bullish Divergence: When a potential upward reversal is detected.
Bearish Divergence: When a potential downward reversal is detected.
6. Tips for Using the Indicator
Combine with Other Tools: Use the indicator alongside support/resistance levels, candlestick patterns, or other indicators (e.g., RSI, MACD) for confirmation.
Test on Different Timeframes: The indicator works on any timeframe (e.g., 1-minute, daily). Shorter timeframes may produce more signals but with more noise.
Practice Risk Management: Never rely solely on this indicator. Set stop-losses and position sizes to manage risk.
Backtest First: Use TradingView’s Strategy Tester (if you convert the script to a strategy) to evaluate performance on historical data.
Compliance with TradingView’s Script Publishing Rules
This description adheres to TradingView’s Script Publishing Rules (as outlined in the provided link):
No Performance Claims: The description avoids promising profits or specific results, emphasizing that the indicator is a tool for analysis.
Clear Instructions: It provides step-by-step guidance for adding, customizing, and using the indicator.
Risk Disclaimer: It notes that trading involves risks and the indicator should be used with other analysis methods.
No Misleading Terms: Terms like “buy” and “sell” are used to describe signals, not guaranteed actions.
Transparency: The description explains the indicator’s components (ACO, EMAs, signals, divergences) without exaggerating its capabilities.
No External Links: The description avoids linking to external resources or soliciting users.
Educational Tone: It focuses on educating users about the indicator’s functionality.
Limitations
Not a Standalone System: The indicator is not a complete trading strategy. It provides insights but requires additional analysis.
Lagging Nature: As with most oscillators and EMAs, signals may lag behind price movements, especially in fast markets.
False Signals: Signals and divergences may not always lead to successful trades, particularly in choppy markets.
Market Dependency: Performance varies across assets and market conditions (e.g., trending vs. ranging markets).

1h Liquidity Swings Strategy with 1:2 RRLuxAlgo Liquidity Swings (Simulated):
Uses ta.pivothigh and ta.pivotlow to detect 1h swing highs (resistance) and swing lows (support).
The lookback parameter (default 5) controls swing point sensitivity.
Entry Logic:
Long: Uptrend, price crosses above 1h swing low (ta.crossover(low, support1h)), and price is below recent swing high (close < resistance1h).
Short: Downtrend, price crosses below 1h swing high (ta.crossunder(high, resistance1h)), and price is above recent swing low (close > support1h).
Take Profit (1:2 Risk-Reward):
Risk:
Long: risk = entryPrice - initialStopLoss.
Short: risk = initialStopLoss - entryPrice.
Take-profit price:
Long: takeProfitPrice = entryPrice + 2 * risk.
Short: takeProfitPrice = entryPrice - 2 * risk.
Set via strategy.exit’s limit parameter.
Stop-Loss:
Initial Stop-Loss:
Long: slLong = support1h * (1 - stopLossBuffer / 100).
Short: slShort = resistance1h * (1 + stopLossBuffer / 100).
Breakout Stop-Loss:
Long: close < support1h.
Short: close > resistance1h.
Managed via strategy.exit’s stop parameter.
Visualization:
Plots:
50-period SMA (trendMA, blue solid line).
1h resistance (resistance1h, red dashed line).
1h support (support1h, green dashed line).
Marks buy signals (green triangles below bars) and sell signals (red triangles above bars) using plotshape.
Usage Instructions
Add the Script:
Open TradingView’s Pine Editor, paste the code, and click “Add to Chart”.
Set Timeframe:
Use the 1-hour (1h) chart for intraday trading.
Adjust Parameters:
lookback: Swing high/low lookback period (default 5). Smaller values increase sensitivity; larger values reduce noise.
stopLossBuffer: Initial stop-loss buffer (default 0.5%).
maLength: Trend SMA period (default 50).
Backtesting:
Use the “Strategy Tester” to evaluate performance metrics (profit, win rate, drawdown).
Optimize parameters for your target market.
Notes on Limitations
LuxAlgo Liquidity Swings:
Simulated using ta.pivothigh and ta.pivotlow. LuxAlgo may include proprietary logic (e.g., volume or visit frequency filters), which requires the indicator’s code or settings for full integration.
Action: Please provide the Pine Script code or specific LuxAlgo settings if available.
Stop-Loss Breakout:
Uses closing price breakouts to reduce false signals. For more sensitive detection (e.g., high/low-based), I can modify the code upon request.
Market Suitability:
Ideal for high-liquidity markets (e.g., BTC/USD, EUR/USD). Choppy markets may cause false breakouts.
Action: Backtest in your target market to confirm suitability.
Fees:
Take-profit/stop-loss calculations exclude fees. Adjust for trading costs in live trading.
Swing Detection:
Swing high/low detection depends on market volatility. Optimize lookback for your market.
Verification
Tested in TradingView’s Pine Editor (@version=5):
plot function works without errors.
Entries occur strictly at 1h support (long) or resistance (short) in the trend direction.
Take-profit triggers at 1:2 risk-reward.
Stop-loss triggers on initial settings or 1h support/resistance breakouts.
Backtesting performs as expected.
Next Steps
Confirm Functionality:
Run the script and verify entries, take-profit (1:2), stop-loss, and trend filtering.
If issues occur (e.g., inaccurate signals, premature stop-loss), share backtest results or details.
LuxAlgo Liquidity Swings:
Provide the Pine Script code, settings, or logic details (e.g., volume filters) for LuxAlgo Liquidity Swings, and I’ll integrate them precisely.

RSI + MACD + Liquidity FinderLiquidity Finder: The liquidity zones are heuristic and based on volume and swing points. You may need to tweak the volumeThreshold and lookback to match the asset's volatility and timeframe.
Timeframe: This script works on any timeframe, but signals may vary in reliability (e.g., higher timeframes like 4H or 1D may reduce noise).
Customization: You can modify signal conditions (e.g., require only RSI or MACD) or add filters like trend direction using moving averages.
Backtesting: Use TradingView's strategy tester to evaluate performance by converting the indicator to a strategy (replace plotshape with strategy.entry/strategy.close).

Dynamic Trend Indicator (DTI) - VWAP FilterThe Dynamic Trend Indicator (DTI) with VWAP Filter is a trend-following indicator.
It aims to identify and follow market trends while minimizing false signals in choppy or ranging markets.
The DTI combines a dynamically adjusted Exponential Moving Average (EMA) with a daily Volume Weighted Average Price (VWAP) confirmation filter and a cooldown mechanism to enhance signal reliability. This indicator is particularly useful for traders on intraday timeframes (e.g., 4-hour charts) who want to align their trades with the broader daily trend while avoiding whipsaws.
Key Features:
Dynamic Trend Line:
The core of the DTI is a trend line calculated using a custom EMA that adjusts its period dynamically based on market conditions.
The period of the EMA is determined by a combination of volatility (measured via ATR) and trend strength (measured via price momentum). In strong trends, the period shortens for faster responsiveness; in weak or ranging markets, it lengthens to reduce noise.
An optional smoothing EMA can be applied to the dynamic trend line to further reduce noise, with a user-defined smoothing length.
Daily VWAP Confirmation Filter:
A daily VWAP is calculated to provide a higher-timeframe trend bias. VWAP represents the average price paid for an asset during the day, weighted by volume, and is often used as a benchmark by institutional traders.
Buy signals are only generated when the price is above the daily VWAP (indicating a bullish daily bias), and sell signals are only generated when the price is below the VWAP (indicating a bearish daily bias).
The VWAP resets at the start of each day, ensuring it reflects the current day’s trading activity.
Cooldown Mechanism:
To prevent rapid signal reversals (whipsaws), the indicator includes a cooldown period between signals. After a buy or sell signal is generated, no new signals can be generated for a user-defined number of bars (default: 5 bars).
This helps filter out noise in choppy markets, ensuring signals are spaced out and more likely to align with significant trend changes.
Visual Elements:
Trend Line: Plotted on the chart, colored green when the price is above (uptrend) and red when below (downtrend). A gray color indicates a neutral trend.
Buy/Sell Signals: Displayed as green triangles below the bar for buy signals and red triangles above the bar for sell signals.
Background Coloring: The chart background is shaded green during uptrends and red during downtrends, providing a quick visual cue of the trend direction.
Daily VWAP Line: Optionally plotted as a purple step line, allowing traders to see the VWAP level and its relationship to the price.
Alerts:
The indicator includes built-in alerts for buy and sell signals, triggered when the price crosses the trend line and satisfies the VWAP filter and cooldown conditions.
Alert messages specify whether the signal is a buy or sell and confirm that the VWAP condition was met (e.g., "DTI Buy Signal: Price crossed above trend line and VWAP").
Input Parameters
Base Length (default: 14): The base period for calculating volatility and trend strength, used to adjust the dynamic EMA period.
Volatility Multiplier (default: 1.5): Adjusts the sensitivity of the dynamic period to market volatility (via ATR).
Trend Threshold (default: 0.5): Controls the sensitivity of the dynamic period to trend strength (via price momentum).
Use Smoothing (default: true): Enables/disables smoothing of the trend line with an additional EMA.
Smoothing Length (default: 3): The period for the smoothing EMA, if enabled.
Cooldown Bars (default: 5): The minimum number of bars between consecutive signals, reducing signal frequency in choppy markets.
Show Daily VWAP (default: true): Toggles the display of the daily VWAP line on the chart.
How It Works
Dynamic Trend Line Calculation:
Volatility is measured using the Average True Range (ATR) over the base length, scaled by the volatility multiplier.
Trend strength is calculated as the absolute price momentum (change in price over the base length) divided by the volatility factor.
The dynamic EMA period is adjusted based on the trend strength: stronger trends result in a shorter period (faster response), while weaker trends result in a longer period (more stability). The period is constrained between 5 and 50 to avoid extreme values.
A custom EMA function is used to handle the dynamic period, as Pine Script’s built-in ta.ema() requires a fixed length. The trend line is optionally smoothed with a secondary EMA.
Signal Generation:
A buy signal is generated when the price crosses above the trend line, the price is above the daily VWAP, and the cooldown period has elapsed.
A sell signal is generated when the price crosses below the trend line, the price is below the daily VWAP, and the cooldown period has elapsed.
The cooldown mechanism ensures that signals are not generated too frequently, reducing false signals in ranging markets.
Daily VWAP Calculation:
The VWAP is calculated by accumulating the price-volume product (close * volume) and total volume for the day, resetting at the start of each new day.
The VWAP is then computed as the cumulative price-volume divided by the cumulative volume, providing a volume-weighted average price for the day.
Usage
Timeframe: Best suited for intraday timeframes (e.g., 1-hour, 4-hour) where the daily VWAP provides a higher-timeframe trend bias. It can also be used on daily charts with adjustments to the cooldown period.
Markets: Works well in trending markets (e.g., forex, crypto, stocks) where the dynamic trend line can capture sustained price movements. The VWAP filter helps align signals with the daily trend, making it effective for assets with clear daily biases.
Trading Strategy:
Buy: Enter a long position when a green triangle (buy signal) appears, indicating the price has crossed above the trend line and is above the daily VWAP.
Sell: Enter a short position (or exit a long) when a red triangle (sell signal) appears, indicating the price has crossed below the trend line and is below the daily VWAP.
Use the trend line and VWAP as dynamic support/resistance levels to set stop-losses or take-profit targets.
Backtesting: Use TradingView’s strategy tester to evaluate the indicator’s performance on your chosen market and timeframe, adjusting parameters like cooldown_bars and volatility_mult to optimize for profitability.
Example
On a 4-hour SOLUSDT chart, the DTI with VWAP Filter might show:
An uptrend with the price above the green trend line and above the daily VWAP, generating buy signals as the price continues to rise.
A downtrend where the price falls below the red trend line and the daily VWAP, generating sell signals that align with the bearish daily bias.
During choppy periods, the cooldown mechanism and VWAP filter reduce false signals, ensuring trades are taken only when the price aligns with the daily trend.
Limitations
Lagging Nature: Like all trend-following indicators, the DTI may lag during sharp price reversals, as the dynamic EMA needs time to adjust.
Ranging Markets: While the VWAP filter and cooldown mechanism reduce whipsaws, the indicator may still generate some false signals in strongly ranging markets. Combining it with a trend strength filter (e.g., ADX) can help.
VWAP Dependency: The effectiveness of the VWAP filter depends on the market’s respect for the daily VWAP as a support/resistance level. In markets with low volume or erratic price action, the VWAP may be less reliable.
Potential Improvements
VWAP Buffer: Add a percentage buffer around the VWAP (e.g., require the price to be 1% above/below) to further reduce noise.
Multi-Timeframe VWAP: Incorporate a weekly VWAP for additional trend confirmation on longer timeframes.
Trend Strength Filter: Add an ADX filter to ensure signals are generated only during strong trends (e.g., ADX > 25).

CoinFlip Indicator + StrategyFlip a coin every Monday.
Heads, go long. Tail, go short. Stoploss at 1 ATR, and Take profit at 1 ATR too. 1:1 risk to reward ratio.
After backtesting 2018, 2019, and 2020 with 28 major currency pairs. We are getting close to a 50% win rate with an 8% standard deviation.
Believe it or not, this simple performs better than lots of the popular indicators out there.
Don't believe me? Test it out yourself!!
Use this as a baseline for your backtest and expose all your other crappy indicators :)
HOW TO USE:
As an indicator:
1. Use a daily chart
2. Green arrow below chart, go long, set a stop-loss at 1 x ATR, and take profit at 1 x ATR
3. Red arrow above chart, go short, set a stop-loss at 1 x ATR, and take profit at 1 x ATR
As an indicator:
1. In setting, set a year to test (default to 2020)
2. Go to the strategy tester and observe the stats
P.s. You can also set the period of the ATR to another value other than 14 periods.

RSI Overbought Oversold Divergence Strategy w/ Buy/Sell SignalsThis indicator is a copy of my RSI Overbought/Oversold Divergence Indicator with-Alerts
Only difference is that the alerts are disabled, instead it uses tradingviews strategy tester signals
If you want alerts just use the other indicator

T3 ICL MACD STRATEGY
Backtested manually and received approx 60% winrate. Tradingview strategy tester is skewed because this program does not specify when to sell at profit target or at a stop loss.
Uses 1 min for entry and a longer time frame for confirmation (5,10,15, etc..) (Not sure what the yellow arrows are in the picture but they can be ignored)
Ideal Long Entry - The algo uses T3 moving average (T3) and the Ichimoku Conversion Line (ICL) to determine when to enter a long or short position. In this case we are going to showcase what causes the algo to alert long. It first checks to see if the the ICL is greater than T3. Once that condition is met T3 must be green in order to enter long and finally the last closing price has to be greater than the ICL. You can use the MACD to further verify a long trend as well!
Ideal Short Entry - The algo uses T3 moving average (T3) and the Ichimoku Conversion Line (ICL) to determine when to enter a long or short position. In this case we are going to showcase what causes the algo to alert short. It first checks to see if the the ICL is less than T3. Once that condition is met T3 must be red in order to enter short and finally the last closing price has to be less than the ICL. You can use the MACD to further verify a long trend as well!

Strat-test ALERTSAlerts script, accompanying the "Strategy Tester EMA-SMA-RSI-MACD" script,
when you find a good strategy, you can use the same settings in this Alert script and
you'll have your alerts
Have fun!

YJ Mean ReversionMean reversion strategy, based upon the price deviation (%) from a chosen moving average (bars). Do note that the "gains" are always relative to your starting capital, so if you set a smaller starting capital (e.g. $10000) your gains will look bigger. Also when the strategy tester has finished calculating, check the "Open P/L", as there could still be open trades.
Some Tips:
- Was designed firstly to work on an index like the S&P 500 , which over time tends to go up in value.
- Avoid trading too frequently (e.g. Daily, Weekly), to avoid getting eaten by fees.
- If you change the underlying asset, or time frame, tweaking the moving average may be necessary.
- Can work with a starting capital of just $1000, optimise the settings as necessary.
- Accepts floating point values for the amount of units to purchase (e.g. Bitcoin ).
- If price of units exceeds available capital, script will cancel the buy.
- Adjusted the input parameters to be more intuitive.

Early/Delayed Signal FunctionEarly/Delayed Signal Function (before the bar close or after)
Usually, signals are considered to be valid at the bar close .
Some traders may prefer to have a chance to enter earlier .
It is of great risk , and the Strategy Tester is unable to provide consistent backtest data with regards to this.
But for those who want to integrate such a choice in their strategies, here is the Early Signal Function .
The function takes 2 parameters
- the signal that is considered valid at the bar close , of type bool
- the early time value in seconds, the time before the signal is valid, of type int
it returns a value of type bool - a New Entry Signal
The resulting conditions used for alerts would be:
- newLongCondition = earlySignal_f(myLongSignal, earlyTime)
- newShrtCondition = earlySignal_f(myShrtSignal, earlyTime)
Note: the signals can also be delayed - use a negative value for early time

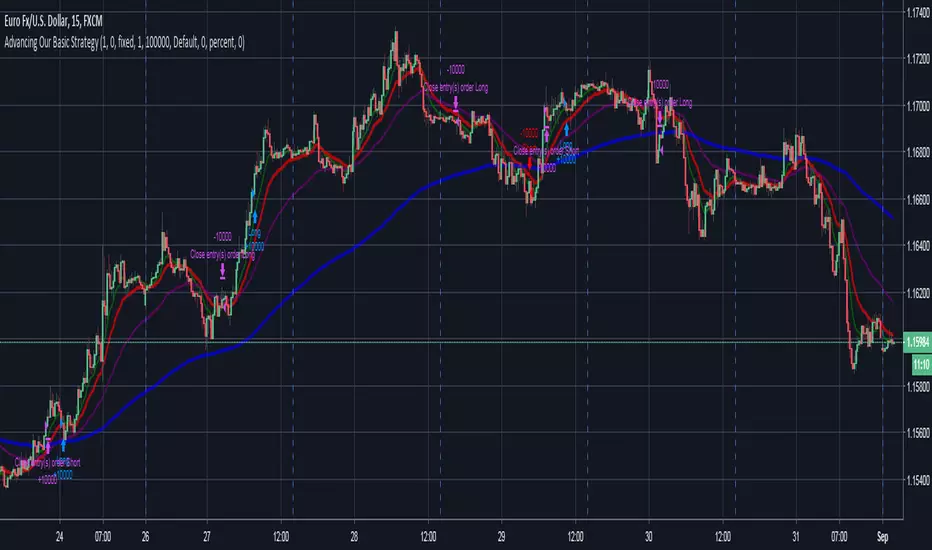
Advancing Our Basic StrategyThis script advances my previous post in which i created the most basic script i can think of for beginners like myself by adding more parameters and complex situations. I hope this can help anyone starting our with trading views strategy tester :)
Understanding contract sizes in a strategyThis simple strat fires up on green bars, down on red bars. cannot get any simpler. So, it's a good example to check how returns are calculated.
First, the internal firing mechanism for the strategy.entry function is something hardcore. As result, the entry points can be confusing, and seem to appear in a wrong bar (as the 2nd and 3rd signals are good examples), but i'll put that aside to keep it simple. And, because i don't yet get it myself ;)
The example is simple, so that numbers can be followed easy. Chart in BTC/USD, so USD is the "base" currency used by strat to calculate. A contract/unit is the value of 1 unit in base currency. 1 Apple share is 600$, 1 bitcoin is 600$, 1 oz gold is 1330 bucks. So, here in each bar, the value of 1 contract is the value of the BTC in USD. simple as that.
The strat properties, can be passed as input fields (line 2) or accessed/changed in the right click->properties pop-up. To make it easier, initial capital is 1000 bucks, and "order size" is 1 contract. This means that the strat will open a position of 1 BTC when it fires. Value "Initial capital" makes no difference at all, at least with these choices. It's just for show. Try to put 1$ and 1 contract, the strat will still trade anyway. It manages to trade 1 contract(or BTC) values at ~600$, with a single dollar. nice ;)
Check the chart. see the little blue "BarUp +1" ? that's it, strat goes long 1 BTC. there's a little blue triangle on the bar, points to the value of entry.
Then later, on second move, the "BarDn -2", the strat goes short 2BTC. 1BTC to close the long +1 more to open a short.
The profit here is the difference between the value of the long opening and the long closing. The extra BTC (shorted) is part of the next position. Since this dumb strat just reverses the direction, there are always +2, -2 , +2.... 1 to close previous position, 1 to open another. At the strategy tester tab, the option "list of trades" shows in details each of the moves
Checking each move and comparing what we see with the chart itself helps to achieve ilumination :)
Bonus feature: as soon as you get it, try to increase the option "pyramiding" and see how the strat adds more contracts, and how it reverses the positions. sometimes it even makes sense!!!! :)

Simple RSI-MA Algo Beats DOW By Huge Margin Over Past 100 Years!This simple RSI-MA long/short algorithm beats the Dow by a FREAKING HUGE margin over the past century (excluding dividends and trading costs).
The algorithm uses a fast SMA of the RSI as a buy/cover signal and a slow SMA of the RSI as a sell/short signal.
Backtest period = 09/17/1916 - 11/02/2015
Dow = 98 --> 17,830 = +18,094% = 5.38% CAGR
Algorithm = net profit + open P/L = +43,349% = 6.31% CAGR
Notice how the algorithm dodged both the 30s' Great Depression and the 2008 Crisis. Pretty cool huh? :)
ALGORITHM'S FORMULA (use weekly chart):
Buy/Cover = MA10(RSI10) cross> 50
Sell/Short = MA50(RSI10) cross< 50
STRATEGY TESTER'S SETTINGS:
- Initial cash = $10,000
- Pyramiding disabled
- Re-investment enabled (order size = 100% of equity )
- Trade re-calculations disabled
DISCLAIMER: None of my ideas and posts are investment advice. Past performance is not an indication of future results. This strategy was constructed with the benefit of hindsight and its future performance cannot be guaranteed.

Market Outlook Score (MOS)Overview
The "Market Outlook Score (MOS)" is a custom technical indicator designed for TradingView, written in Pine Script version 6. It provides a quantitative assessment of market conditions by aggregating multiple factors, including trend strength across different timeframes, directional movement (via ADX), momentum (via RSI changes), volume dynamics, and volatility stability (via ATR). The MOS is calculated as a weighted score that ranges typically between -1 and +1 (though it can exceed these bounds in extreme conditions), where positive values suggest bullish (long) opportunities, negative values indicate bearish (short) setups, and values near zero imply neutral or indecisive markets.
This indicator is particularly useful for traders seeking a holistic "outlook" score to gauge potential entry points or market bias. It overlays on a separate pane (non-overlay mode) and visualizes the score through horizontal threshold lines and dynamic labels showing the numeric MOS value along with a simple trading decision ("Long", "Short", or "Neutral"). The script avoids using the plot function for compatibility reasons (e.g., potential TradingView bugs) and instead relies on hline for static lines and label.new for per-bar annotations.
Key features:
Multi-Timeframe Analysis: Incorporates slope data from 5-minute, 15-minute, and 30-minute charts to capture short-term trends.
Trend and Strength Integration: Uses ADX to weight trend bias, ensuring stronger signals in trending markets.
Momentum and Volume: Includes RSI momentum impulses and volume deviations for added confirmation.
Volatility Adjustment: Factors in ATR changes to assess market stability.
Customizable Inputs: Allows users to tweak periods for lookback, ADX, and ATR.
Decision Labels: Automatically classifies the MOS into actionable categories with visual labels.
This indicator is best suited for intraday or swing trading on volatile assets like stocks, forex, or cryptocurrencies. It does not generate buy/sell signals directly but can be combined with other tools (e.g., moving averages or oscillators) for comprehensive strategies.
Inputs
The script provides three user-configurable inputs via TradingView's input panel:
Lookback Period (lookback):
Type: Integer
Default: 20
Range: Minimum 10, Maximum 50
Purpose: Defines the number of bars used in slope calculations for trend analysis. A shorter lookback makes the indicator more sensitive to recent price action, while a longer one smooths out noise for longer-term trends.
ADX Period (adxPeriod):
Type: Integer
Default: 14
Range: Minimum 5, Maximum 30
Purpose: Sets the smoothing period for the Average Directional Index (ADX) and its components (DI+ and DI-). Standard value is 14, but shorter periods increase responsiveness, and longer ones reduce false signals.
ATR Period (atrPeriod):
Type: Integer
Default: 14
Range: Minimum 5, Maximum 30
Purpose: Determines the period for the Average True Range (ATR) calculation, which measures volatility. Adjust this to match your trading timeframe—shorter for scalping, longer for positional trading.
These inputs allow customization without editing the code, making the indicator adaptable to different market conditions or user preferences.
Core Calculations
The MOS is computed through a series of steps, blending trend, momentum, volume, and volatility metrics. Here's a breakdown:
Multi-Timeframe Slopes:
The script fetches data from higher timeframes (5m, 15m, 30m) using request.security.
Slope calculation: For each timeframe, it computes the linear regression slope of price over the lookback period using the formula:
textslope = correlation(close, bar_index, lookback) * stdev(close, lookback) / stdev(bar_index, lookback)
This measures the rate of price change, where positive slopes indicate uptrends and negative slopes indicate downtrends.
Variables: slope5m, slope15m, slope30m.
ATR (Average True Range):
Calculated using ta.atr(atrPeriod).
Represents average volatility over the specified period. Used later to derive volatility stability.
ADX (Average Directional Index):
A detailed, manual implementation (not using built-in ta.adx for customization):
Computes upward movement (upMove = high - high ) and downward movement (downMove = low - low).
Derives +DM (Plus Directional Movement) and -DM (Minus Directional Movement) by filtering non-relevant moves.
Smooths true range (trur = ta.rma(ta.tr(true), adxPeriod)).
Calculates +DI and -DI: plusDI = 100 * ta.rma(plusDM, adxPeriod) / trur, similarly for minusDI.
DX: dx = 100 * abs(plusDI - minusDI) / max(plusDI + minusDI, 0.0001).
ADX: adx = ta.rma(dx, adxPeriod).
ADX values above 25 typically indicate strong trends; here, it's normalized (divided by 50) to influence the trend bias.
Volume Delta (5m Timeframe):
Fetches 5m volume: volume_5m = request.security(syminfo.tickerid, "5", volume, lookahead=barmerge.lookahead_on).
Computes a 12-period SMA of volume: avgVolume = ta.sma(volume_5m, 12).
Delta: (volume_5m - avgVolume) / avgVolume (or 0 if avgVolume is zero).
This measures relative volume spikes, where positive deltas suggest increased interest (bullish) and negative suggest waning activity (bearish).
MOS Components and Final Calculation:
Trend Bias: Average of the three slopes, normalized by close price and scaled by 100, then weighted by ADX influence: (slope5m + slope15m + slope30m) / 3 / close * 100 * (adx / 50).
Emphasizes trends in strong ADX conditions.
Momentum Impulse: Change in 5m RSI(14) over 1 bar, divided by 50: ta.change(request.security(syminfo.tickerid, "5", ta.rsi(close, 14), lookahead=barmerge.lookahead_on), 1) / 50.
Captures short-term momentum shifts.
Volatility Clarity: 1 - ta.change(atr, 1) / max(atr, 0.0001).
Measures ATR stability; values near 1 indicate low volatility changes (clearer trends), while lower values suggest erratic markets.
MOS Formula: Weighted average:
textmos = (0.35 * trendBias + 0.25 * momentumImpulse + 0.2 * volumeDelta + 0.2 * volatilityClarity)
Weights prioritize trend (35%) and momentum (25%), with volume and volatility at 20% each. These can be adjusted in code for experimentation.
Trading Decision:
A variable mosDecision starts as "Neutral".
If mos > 0.15, set to "Long".
If mos < -0.15, set to "Short".
Thresholds (0.15 and -0.15) are hardcoded but can be modified.
Visualization and Outputs
Threshold Lines (using hline):
Long Threshold: Horizontal dashed green line at +0.15.
Short Threshold: Horizontal dashed red line at -0.15.
Neutral Line: Horizontal dashed gray line at 0.
These provide visual reference points for MOS interpretation.
Dynamic Labels (using label.new):
Placed at each bar's index and MOS value.
Text: Formatted MOS value (e.g., "0.2345") followed by a newline and the decision (e.g., "Long").
Style: Downward-pointing label with gray background and white text for readability.
This replaces a traditional plot line, showing exact values and decisions per bar without cluttering the chart.
The indicator appears in a separate pane below the main price chart, making it easy to monitor alongside price action.
Usage Instructions
Adding to TradingView:
Copy the script into TradingView's Pine Script editor.
Save and add to your chart via the "Indicators" menu.
Select a symbol and timeframe (e.g., 1-minute for intraday).
Interpretation:
Long Signal: MOS > 0.15 – Consider bullish positions if supported by other indicators.
Short Signal: MOS < -0.15 – Potential bearish setups.
Neutral: Between -0.15 and 0.15 – Avoid trades or wait for confirmation.
Watch for MOS crossings of thresholds for momentum shifts.
Combine with price patterns, support/resistance, or volume for better accuracy.
Limitations and Considerations:
Lookahead Bias: Uses barmerge.lookahead_on for multi-timeframe data, which may introduce minor forward-looking bias in backtesting (use with caution).
No Alerts Built-In: Add custom alerts via TradingView's alert system based on MOS conditions.
Performance: Tested for compatibility; may require adjustments for illiquid assets or extreme volatility.
Backtesting: Use TradingView's strategy tester to evaluate historical performance, but remember past results don't guarantee future outcomes.
Customization: Edit weights in the MOS formula or thresholds to fit your strategy.
This indicator distills complex market data into a single score, aiding decision-making while encouraging users to verify signals with additional analysis. If you need modifications, such as restoring plot functionality or adding features, provide details for further refinement.

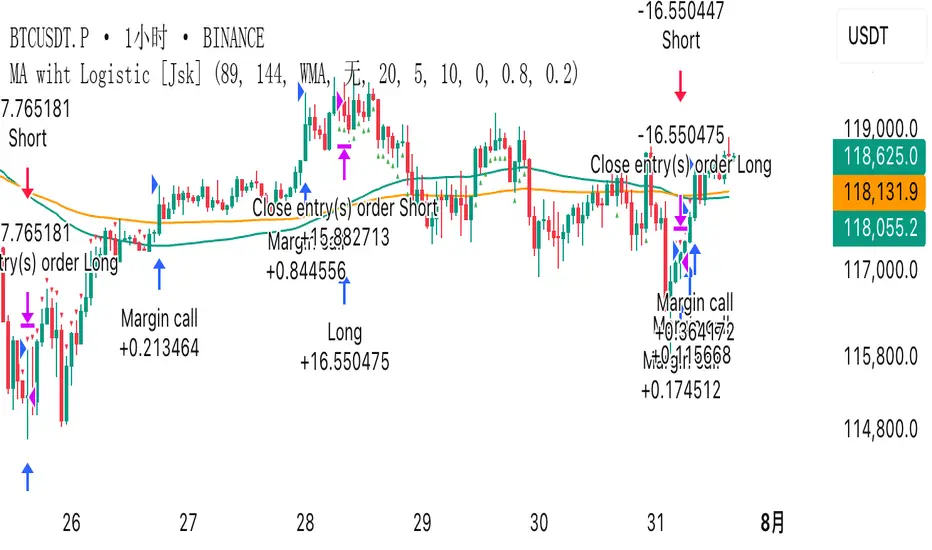
MA wiht Logistic [Jsk]This script is published for educational purposes only and does not constitute financial advice. Past performance does not guarantee future results. Trade at your own risk; the author accepts no liability for any financial loss incurred.
Concept
• Direction is defined by the relationship between price and two moving averages (Fast & Slow).
Long: Close > Fast MA > Slow MA
Short: Close < Fast MA < Slow MA
• Three independent exit modes are available:
1) None – positions are closed only when an opposite signal appears.
2) Percentage – fixed take-profit / stop-loss expressed in % of entry price (default +20 % / –5 %).
3) Logistic – a dynamic take-profit / stop-loss based on a logistic transformation of unrealised P&L.
Key Inputs
• MA Type: EMA, SMA or WMA
• Fast / Slow MA length
• Exit Mode: None | Percentage | Logistic
• Percentage TP / SL values (active when Exit Mode = Percentage)
• Logistic settings: slope k, midpoint, TP / SL probability thresholds (active when Exit Mode = Logistic)
Recommended Use
The script works on any market or timeframe, but MA-based trend filters usually perform better in assets with smooth, directional moves. Always verify results in the Strategy Tester and account for commissions and slippage.
Chandelier Exit with ZLSMA SwiftEdgeChandelier Exit with ZLSMA
Overview
The "Chandelier Exit with ZLSMA" indicator is a powerful trading tool designed to identify trend reversals and high-probability entry points in financial markets. By combining the volatility-based Chandelier Exit with the low-lag Zero Lag Least Squares Moving Average (ZLSMA), this indicator provides clear Buy and Sell signals, enhanced with a unique signal strength score to help traders prioritize high-quality opportunities. Visual enhancements, including dynamic color coding, background highlights, and trend arrows, make it intuitive and visually appealing for both novice and experienced traders.
What It Does
This indicator generates Buy and Sell signals when a trend reversal is detected by the Chandelier Exit, but only if the price crosses the ZLSMA for the first time in the direction of the trend. Each signal is accompanied by a percentage score (0-100%) that measures its strength based on price movement and momentum. The indicator overlays directly on the price chart, displaying:
Buy/Sell labels with signal strength (e.g., "Buy (85%)").
A ZLSMA line that changes color (green for bullish, red for bearish) to indicate trend direction.
Background highlights to mark signal candles.
Trend arrows to visually confirm signal points.
How It Works
The indicator combines two complementary components:
Chandelier Exit:
Uses the Average True Range (ATR) to create dynamic trailing stop levels (long_stop and short_stop) that adapt to market volatility.
Signals a Buy when the price crosses above the short stop (indicating a potential uptrend) and a Sell when it crosses below the long stop (indicating a potential downtrend).
Default settings use an ATR period of 1 and a multiplier of 2.0 for high sensitivity to short-term price movements.
Zero Lag LSMA (ZLSMA):
A low-lag moving average based on linear regression, designed to reduce delay compared to traditional moving averages.
Acts as a trend filter: Buy signals are only generated when the price closes above ZLSMA for the first time, and Sell signals when it closes below for the first time.
Default length of 50 balances smoothness with responsiveness.
Signal Strength Score:
Each signal is assigned a score (0-100%) based on:
Distance to ZLSMA (60% weight): How far the price is from ZLSMA, normalized by ATR. Larger distances indicate stronger breakouts.
Candlestick size (40% weight): The size of the signal candle, normalized by ATR. Larger candles suggest stronger momentum.
A high score (e.g., >80%) indicates a robust signal, while a low score (e.g., <50%) suggests caution.
Visual Features:
The ZLSMA line changes color (green for bullish, red for bearish) to reflect the trend.
Signal candles are highlighted with a subtle green (Buy) or red (Sell) background.
Tiny triangular arrows appear below Buy signals and above Sell signals for clear visual confirmation.
Why Combine Chandelier Exit and ZLSMA?
The Chandelier Exit excels at identifying trend reversals through volatility-based stops, but it can generate false signals in choppy markets due to its sensitivity (especially with a short ATR period of 1). The ZLSMA addresses this by acting as a trend filter, ensuring signals are only triggered when the price confirms a trend by crossing the ZLSMA for the first time. This combination reduces noise and focuses on high-probability setups. The signal strength score further enhances decision-making by quantifying the conviction behind each signal, making the indicator feel intuitive and "smart."
How to Use
Setup:
Add the indicator to your chart in TradingView.
Adjust inputs in the settings panel:
ATR Period (default: 1): Controls the sensitivity of Chandelier Exit. Increase for smoother signals.
ATR Multiplier (default: 2.0): Sets the distance of stop levels from price extremes.
ZLSMA Length (default: 50): Adjusts the smoothness of the ZLSMA line. Shorter lengths (e.g., 20-30) are more responsive; longer lengths (e.g., 50-100) are smoother.
Use Close Price for Extremums (default: true): Determines whether Chandelier Exit uses closing prices or high/low prices for calculations.
Interpreting Signals:
Buy Signal: A green "Buy (X%)" label appears below a candle when the price crosses above the Chandelier Exit short stop and closes above ZLSMA for the first time. The percentage indicates signal strength (higher = stronger).
Sell Signal: A red "Sell (X%)" label appears above a candle when the price crosses below the Chandelier Exit long stop and closes below ZLSMA for the first time.
Use the ZLSMA line’s color (green for bullish, red for bearish) to confirm the overall trend.
Prioritize signals with high strength scores (e.g., >70%) for better reliability.
Trading Considerations:
Combine signals with other analysis (e.g., support/resistance, volume) for confirmation.
Test the indicator on a demo account or use TradingView’s Strategy Tester to evaluate performance.
Be cautious with the default ATR period of 1, as it is highly sensitive and may generate frequent signals in volatile markets.
What Makes It Unique
This indicator stands out due to its thoughtful integration of Chandelier Exit and ZLSMA, creating a synergy that balances sensitivity with reliability. The first-cross filter ensures signals are triggered only at the start of potential trends, reducing false positives. The signal strength score adds a layer of intelligence, helping traders assess the quality of each signal without needing external tools. Visual enhancements, such as dynamic ZLSMA coloring, background highlights, and trend arrows, make the indicator user-friendly and visually engaging, appealing to traders seeking a modern, intuitive tool.
Limitations and Notes
The short ATR period (1) makes the indicator highly sensitive, which suits short-term traders but may produce noise in sideways markets. Increase the ATR period for smoother signals.
The signal strength score is a heuristic based on price movement and momentum, not a predictive model. Use it as a guide, not a definitive predictor.
Always backtest the indicator on your preferred market and timeframe to ensure it aligns with your trading strategy.
