Adaptive CE-VWAP Breakout Framework [KedArc Quant]Description
A structured framework that unites three complementary systems into one charting engine:
Chandelier Exit (CE) – ATR-based trailing logic that defines trend direction, stop placement, and risk/reward overlays.
Swing-Anchored VWAP (SWAV) – a dynamically anchored VWAP that re-starts from each confirmed swing and adapts its smoothness to volatility.
Pivot S/R with Volume Breaks – confirmed horizontal levels with alerts when broken on expanding volume.
This script builds a single workflow for bias → trigger → managementwithout mixing unrelated indicators. Each module is internally linked rather than layered cosmetically, making it a true analytical framework—not.
Acknowledgment
Special thanks to Dynamic Swing Anchored VWAP by Zeiierman, whose swing-anchoring concept inspired a part of the SWAV module’s implementation and adaptation logic.
Support and Resistance Levels with Breaks by LuxAlgo for S/R breakout logic.
How this helps traders
Trend clarity – CE color-codes direction and provides evolving stops.
Context value – SWAV traces adaptive mean paths so traders see where price is heavy or light.
Action filter – Pivot+volume logic highlights true structural breaks, filtering false moves.
Discipline tool – Optional R:R boxes visualize risk and target zones to enforce planning.
Entry / Exit guidelines (for study purposes only)
Bias Use CE direction: green = long bias red = short bias
Entry
1. Breakout method– Trade in CE direction when a pivot level breaks on valid volume.
2. VWAP confirmation– Prefer breaks occurring around the nearest SWAV path (fair-value cross or re-test).
Exit
Stop = CE line / recent swing HL / ATR × (multiplier)
Target = R-multiple × risk (default 2 R)
Optional live update keeps SL/TP aligned with current CE state.
Core formula concepts
ATR Stop: Stop = High/Low – ATR × multiplier
VWAP calc: Σ(price × vol) / Σ(vol) anchored at swing pivot, adapted by APT (Adaptive Price Tracking) ratio ∝ ATR volatility.
Volume oscillator: 100 × (EMA₅ – EMA₁₀)/EMA₁₀; valid break when threshold %.
Input configuration (high-level)
Master Controls
Show CE / SWAV modules Theme & Fill opacity
CE Section
ATR period & multiplier Use Close for extremums
Show buy/sell labels Await bar confirmation
Risk-Reward overlay: R-multiple, Stop basis (CE/Swing/ATR×), Live update toggle
SWAV Section
Swing period Adaptive Price Tracking length Volatility bias (ATR-based adaptation) Line width
Pivot & Volume Breaks
Left/Right bar windows Volume threshold % Show Break labels and alerts
Best timeframes
Intraday: 5 m – 30 m for breakout confirmation
Swing: 1 h – 4 h for trend context
Settings scale with instrument volatility—adjust ATR period and volume threshold to match liquidity.
Glossary
ATR: Average True Range (volatility metric)
CE: Chandelier Exit (trailing stop/trend filter)
SWAV: Swing-Anchored VWAP (anchored mean price path)
Pivot H/L: Confirmed local extrema using left/right bar windows
R-multiple: Profit target as a multiple of initial risk
FAQ
Q: Does it repaint? A: No—pivots wait for confirmation and VWAP updates forward-only.
Q: Can modules be disabled? A: Yes—each section has its own toggle.
Q: Can it trade automatically? A: This is an indicator/study, not an auto-strategy.
Q: Is this financial advice? A: No—educational use only.
Disclaimer
This script is for educational and analytical purposes only.
It is not financial advice. Trading involves risk of loss. Past performance does not guarantee future results. Always apply sound risk management.
ابحث في النصوص البرمجية عن "VWAP"

Ghost Signal — MTF EMA/VWAP Confluence SystemGhost Signal — MTF EMA/VWAP Confluence System
Purpose
Ghost Signal is an intraday trend-entry tool that tries to do one thing well: only fire when multiple, independent edges agree. It looks for pullbacks to the EMA-20 or clean trend-continuations, then gates those raw triggers behind VWAP/Anchored-VWAP alignment, higher-timeframe structure, momentum, spacing (anti-chop), volume and ATR context. The goal is fewer, higher-quality entries that avoid “death-by-a-thousand scalps” in chop.
What it plots
EMA 20/50/200 for trend structure and spacing (no-braid filter).
VWAP (session) and optional Anchored VWAP (Daily/Weekly/Monthly).
ENTRY labels when all filters pass.
A compact status table: HTF score (M/W/D/4H/15/5), VWAP/AVWAP arrows, EMA regime, slopes %, ATR%, spacing %, and distance from EMA-50.
How signals are built
Raw triggers (on chart TF or a lower “signal TF” for intrabar precision):
PB20: trend pullback that crosses back through EMA-20.
TC: trend-continuation when price holds the side of EMA-20 with limited gap.
Confluence filters (must pass):
EMA regime & slopes: 20>50>200 for longs (reverse for shorts) with minimum slope on EMA-20/50.
VWAP/AVWAP alignment: price must be above both for longs / below for shorts, with a configurable margin.
HTF structure score: combines M/W/D/4H/15/5 states and penalizes corrections.
Anti-chop spacing: minimum separation between 20↔50 and 50↔200.
Context: volume ≥ SMA×mult, ATR% ≥ floor, max distance from EMA-50 to avoid late chases.
Optional breakout: close > prior high (long) / < prior low (short).
Time lockouts: exclude known messy windows (open/close, FX rollover, etc.).
Adaptive slope (optional): slopes auto-tighten/loosen with market heat (ATR% & relative volume).
How to use
Works on 1–5m best; designed for futures, stocks, FX, and crypto.
Use the status table to confirm context (HTF score, VWAP arrows, slopes/ATR/spacing).
Pair with your own risk model; common templates: stop ≈ 1.5–2× ATR, TP ≈ 1.2–1.8R or an ATR trail.
Turn the Signal TF to “1” on 3m/5m charts if you want intrabar PB20 detection.
Why it helps
Ghost Signal tries to stack institutional anchors (VWAP/AVWAP), higher-timeframe bias, and momentum/structure so you participate in moves with real sponsorship—and sit out the braid.
Notes & limits
No indicator removes risk. Expect fewer signals on range days, slippage around news, and thinner markets to require stricter volume/spacing. Past results don’t guarantee future returns.

Smart Money LITE — Daily Sweep → HQ Signals (VWAP • FVG • CHoCH) 🔗 PRO VERSION (VWAP + FVG + CHoCH — full confirmations, all timeframes):
chartedgepro.gumroad.com/l/rmnbhw
Daily liquidity sweep → confluence signals with VWAP, FVG & CHoCH. Works on all timeframes & markets (Indices, Forex, Crypto).
WHAT IT DOES
Smart Money LITE+ highlights high-quality LONG/SHORT signals only after daily liquidity is swept (previous day high/low) with confluence from VWAP, FVG and structure (BOS/CHoCH).
Works on all timeframes and across markets: indices, forex, crypto.
KEY FEATURES (Lite)
• Daily sweep logic (PDH/PDL) + previous day zones
• VWAP + deviation bands (optional) and proximity filter
• 3-bar FVG boxes (visual) with adjustable extension
• ATR/volatility filter, optional HTF trend filter
• Anti-spam cooldown, clean LONG/SHORT labels
• Alerts: HQ LONG / HQ SHORT
HOW TO USE
1. Wait for price to sweep PDH/PDL → indicator opens “signal window”.
2. Look for confluence: VWAP touch/proximity + CHoCH or BOS in direction.
3. Enter with proper risk management (stop beyond swing/zone, partials).
SETTINGS TIPS
• Enable “Require VWAP Confluence?” for strictest setups.
• Use “HTF Trend Filter?” to align with higher-timeframe EMA trend.
• Adjust “After sweep (bars)” to define signal validity window.
• FVGs are visual in Lite — advanced filtering and confirmation are in Pro.
WHO IT'S FOR
Scalpers, intraday, and swing traders looking for objective, visual signals based on liquidity sweeps and VWAP/FVG confluence.
PRO VERSION (full confirmations)
Adds advanced FVG/iFVG logic, more confluence filters, dynamic risk tools and extended alert packages — optimized for all timeframes.
👉 chartedgepro.gumroad.com/l/rmnbhw
NOTES
• For educational purposes only. No financial advice.
• “Lite” is open-source; redistribution of code follows TradingView rules.

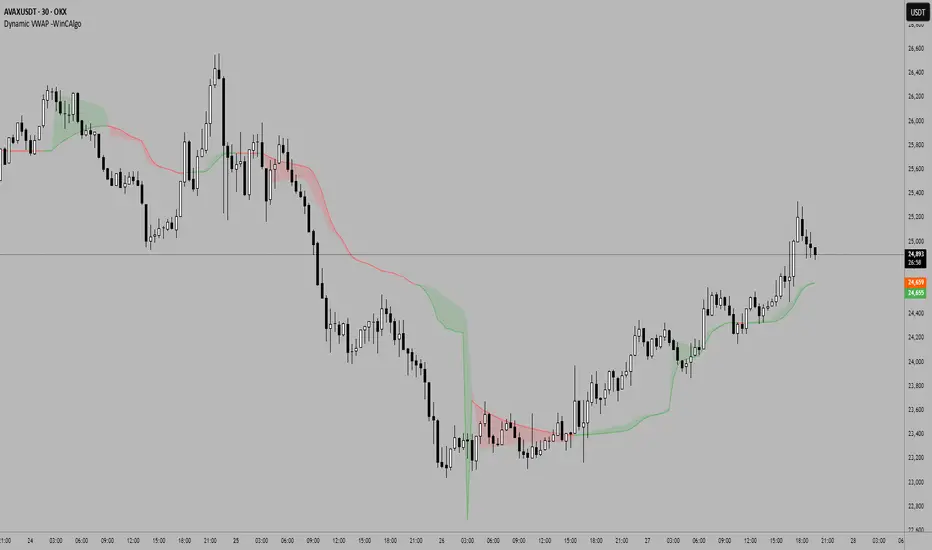
Dynamic VWAP -WinCAlgoDynamic VWAP Curve
This indicator applies an adaptive smoothing method to VWAP (Volume Weighted Average Price) to create two dynamic curves:
Fast VWAP (reacts quickly to price changes)
Smoothed VWAP (slower, adaptive baseline)
How to interpret:
When Fast VWAP > Smoothed VWAP, trend bias is bullish.
When Fast VWAP < Smoothed VWAP, trend bias is bearish.
The shaded area between the two lines works like a dynamic support/resistance zone.
📌 Usage ideas:
As a trend filter: take long trades only when Fast > Smoothed.
As a crossover signal: buy/sell when the two lines cross.
As support/resistance: price moving too far from the band can signal mean-reversion opportunities.
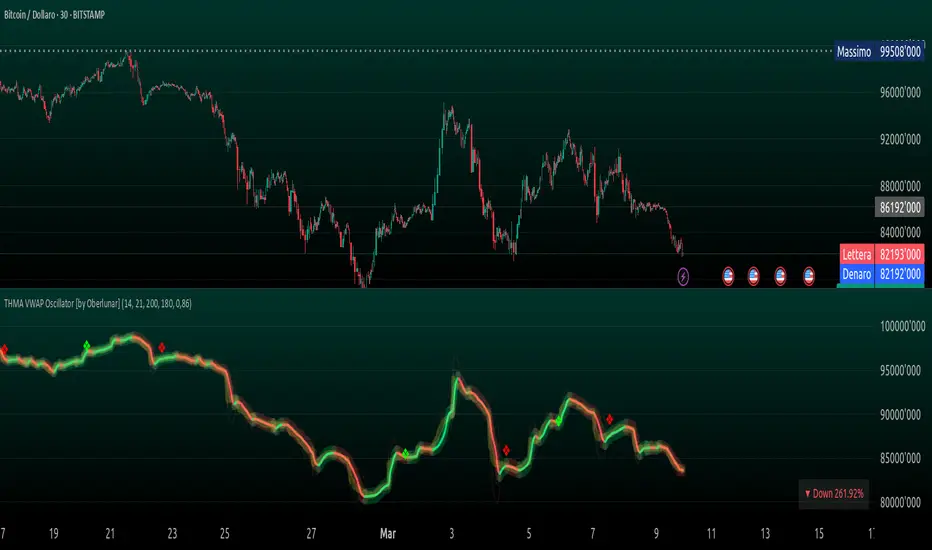
THMA VWAP Oscillator [by Oberlunar]The THMA VWAP Oscillator of Oberlunar is a trend-following and liquidity-sensitive indicator that blends the Triple Hull Moving Average (THMA) with Volume Weighted Average Price (VWAP) deviation bands to highlight high-probability trading setups. It helps traders differentiate between healthy momentum moves and market noise , making it an effective tool for spotting trend continuations, reversals, and mean reversion trades .
At its core, the THMA is an advanced moving average that smooths price action while minimizing lag. Unlike conventional moving averages that react slowly, the THMA dynamically adapts to market conditions by applying a weighted smoothing process. This allows it to react more efficiently to momentum shifts , making it ideal for trend-following and breakout strategies .
The VWAP acts as a volume-weighted price equilibrium, giving traders a framework for understanding institutional positioning. Since VWAP considers both price and volume , it helps determine whether the market is trading at a premium or a discount relative to where most of the volume has transacted. The inclusion of VWAP deviation bands , derived from standard deviations, enhances the ability to detect overbought and oversold conditions , ensuring that signals align with key liquidity levels.
The indicator generates buy and sell signals based on a structured methodology that incorporates trend direction, liquidity positioning, and momentum confirmation . A buy signal is triggered when the THMA on a higher timeframe is positioned below the THMA of the current timeframe, indicating that the broader trend is supportive of an upward move. Additionally, the THMA must be trading below the lower VWAP deviation band , suggesting that price is in a discounted liquidity zone, which is often an area where institutional buyers step in. To ensure that the signal is not just a random fluctuation, the THMA must also show positive slope , meaning it is actively rising, confirming that price is attempting to reverse or continue its upward move with strength.
A sell signal follows the same logic in reverse. The THMA on a higher timeframe must be above the THMA of the current timeframe, confirming alignment with a broader downtrend. The THMA must also be positioned above the upper VWAP deviation band , signaling that price is extended and potentially due for a reversal. To validate that the momentum is actually weakening, the THMA must be in a declining slope , ensuring that price is not simply pausing but actually entering a phase of downward acceleration.
One of the key nuances of the THMA VWAP Oscillator is how it visually represents momentum through the serpentine line , which dynamically shifts color as it develops. When the serpentine line maintains a consistent color—green in an uptrend or red in a downtrend—it signals strong trend conviction . However, when the color fluctuates rapidly between green and red, it indicates a weakening signal , suggesting that price action is becoming choppy and trend strength is deteriorating. This alternation in color serves as an early warning of potential reversals, false breakouts, or trend exhaustion. Traders should be cautious when signals appear in conjunction with an unstable serpentine, as they are less likely to be reliable in such conditions.
To further enhance signal quality, the indicator incorporates a signal alternation mechanism , ensuring that consecutive buy or sell signals do not appear unless the previous trade setup has been invalidated. This helps prevent overtrading in consolidating markets and reduces the chances of chasing false breakouts. Additionally, the placement of buy and sell labels is optimized using ATR-based scaling , positioning them strategically above or below price action to maintain chart clarity without interfering with live price movements.
By integrating trend structure, liquidity positioning, and signal validation , the THMA VWAP Oscillator provides a structured approach to trade execution. It is particularly effective for traders looking to capture breakout moves, pullback entries, and mean reversion opportunities , as it ensures that entries are aligned with market momentum, institutional positioning, and price equilibrium dynamics . The ability to filter out weak signals while identifying strong momentum trends makes it an indispensable tool for trend-followers, breakout traders, and mean reversion specialists alike .
I am very pleased to share that I am publicly releasing one of my private indicators, which I usually provide exclusively to my community. This is a significant moment for me, as this tool has been carefully refined and tested to offer high-quality trading insights.
I also want to take this opportunity to thank my entire community for the incredible support I have received over the past few months. Your feedback, engagement, and enthusiasm continue to inspire me, and I truly appreciate being part of this journey with all of you.
Stay tuned for more updates, and as always, trade smart! 🚀
TTP VWAP BandThis indicator offers 20 VWAP bands and on-chart statistic data about the bands.
Features
- Longs and shorts
- Cherry-pick up to 5 bands for backtesting
- Plots 20 bands
- Step scale to increase deviation percentage on each band
- Period and timeframe selectors
- Band crosses: how many times a band was crossed (also percentage)
- Band bounces: how many times each band was pinched and bounced back (also percentage)
How to use:
1) Set the chart to 15 or 5 minute timeframe for higher backtesting accuracy
2) Select the first band deviation % (MIN Long VWAP % and MIN Short VWAP %), use a small number like 0.3 or 1.0 since the rest of the 20 bands will increase that amount later.
3) Select a step scale or leave it in 1 if you prefer same distance between all bands. Notice that if you use a value below 1 the bands will get closer to each other.
4) Observe the statistics and pay attention to how many times each of the bands are being crossed in percentage. This will later help you make decisions on when to enter and where to potentially put an SL.
Connect with your preferred backtester:
You can backtest a single or multiple bands at once. For example you could use the 7th band to enter a base order and later use crosses of the 4th band to enter safety orders. Any combination is possible!
Let's assume you decide that you will be backtesting only 1 band at the time as your single entry condition for your backtester.
Let's also assume that you want to use the 2nd band for long entries then do follow these steps:
- Set "Band 1 backtesting" to 2 so that it prints 1 every time the price crosses below the 2nd band.
- Leave the other Band backtesting band settings with a 0 so they stay disabled
- Add your backtester to the same chart and select "band 1 long signal"
- This signal will contain 1 every time your conditions are met

Origin VWAP: OVWAPDraw a VWAP support/resistance line anchored to the origin of the data series (like a daily VWAP, but from the beginning of time, never resetting).
Ideally the origin would be the first bar after the IPO. Tradingview (or your connected broker) doesn't always have a complete dataset, and in that case the OVWAP will be 'wrong', but converging to the correct value over time.
You can try to simulate this with the built-in VWAP indicator but it has several bugs and limitations. Firstly, the longest time period is century, but it is not 100 years, ie. a rolling century but the beginning of the century: 21 years ago. Secondly, even if your dataset is less than 21 years, if you use a lower time frame then the built-in VWAP's origin becomes the left-most loaded bar (about 5,000 bars ago) - it will draw the wrong value. The new Anchored VWAP drawing tool can't be used on lower time frames as it won't draw the line at all unless it sees the point where you anchored it.
You may want to cut 'n paste this code to use in some larger strategy. Unfortunately that's probably not possible. This script uses the 'resolution=' option of 'study()' set to '1W', so the whole script runs at the 1 week resolution. You would think it would be possible to instead use the 'security()' function to request data at the '1W' resolution, but it just resamples the current data set and so is limited to the rightmost 5,000 bars.
Look in the options to enable standard deviation lines.

Smoothed VWAP Bands + EMAsSmoothed VWAP bands
With my script, you take the raw standard deviation and apply an EMA (exponential moving
Advantages:
1. Less noise:
* The bands don’t jump around with every tiny price spike.
* Makes it easier to judge real price extremes.
2. Better zone visualization:
* Inner and outer bands are smoother and more visually “stable.”
* Easier to see meaningful trends, support/resistance, and breakout zones.
3. Fewer fakeouts:
* Traders can filter out small false signals because smoothed bands only move when volatility actually changes.
4. Dynamic to volatility:
* EMA smoothing keeps the bands adaptive:
* In quiet periods, bands tighten.
* In volatile periods, bands expand.
* But it avoids extreme jitter caused by every micro-move.
Safe Zone Rules
1. Long entries (green zone):
* Price above VWAP (trend bullish).
* Price inside inner band ±1σ (not touching outer extremes).
* Optional: candle close confirmation (price fully above inner band).
2. Short entries (red zone):
* Price below VWAP (trend bearish).
* Price inside inner band ±1σ.
* Optional: candle close confirmation.
3. Outer bands (±2σ):
* Considered overextended zones → avoid entries to reduce fakeouts.
4. Visual cues:
* Safe zones shaded lightly green/red inside inner band.
* Outer bands remain unshaded (for context).
Here’s a cheat sheet for trading the Smoothed VWAP Bands + EMAs that shows safe entry zones and trend alignment clearly.
Smoothed VWAP Bands + EMAs Cheat Sheet
Price Action Relative to Bands & EMAs
+2σ (Outer Upper Band)
----------------
Extreme volatility zone
Avoid entries here
+1σ (Inner Upper Band)
----------------
Safe zone limit for longs
Consider profit taking here
VWAP Line (Green = Bullish, Red = Bearish)
==================
Core trend indicator
Only trade in VWAP trend direction
-1σ (Inner Lower Band)
----------------
Safe zone limit for shorts
Good for entries in trend direction
-2σ (Outer Lower Band)
----------------
Extreme volatility zone
Avoid entries here
1️⃣ Trend Direction with VWAP & EMAs
* VWAP → shows the overall session trend.
* Price above VWAP → bullish
* Price below VWAP → bearish
* EMA 5 (blue) → short-term momentum
* EMA 20 (orange) → medium-term trend
Rule: Only take trades in the direction of the trend:
* Long trades → price > VWAP and EMA 5 > EMA 20
* Short trades → price < VWAP and EMA 5 < EMA 20
This prevents chasing trades against the trend and reduces fakeouts.
2️⃣ Entry Zones Using Smoothed VWAP Bands
* Inner band (±1σ) → “safe entry zone”
* Outer band (±2σ) → volatility extremes → avoid entries here
Rule: Enter longs inside the inner band above VWAP and shorts inside the inner band below VWAP.
Best used on intraday timeframes.
15, 5, 2, 1 min charts.

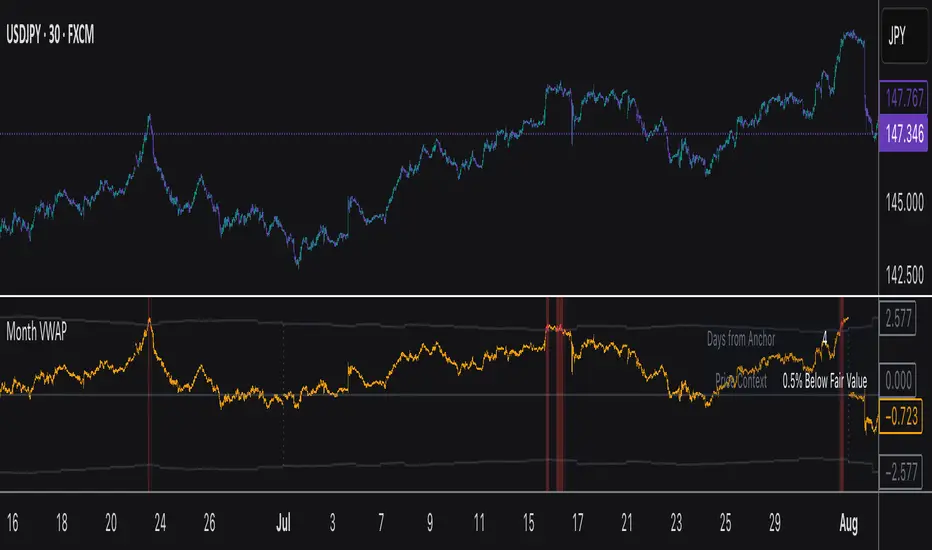
Monthly VWAPDescription
This indicator identifies potential mean reversion opportunities by tracking price deviations from monthly VWAP with dynamic volatility-adjusted thresholds.
Core Logic:
The indicator monitors when price moves significantly away from monthly VWAP and looks for potential reversal opportunities. It uses ATR-based dynamic thresholds that adapt to current market volatility, combined with volume confirmation to filter out weak signals.
Key Features:
Adaptive Thresholds: ATR-based bands that adjust to market volatility
Volume Confirmation: Requires average volume spike to validate signals
Monthly Reset: VWAP anchors reset each month for fresh reference levels
Visual Clarity: Color-coded deviation line with background highlights for active signals
Info Panel: Shows days from anchor and current price context vs fair value
Signal Generation:
Buy Signal: Price below monthly VWAP by threshold amount with elevated volume
Sell Signal: Price above monthly VWAP by threshold amount with elevated volume
Neutral: Price within threshold range or insufficient volume
Best Used For:
Mean reversion strategies in ranging markets
Identifying potential oversold/overbought conditions
Understanding price position relative to monthly fair value
2-Day Volume Weighted Average Price (VWAP)This indicator extends TradingView’s built-in VWAP by calculating a volume-weighted average price over a continuous two-day window (yesterday + today), anchoring VWAP at the start of yesterday’s session and carrying it through to today’s close, but only plotting the segment that falls within the current trading session—yesterday’s data feeds into the calculation to ensure today’s VWAP reflects the prior session’s volume and price action, while the line drawn on your chart always begins at today’s session open.
Standard Deviation Bands: Optional ±1σ, ±2σ, and ±3σ envelopes, exactly as in the default VWAP, but based on the rolling two-day data.

Anchored VWAP Pro (Final Visibility Enhanced)This is a fully customizable Anchored VWAP (Volume Weighted Average Price) indicator designed for traders who prioritize precision, clarity, and macro trend analysis.
Unlike traditional VWAPs tied to daily or session data, this version allows you to manually anchor the VWAP to any candle in history—ideal for macro swing trading, cycle lows, breakouts, and reaccumulation phases.
Features:
• Manual Anchor Date: Set the exact year, month, and day for your VWAP to begin
• Custom Price Source: Choose between HLC3, close, or any OHLC-based input
• VWAP Bands: Two standard deviation bands for identifying overextension or fair value zones
• Full Visual Control:
• Toggle each band on/off individually
• Adjust color, line width, and line style (solid, dotted, dashed)
• Built for Clarity: Designed to stand out on both light and dark charts
This script is ideal for:
• Identifying macro confluence zones
• Defining risk during trend pullbacks
• Confirming breakout legitimacy
• Layering with other tools like Market Cipher, VRVP, and Fib levels
Inspired by the work of LonesomeTheBlue, Algokid, and other pros—this is a cleaner, more flexible and updated alternative for precision trading.
Script created and published by @ImmortalEmerson
For advanced swing traders, crypto analysts, and macro trend specialists.
Z-Score Triggered VWAP# Z-Score Triggered VWAP Indicator
This custom indicator combines Volume-Weighted Average Price (VWAP) with Z-Score analysis to create a dynamic, volume-sensitive trading tool. It's designed to identify significant volume events and adjust the VWAP calculation accordingly, providing traders with a more responsive and adaptive price average.
## Key Features:
1. **Z-Score Triggered VWAP**: The indicator calculates a new VWAP when the volume Z-Score crosses above a user-defined threshold, allowing it to adapt to significant volume events.
2. **Customizable Timeframes**: Users can set different timeframes for Z-Score calculation and VWAP plotting, enabling multi-timeframe analysis.
3. **Dynamic Bands**: The indicator plots two sets of bands around the VWAP, calculated using standard deviation multipliers, which can be customized by the user.
4. **Visual Cues**: New VWAP start points are marked with yellow circles, helping traders identify where calculations reset.
5. **Real-time Information**: The current Z-Score and VWAP start information are displayed on the chart, providing immediate context.
6. **Flexible Appearance**: Users can customize colors and choose whether to display bands, enhancing chart readability.
7. **Multiple Alert Conditions**: The indicator includes alert conditions for price crossovers of the VWAP and all band levels.
## How It Works:
1. The indicator calculates the volume Z-Score on a user-specified timeframe, comparing current volume to historical volume over a lookback period.
2. When the volume Z-Score exceeds the threshold, a new VWAP calculation is triggered, resetting the cumulative values used in the VWAP formula.
3. The VWAP is continuously calculated and plotted on the chart, along with upper and lower bands based on price deviation from the VWAP.
4. Traders can use the VWAP line and bands to identify potential support/resistance levels and overbought/oversold conditions.
5. The Z-Score trigger helps ensure that the VWAP remains relevant by adapting to significant changes in trading volume.
## Trading Applications:
- **Dynamic Support/Resistance**: Use the VWAP and bands as potential support and resistance levels that adapt to changing market conditions.
- **Trend Identification**: The slope of the VWAP can help identify the overall trend direction.
- **Mean Reversion**: Look for potential reversals when price reaches the outer bands.
- **Volume Analysis**: The Z-Score trigger points highlight periods of unusual volume, which may precede significant price moves.
- **Risk Management**: Use the bands as potential stop-loss or take-profit levels.
This indicator is suitable for traders who want a more dynamic alternative to traditional VWAP indicators, especially those trading in markets with variable volume patterns. It combines volume analysis with price action, providing a comprehensive view of market behaviour
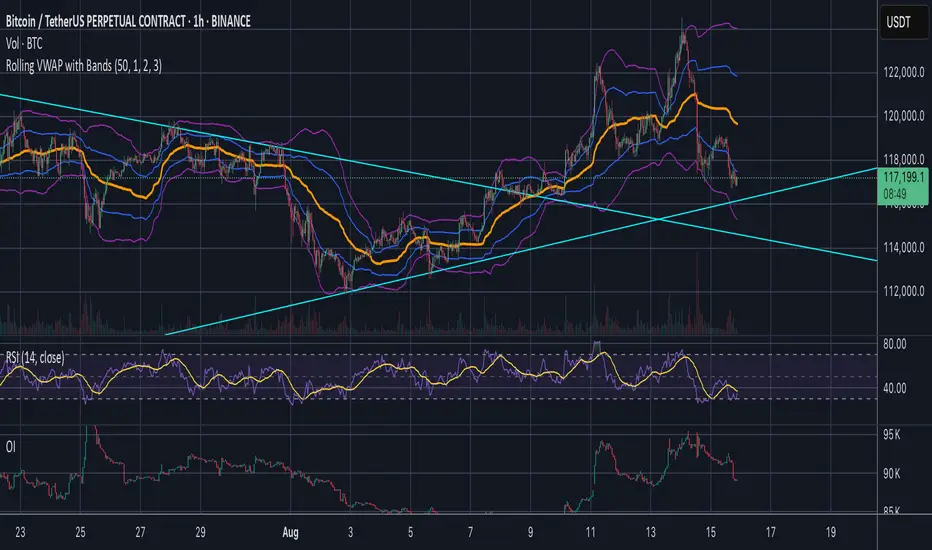
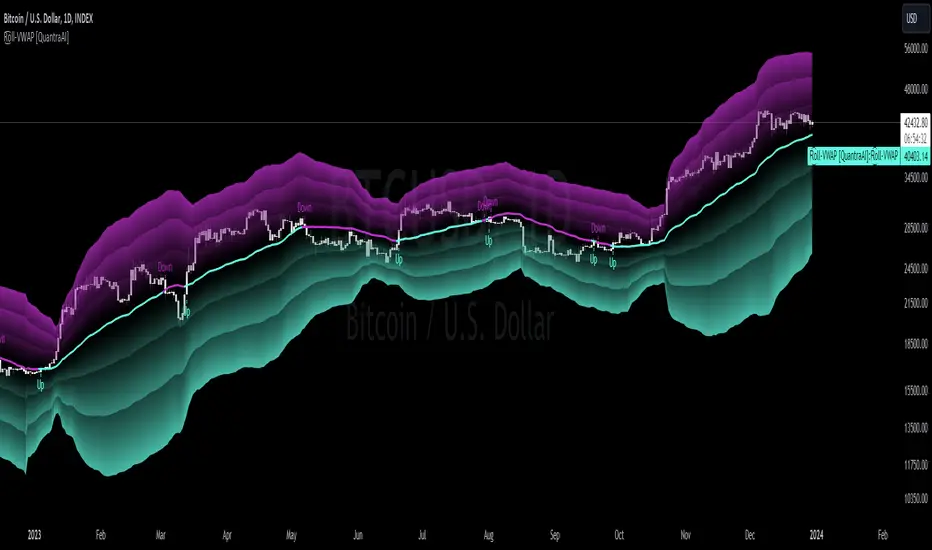
Rolling VWAP [QuantraSystems]Rolling VWAP
Introduction
The Rolling VWAP (R͜͡oll-VWAP) indicator modernizes the traditional VWAP by recalculating continuously on a rolling window, making it adept at pinpointing market trends and breakout points.
Its dual functionality includes both the dynamic rolling VWAP and a customizable anchored VWAP, enhanced by color-coded visual cues, thereby offering traders valuable flexibility and insight for their market analysis.
Legend
In the Image you can see the BTCUSD 1D Chart with the R͜͡oll-VWAP overlay.
You can see the individually activatable Standard Deviation (SD) Bands and the main VWAP Line.
It also features a Trend Signal which is deactivated by default and can be enabled if required.
Furthermore you can find the coloring of the VWAP line to represent the Trend.
In this case the trend itself is defined as:
Close being greater than the VWAP line -> Uptrend
Close below the VWAP line -> Downtrend
Notes
The R͜͡oll-VWAP can be used in a variety of ways.
Volatility adjusted expected range
This aims to identify in which range the asset is likely to move - according to the historical values the SD Bands are calculated and thus their according probabilities displayed.
Trend analysis
Trending above or below the VWAP shows up or down trends accordingly.
S/R Levels
Based on the probability distribution the 2. SD often works as a Resistance level and either mid line or 1. SD lines can act as S/R levels
Unsustainable levels
Based on the probability distributions a SD level of beyond 2.5, especially 3 and higher is hit very seldom and highly unsustainable.
This can either mean a mean reversion state or a momentum slowdown is necessary to get back to a sustainable level.
Please note that we always advise to find more confluence by additional indicators.
Traders are encouraged to test and determine the most suitable settings for their specific trading strategies and timeframes.
Methodology
The R͜͡oll-VWAP is based on the inbuilt TV VWAP.
It expands upon the limitations of having an anchored timeframe and thus a limited data set that is being reset constantly.
Instead we have integrated a rolling nature that continuously calculates the VWAP over a customizable lookback.
To also keep the base utility it is possible to use the anchored timeframes as well.
Furthermore the visualization has been improved and we added the coloring of the main VWAP line according to the Trend as stated above.
The applicable Trend signals are also part of that.
The parameter settings and also the visualizations allow for ample customizations by the trader.
For questions or recommendations, please feel free to seek contact in the comments.
Impatient TS VWAP BandsImpatient VWAP bands are based of Traderskew's VWAP bands but are for more impatient traders.
Wicking or crossing down through the upper band indicates a good short trade entry for range-bound trading periods while wicking or crossing up through the lower band indicates a good long entry in range-bound conditions.
By default, impatience is disabled. If it is turned on, adjusting impatience determines how quickly the bands approach price: higher impatience approaches price faster. Rebound indicates how far from price the bands bounce after hitting price.

6X Bollinger Bands + MA + VWAP Dingue V56X Bollinger Bands Dingue V5 - This is the updated version for Pine Script 5
This indicator lets you quickly see all the intricacies of the Bollinger Bands; it simplifies its usage and maximizes the results.
Color-coded if the price is above or under the middle and based on direction.
Color-coded for expansion and contraction of the bands.
Option to plot ‘Squeezed bands’. It will show above the bands when they become smaller than the setting chosen. This helps identify build-up that might explode one way or another.
- 6x independent Bands can be adjusted as you want. It gives you possibilities in how you see variance, trends, support and resistance.
You can also select the MA type: SMA EMA WMA VWAM FRAMA … to explore new ways to see the Bollinger bands.
New in this version, you can now add a separate ‘Long MA’ that you can select independently from the Bands. Ex. Plot 200 SMA This helps in building a strategy with the trend and the bands.
Like the MA above, you can also plot 2 different VWAP independently from the Bands. This also helps knowing where the price stands compared to the bigger time frame VWAP’s price.
'Tool tips' explain other settings, if you have any questions, feel free to ask in the comments below.
Thank you for the feedback and check all my ‘Dingue’ indicators.
Volume Profile Free Ultra SLI (100 Levels Value Area VWAP) - RRBVolume Profile Free Ultra SLI by RagingRocketBull 2019
Version 1.0
This indicator calculates Volume Profile for a given range and shows it as a histogram consisting of 100 horizontal bars.
This is basically the MAX SLI version with +50 more Pinescript v4 line objects added as levels.
It can also show Point of Control (POC), Developing POC, Value Area/VWAP StdDev High/Low as dynamically moving levels.
Free accounts can't access Standard TradingView Volume Profile, hence this indicator.
There are several versions: Free Pro, Free MAX SLI, Free Ultra SLI, Free History. This is the Free Ultra SLI version. The Differences are listed below:
- Free Pro: 25 levels, +Developing POC, Value Area/VWAP High/Low Levels, Above/Below Area Dimming
- Free MAX SLI: 50 levels, 2x SLI modes for Buy/Sell or even higher res 150 levels
- Free Ultra SLI: 100 levels, packed to the limit, 2x SLI modes for Buy/Sell or even higher res 300 levels
- Free History: auto highest/lowest, historic poc/va levels for each session
Features:
- High-Res Volume Profile with up to 100 levels (line implementation)
- 2x SLI modes for even higher res: 300 levels with 3x vertical SLI, 100 buy/sell levels with 2x horiz SLI
- Calculate Volume Profile on full history
- POC, Developing POC Levels
- Buy/Sell/Total volume modes
- Side Cover
- Value Area, VAH/VAL dynamic levels
- VWAP High/Low dynamic levels with Source, Length, StdDev as params
- Show/Hide all levels
- Dim Non Value Area Zones
- Custom Range with Highlighting
- 3 Anchor points for Volume Profile
- Flip Levels Horizontally
- Adjustable width, offset and spacing of levels
- Custom Color for POC/VA/VWAP levels, Transparency for buy/sell levels
WARNING:
- Compilation Time: 1 min 20 sec
Usage:
- specify max_level/min_level/spacing (required)
- select range (start_bar, range length), confirm with range highlighting
- select volume type: Buy/Sell/Total
- select mode Value Area/VWAP to show corresponding levels
- flip/select anchor point to position the buy/sell levels
- use Horiz Buy/Sell SLI mode with 100 or Vertical SLI with 300 levels if needed
- use POC/Developing POC/VA/VWAP High/Low as S/R levels. Usually daily values from 1-3 days back are used as levels for the current day.
SLI:
use SLI modes to extend the functionality of the indicator:
- Horiz Buy/Sell 2x SLI lets you view 100 Buy/Sell Levels at the same time
- Vertical Max_Vol 3x SLI lets you increase the resolution to 300 levels
- you need at least 2 instances of the indicator attached to the same chart for SLI to work
1) Enable Horiz SLI:
- attach 2 indicator instances to the chart
- make sure all instances have the same min_level/max_level/range/spacing settings
- select volume type for each instance: you can have a buy/sell or buy/total or sell/total SLI. Make sure your buy volume instance is the last attached to be displayed on top of sell/total instances without overlapping.
- set buy_sell_sli_mode to true for indicator instances with volume_type = buy/sell, for type total this is optional.
- this basically tells the script to calculate % lengths based on total volume instead of individual buy/sell volumes and use ext offset for sell levels
- Sell Offset is calculated relative to Buy Offset to stack/extend sell after buy. Buy Offset = Zero - Buy Length. Sell Offset = Buy Offset - Sell Length = Zero - Buy Length - Sell Length
- there are no master/slave instances in this mode, all indicators are equal, poc/va levels are not affected and can work independently, i.e. one instance can show va levels, another - vwap.
2) Enable Vertical SLI:
- attach the first instance and evaluate the full range to roughly determine where is the highest max_vol/poc level i.e. 0..20000, poc is in the bottom half (third, middle etc) or
- add more instances and split the full vertical range between them, i.e. set min_level/max_level of each corresponding instance to 0..10000, 10000..20000 etc
- make sure all instances have the same range/spacing settings
- an instance with a subrange containing the poc level of the full range is now your master instance (bottom half). All other instances are slaves, their levels will be calculated based on the max_vol/poc of the master instance instead of local values
- set show_max_vol_sli to true for the master instance. for slave instances this is optional and can be used to check if master/slave max_vol values match and slave can read the master's value. This simply plots the max_vol value
- you can also attach all instances and set show_max_vol_sli to true in all of them - the instance with the largest max_vol should become the master
Auto/Manual Ext Max_Vol Modes:
- for auto vertical max_vol SLI mode set max_vol_sli_src in all slave instances to the max_vol of the master indicator: "VolumeProfileFree_MAX_RRB: Max Volume for Vertical SLI Mode". It can be tricky with 2+ instances
- in case auto SLI mode doesn't work - assign max_vol_sli_ext in all slave instances the max_vol value of the master indicator manually and repeat on each change
- manual override max_vol_sli_ext has higher priority than auto max_vol_sli_src when both values are assigned, when they are 0 and close respectively - SLI is disabled
- master/slave max_vol values must match on each bar at all times to maintain proper level scale, otherwise slave's levels will look larger than they should relative to the master's levels.
- Max_vol (red) is the last param in the long list of indicator outputs
- the only true max_vol/poc in this SLI mode is the master's max_vol/poc. All poc/va levels in slaves will be irrelevant and are disabled automatically. Slaves can only show VWAP levels.
- VA Levels of the master instance in this SLI mode are calculated based on the subrange, not the whole range and may be inaccurate. Cross check with the full range.
WARNING!
- auto mode max_vol_sli_src is experimental and may not work as expected
- you can only assign auto mode max_vol_sli_src = max_vol once due to some bug with unhandled exception/buffer overflow in Tradingview. Seems that you can clear the value only by removing the indicator instance
- sometimes you may see a "study in error state" error when attempting to set it back to close. Remove indicator/Reload chart and start from scratch
- volume profile may not finish to redraw and freeze in an ugly shape after an UI parameter change when max_vol_sli_src is assigned a max_vol value. Assign it to close - VP should redraw properly, but it may not clear the assigned max_vol value
- you can't seem to be able to assign a proper auto max_vol value to the 3rd slave instance
- 2x Vertical SLI works and tested in both auto/manual, 3x SLI - only manual seems to work (you can have a mixed mode: 2nd instance - auto, 3rd - manual)
Notes:
- This code uses Pinescript v3 compatibility framework
- This code is 20x-30x faster (main for cycle is removed) especially on lower tfs with long history - only 4-5 sec load/redraw time vs 30-60 sec of the old Pro versions
- Instead of repeatedly calculating the total sum of volumes for the whole range on each bar, vol sums are now increased on each bar and passed to the next in the range making it a per range vs per bar calculation that reduces time dramatically
- 100 levels consist of 50 main plot levels and 50 line objects used as alternate levels, differences are:
- line objects are always shown on top of other objects, such as plot levels, zero line and side cover, it's not possible to cover/move them below.
- all line objects have variable lengths, use actual x,y coords and don't need side cover, while all plot levels have a fixed length of 100 bars, use offset and require cover.
- all key properties of line objects, such as x,y coords, color can be modified, objects can be moved/deleted, while this is not possible for static plot levels.
- large width values cause line objects to expand only up/down from center while their length remains the same and stays within the level's start/end points similar to an area style.
- large width values make plot levels expand in all directions (both h/v), beyond level start/end points, sometimes overlapping zero line, making them an inaccurate % length representation, as opposed to line objects/plot levels with area style.
- large width values translate into different widths on screen for line objects and plot levels.
- you can't compensate for this unwanted horiz width expansion of plot levels because width uses its own units, that don't translate into bars/pixels.
- line objects are visible only when num_levels > 50, plot levels are used otherwise
- Since line objects are lines, plot levels also use style line because other style implementations will break the symmetry/spacing between levels.
- if you don't see a volume profile check range settings: min_level/max_level and spacing, set spacing to 0 (or adjust accordingly based on the symbol's precision, i.e. 0.00001)
- you can view either of Buy/Sell/Total volumes, but you can't display Buy/Sell levels at the same time using a single instance (this would 2x reduce the number of levels). Use 2 indicator instances in horiz buy/sell sli mode for that.
- Volume Profile/Value Area are calculated for a given range and updated on each bar. Each level has a fixed length. Offsets control visible level parts. Side Cover hides the invisible parts.
- Custom Color for POC/VA/VWAP levels - UI Style color/transparency can only change shape's color and doesn't affect textcolor, hence this additional option
- Custom Width - UI Style supports only width <= 4, hence this additional option
- POC is visible in both modes. In VWAP mode Developing POC becomes VWAP, VA High and Low => VWAP High and Low correspondingly to minimize the number of plot outputs
- You can't change buy/sell level colors from input (only transparency) - this requires 2x plot outputs => 2x reduces the number of levels to fit the max 64 limit. That's why 2 additional plots are used to dim the non Value Area zones
- You can change level transparency of line objects. Due to Pinescript limitations, only discrete values are supported.
- Inverse transp correlation creates the necessary illusion of "covered" line objects, although they are shown on top of the cover all the time
- If custom lines_transp is set the illusion will break because transp range can't be skewed easily (i.e. transp 0..100 is always mapped to 100..0 and can't be mapped to 50..0)
- transparency can applied to lines dynamically but nva top zone can't be completely removed because plot/mixed type of levels are still used when num_levels < 50 and require cover
- transparency can't be applied to plot levels dynamically from script this can be done only once from UI, and you can't change plot color for the past length bars
- All buy/sell volume lengths are calculated as % of a fixed base width = 100 bars (100%). You can't set show_last from input to change it
- Range selection/Anchoring is not accurate on charts with time gaps since you can only anchor from a point in the future and measure distance in time periods, not actual bars, and there's no way of knowing the number of future gaps in advance.
- Adjust Width for Log Scale mode now also works on high precision charts with small prices (i.e. 0.00001)
- in Adjust Width for Log Scale mode Level1 width extremes can be capped using max deviation (when level1 = 0, shift = 0 width becomes infinite)
- There's no such thing as buy/sell volume, there's just volume, but for the purposes of the Volume Profile method, assume: bull candle = buy volume, bear candle = sell volume
P.S. I am your grandfather, Luke! Now, join the Dark Side in your father's steps or be destroyed! Once more the Sith will rule the Galaxy, and we shall have peace...

Volume Profile Free MAX SLI (50 Levels Value Area VWAP) by RRBVolume Profile Free MAX SLI by RagingRocketBull 2019
Version 1.0
All available Volume Profile Free MAX SLI versions are listed below (They are very similar and I don't want to publish them as separate indicators):
ver 1.0: style columns implementation
ver 2.0: style histogram implementation
ver 3.0: style line implementation
This indicator calculates Volume Profile for a given range and shows it as a histogram consisting of 50 horizontal bars.
It can also show Point of Control (POC), Developing POC, Value Area/VWAP StdDev High/Low as dynamically moving levels.
Free accounts can't access Standard TradingView Volume Profile, hence this indicator.
There are several versions: Free Pro, Free MAX SLI, Free History. This is the Free MAX SLI version. The Differences are listed below:
- Free Pro: 25 levels, +Developing POC, Value Area/VWAP High/Low Levels, Above/Below Area Dimming
- Free MAX SLI: 50 levels, packed to the limit, 2x SLI modes for Buy/Sell or even higher res 150 levels
- Free History: auto highest/lowest, historic poc/va levels for each session
Features:
- High-Res Volume Profile with up to 50 levels (3 implementations)
- 20-30x faster than the old Pro versions especially on lower tfs with long history
- 2x SLI modes for even higher res: 150 levels with 3x vertical SLI, 50 buy/sell levels with 2x horiz SLI
- Calculate Volume Profile on full history
- POC, Developing POC Levels
- Buy/Sell/Total volume modes
- Side Cover
- Value Area, VAH/VAL dynamic levels
- VWAP High/Low dynamic levels with Source, Length, StdDev as params
- Show/Hide all levels
- Dim Non Value Area Zones
- Custom Range with Highlighting
- 3 Anchor points for Volume Profile
- Flip Levels Horizontally
- Adjustable width, offset and spacing of levels
- Custom Color for POC/VA/VWAP levels and Transparency for buy/sell levels
Usage:
- specify max_level/min_level/spacing (required)
- select range (start_bar, range length), confirm with range highlighting
- select volume type: Buy/Sell/Total
- select mode Value Area/VWAP to show corresponding levels
- flip/select anchor point to position the buy/sell levels
- use Horiz SLI mode for 50 Buy/Sell or Vertical SLI for 150 levels if needed
- use POC/Developing POC/VA/VWAP High/Low as S/R levels. Usually daily values from 1-3 days back are used as levels for the current day.
SLI:
- use SLI modes to extend the functionality of the indicator:
- Horiz Buy/Sell 2x SLI lets you view 50 Buy/Sell Levels at the same time
- Vertical Max_Vol 3x SLI lets you increase the resolution to 150 levels
- you need at least 2 instances of the indicator attached to the same chart for SLI to work
1) Enable Horiz SLI:
- attach 2 indicator instances to the chart
- make sure all instances have the same min_level/max_level/range/spacing settings
- select volume type for each instance: you can have a buy/sell or buy/total or sell/total SLI. Make sure your buy volume instance is the last attached to be displayed on top of sell/total instances without overlapping.
- set buy_sell_sli_mode to true for indicator instances with volume_type = buy/sell, for type total this is optional.
- this basically tells the script to calculate % lengths based on total volume instead of individual buy/sell volumes and use ext offset for sell levels
- Sell Offset is calculated relative to Buy Offset to stack/extend sell after buy. Buy Offset = Zero - Buy Length. Sell Offset = Buy Offset - Sell Length = Zero - Buy Length - Sell Length
- there are no master/slave instances in this mode, all indicators are equal, poc/va levels are not affected and can work independently, i.e. one instance can show va levels, another - vwap.
2) Enable Vertical SLI:
- attach the first instance and evaluate the full range to roughly determine where is the highest max_vol/poc level i.e. 0..20000, poc is in the bottom half (third, middle etc) or
- add more instances and split the full vertical range between them, i.e. set min_level/max_level of each corresponding instance to 0..10000, 10000..20000 etc
- make sure all instances have the same range/spacing settings
- an instance with a subrange containing the poc level of the full range is now your master instance (bottom half). All other instances are slaves, their levels will be calculated based on the max_vol/poc of the master instance instead of local values
- set show_max_vol_sli to true for the master instance. for slave instances this is optional and can be used to check if master/slave max_vol values match and slave can read the master's value. This simply plots the max_vol value
- you can also attach all instances and set show_max_vol_sli to true in all of them - the instance with the largest max_vol should become the master
Auto/Manual Ext Max_Vol Modes:
- for auto vertical max_vol SLI mode set max_vol_sli_src in all slave instances to the max_vol of the master indicator: "VolumeProfileFree_MAX_RRB: Max Volume for Vertical SLI Mode". It can be tricky with 2+ instances
- in case auto SLI mode doesn't work - assign max_vol_sli_ext in all slave instances the max_vol value of the master indicator manually and repeat on each change
- manual override max_vol_sli_ext has higher priority than auto max_vol_sli_src when both values are assigned, when they are 0 and close respectively - SLI is disabled
- master/slave max_vol values must match on each bar at all times to maintain proper level scale, otherwise slave's levels will look larger than they should relative to the master's levels.
- Max_vol (red) is the last param in the long list of indicator outputs
- the only true max_vol/poc in this SLI mode is the master's max_vol/poc. All poc/va levels in slaves will be irrelevant and are disabled automatically. Slaves can only show VWAP levels.
- VA Levels of the master instance in this SLI mode are calculated based on the subrange, not the whole range. Cross check with the full range.
WARNING!
- auto mode max_vol_sli_src is experimental and may not work as expected
- you can only assign auto mode max_vol_sli_src = max_vol once due to some bug with unhandled exception/buffer overflow in Tradingview. Seems that you can clear the value only by removing the indicator instance
- sometimes you may see a "study in error state" error when attempting to set it back to close. Remove indicator/Reload chart and start from scratch
- volume profile may not finish to redraw and freeze in an ugly shape after an UI parameter change when max_vol_sli_src is assigned a max_vol value. Assign it to close - VP should redraw properly, but it may not clear the assigned max_vol value
- you can't seem to be able to assign a proper auto max_vol value to the 3rd slave instance
- 2x Vertical SLI works and tested in both auto/manual, 3x SLI - only manual seems to work
Notes:
- This code is 20x-30x faster (main for cycle is removed) especially on lower tfs with long history - only 2-3 sec load/redraw time vs 30-60 sec of the old Pro versions
- Instead of repeatedly calculating the total sum of volumes for the whole range on each bar, vol sums are now increased on each bar and passed to the next in the range making it a per range vs per bar calculation that reduces time dramatically
- hist_base for levels still results is ugly redraw
- if you don't see a volume profile check range settings: min_level/max_level and spacing, set spacing to 0 (or adjust accordingly based on the symbol's precision, i.e. 0.00001)
- you can view either of Buy/Sell/Total volumes, but you can't display Buy/Sell levels at the same time using a single instance (this would 2x reduce the number of levels). Use 2 indicator instances in horiz buy/sell sli mode for that.
- Volume Profile/Value Area are calculated for a given range and updated on each bar. Each level has a fixed length. Offsets control visible level parts. Side Cover hides the invisible parts.
- Custom Color for POC/VA/VWAP levels - UI Style color/transparency can only change shape's color and doesn't affect textcolor, hence this additional option
- Custom Width - UI Style supports only width <= 4, hence this additional option
- POC is visible in both modes. In VWAP mode Developing POC becomes VWAP, VA High and Low => VWAP High and Low correspondingly to minimize the number of plot outputs
- You can't change buy/sell level colors from input (only plot transparency) - this requires 2x plot outputs => 2x reduces the number of levels to fit the max 64 limit. That's why 2 additional plots are used to dim the non Value Area zones
- All buy/sell volume lengths are calculated as % of a fixed base width = 100 bars (100%). You can't set show_last from input to change it
- There's no such thing as buy/sell volume, there's just volume, but for the purposes of the Volume Profile method, assume: bull candle = buy volume, bear candle = sell volume
P.S. Gravitonium Levels Are Increasing. Unobtainium is nowhere to be found!
Links on Volume Profile and Value Area calculation and usage:
www.tradingview.com
stockcharts.com
onlinelibrary.wiley.com

AVWAP (ATR-Weighted VWAP) IndicatorAVWAP (Average True Range Weighted Average Price), you typically combine two core indicators:
1. VWAP (Volume Weighted Average Price)
This is the base indicator that calculates the average price weighted by volume over a session or specified period.
VWAP serves as the core reference price level around which volatility adjustments are made for AVWAP.
2. ATR (Average True Range)
ATR measures market volatility, representing the average price range over a set period.
ATR is used to create volatility bands or buffers around the VWAP, adjusting levels to reflect prevailing market volatility.
How These Indicators Work Together for AVWAP:
Use VWAP to establish your average price line weighted by volume.
Calculate ATR to understand the average price movement range.
Apply ATR as multipliers to VWAP to create upper and lower volatility-adjusted bands (e.g., VWAP ± 1 × ATR), which form the AVWAP bands.
These bands help identify volatility-aware support/resistance and stop-loss placement zones.
So to make things easier I have built a custom AVWAP indicator to be used
How to use my custom indicator:
The central blue line is the VWAP.
The red and green bands above and below VWAP are AVWAP bands set at VWAP ± 1.5 × ATR by default.
Adjust the ATR length and multiplier inputs to suit the timeframe and volatility preferences.
Use the bands as dynamic support/resistance and for setting stop loss zones based on volatility.

Money Flow Index + VWAP Trend FilterThis indicator combines the volume-weighted momentum analysis of the Money Flow Index (MFI) with the trend-filtering capabilities of the Volume Weighted Average Price (VWAP) to generate reliable buy and sell signals. By requiring MFI overbought/oversold conditions to align with the trend direction relative to VWAP, this indicator reduces false signals, making it ideal for trading on timeframes like 5-minute to 4-hour charts.
How It Works
The indicator uses two technical components to produce signals:
Money Flow Index (MFI) for Momentum Extremes:
The MFI, calculated over a default 14-period length, measures buying and selling pressure using price and volume data. A buy signal is triggered when MFI crosses above the oversold level (default: 20), indicating potential buying pressure, while a sell signal occurs when MFI crosses below the overbought level (default: 80), suggesting selling pressure.
Volume Weighted Average Price (VWAP) for Trend Direction:
The VWAP calculates the average price of an asset, weighted by volume, resetting at the start of each trading session (e.g., daily for stocks). It acts as a dynamic support/resistance level. A bullish trend is confirmed when the price is above the VWAP, and a bearish trend when the price is below the VWAP. This ensures MFI signals are filtered to align with the broader trend direction, plotted as a purple line on the chart.
Signal Generation
Signals are generated using the previous bar’s values to prevent repainting:
Buy Signal: The MFI crosses above the oversold level, and the price is above the VWAP (bullish trend). Displayed as a green upward triangle below the bar.
Sell Signal: The MFI crosses below the overbought level, and the price is below the VWAP (bearish trend). Displayed as a red downward triangle above the bar.

Rolling VWAP - Vhunt Scalper botBINANCE:ADAUSDTPERP
Modified VWAP to use scalping in lower timeframe.
Use 1minute TF for best results but can also use up to 30min.
This indicator is made for crypto but may also work for other assets.
The bands serve as support and resistance and used for opening quick profit position if conditions below are met:
Indicators:
Blue - modified rolling vwap
Orange - Band1
Green - Band2
Opening position Conditions:
Long:
Band2 < Band1
Price < Band2
Short:
Band2 > Band1
Price > Band2

VWAP and IVP Volatility Screener AlertVWAP and IVP Volatility Screener Alert is a multi-asset, institutional-grade market scanner that combines Auto-Anchored VWAP, Implied Volatility Percentile (IVP), Choppiness Index, Strike Price Structure, and Volume Profile (POC / Value Area) to generate high-probability trade signals across multiple symbols.
Designed for traders who rely on volatility regimes, VWAP interactions, trend confirmation, and strike-based price behavior, this tool automatically evaluates up to 10 assets simultaneously and displays actionable BUY/SELL conditions in a unified dashboard and screener panel.
Key Features
1. Multi-Asset Screener (10 Symbols)
Scans FX, indices, commodities, and metals. Displays RSI, ADX, trend, score, volatility regime, VWAP/POC/Value Area position, IVP, and Choppiness. Custom strike increments per asset.
2. Auto-Anchored VWAP System
Auto anchors by Session, Day, Week, Month, or Auto. Includes VWAP bands and bounce detection to show when price is Above, Below, or interacting with VWAP.
3. Volume Profile + POC / Value Area
Generates intraday/session POC, VAH, and VAL. Detects breaks, retests, and bounce signals.
4. IV Percentile (IVP) Engine
Converts realized volatility into IVP and classifies regimes (EXT.HI → EXT.LO). Supports Favorable, Extreme, and High-Volatility modes for different trading styles.
5. Choppiness Index (CHOP)
Identifies trending vs ranging conditions and feeds directly into scoring and alerts.
6. 11-Criteria Alert System
Alert logic includes RSI, ADX, trend, volume, VWAP, POC/VA, strike proximity, std-dev breaks, IVP, CHOP, and score thresholds. Supports Score-Based or Multi-Criteria modes.
7. Price-to-Strike Mapping
Rounds price to the correct strike ladder, detecting reversals, continuation, breakout levels, and helping frame stop-loss/TP zones.
8. Session-Aware Filtering
Filters signals for Asian, London, and NY sessions with custom timezone support.

Jose's Rolling VWAP with BandsRolling VWAP with Customizable Deviation Bands
This indicator plots a rolling Volume Weighted Average Price (VWAP) over a user-defined lookback period, rather than resetting each day or from a fixed anchor point. The rolling calculation makes it act more like a moving average — but weighted by volume — providing a smoother, more adaptive central price line.
It also includes up to three optional deviation bands, which can be independently toggled on/off and assigned their own multipliers. These bands are calculated using the chosen lookback’s standard deviation, giving traders a quick visual of price dispersion around VWAP.
Features:
Adjustable rolling VWAP lookback length
Up to 3 customizable standard deviation bands
Individual checkboxes for enabling/disabling each band
Independent multiplier control for each band
Works on any timeframe and symbol
Uses:
Identify overextended price moves relative to VWAP
Spot dynamic support/resistance zones
Gauge mean reversion opportunities
Confirm trend strength when price hugs or breaks away from VWAP