SB Dynamic VWAPCreated this script that creates a dynamic VWAP based on Outstanding Shares Turnover.
The outstanding shares turnover is determined by volume. If the volume exceeds outstanding shares over X amount of days, X amount is used as the VWAP period.
Also included visually is the Bollinger Bands for price and volatility reference.
ابحث في النصوص البرمجية عن "VWAP"

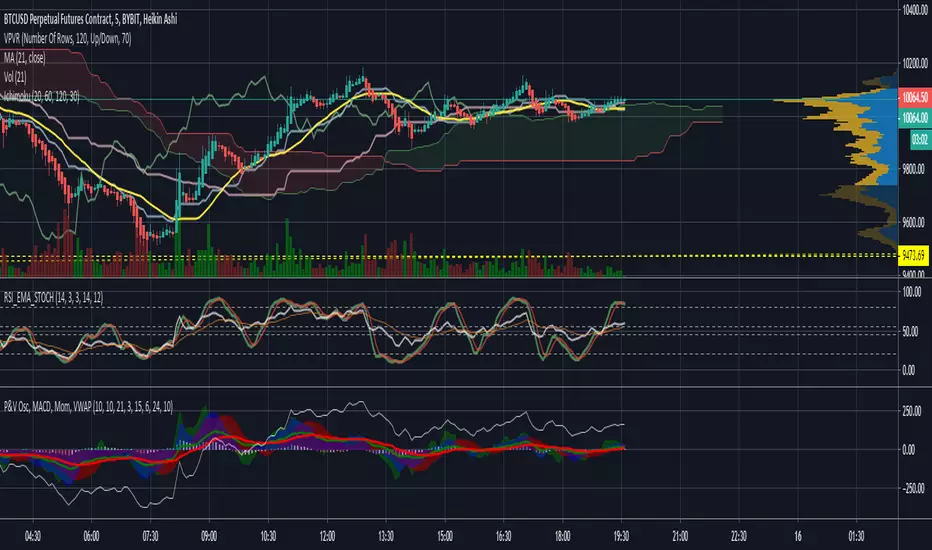
MACD VWAP IndicatorThis indicator uses a combination of the VWAP, EMA 9 and parts of the MACD in order to detect a bullish or bearish trend.
How to trade it:
Set SL either below or above the VWAP line (orange) and TP to 1:1.5 ratio (depending on last few candles, of course).
If EMA200 is close by then place SL either below or above EMA200 (blue) and TP to 1:1.5 ratio
Important:
Best traded in 15M, 30M => Intraday.
Have fun! :)

Anchored VWAP w/ Stdev and VWMA CloudThis is a fun little project that allows you to anchor the Volume Weighed Average Price (VWAP) to a specific day and plot up to 4 standard deviations up or down.
I've also added a Volume Weighted Moving Average (VWMA) plot and accompanying cloud to more easily visualize how volume-based momentum affects trends.
Typically, you'll see price respecting the VWMA Cloud and can expect price bounces off of the VWAP standard deviations.
When setting the initial anchor point, it's best to select a day with high volume and volatility.
This idea is not 100% original, but I couldn't find 1) a public script combining the ideas and 2) the correct plotting of the standard deviation via accumulation.
Happy Trading!
FAQ
Why is your script Protected?
Users like to take my open-source code and charge to use it without my permission.
How do I use this to trade?
Add it to your chart and see what stacks up with your current setup. I trade Forex, so what looks bad on my charts might look golden on yours.
How long have you been doing this?
I've been coding for about 8 years and actively trading for 2 years. My degree is in Robotics Engineering and I became obsessed with investing at 22.
How do you trade?
Hurst + SNR + MESA MAMA + ATR + LSTM + Pure Grid. You can't completely code this setup using Pinescript, but if you learn C++ or Python you're there!
Are your returns good?
I average 0.68% every weekday or 22.65% monthly, using the method above.
Can you build my indicator or strategy?
Absolutely! If it hasn't been done before and it improves our community, then consider it done.
But can you build an indicator or strategy for me and only me?
Citing the house rules, I cannot solicit for any purpose. So saying "PM me" would be a grievous violation of said rules, obviously.

5min vwap in Multi Time FramesThis indicator will show the 5Min intraday VWAP onto any other timeframe. I like to see where the 5min VWAP is while on the 1Min chart for example.
VWAP + EMA9 + RSI Scalping (Edu)VWAP + EMA9 + RSI Scalping (Edu) is an intraday scalping indicator combining VWAP, EMA9 and RSI to identify high-probability long and short entries. Designed for low timeframes (1m–5m), it aligns micro-trend and momentum to generate clean and fast setups. Works on stocks, indices, forex and crypto.

VWAP + Scaled VIX OverlayVWAP-VIX Fusion Overlay helps traders interpret volatility in real time by placing VIX and VWAP where they belong: side-by-side with price action.
It turns the invisible (fear, volatility pressure, momentum shifts) into something clearly visible — making entries, exits, and trend evaluation easier and more accurate.

Multi-Period Rolling VWAPMulti-Period Rolling VWAP (MP-RVWAP)
This indicator plots multiple Rolling Volume-Weighted Average Price (RVWAP) lines over different time periods (7, 14, 30, 60, 90, 180, and 360 days) on a single chart. Each RVWAP is calculated using a user-defined timeframe and source (default: HLC3), ensuring consistency across chart resolutions.
Key Features:
Customizable Periods: Toggle visibility for each period (7d, 14d, 30d, 60d, 90d, 180d, 360d) and adjust their colors.
Labels: Each RVWAP line is labeled at the end (e.g., "7d", "360d") for easy identification.
Standard Deviation Bands: Optional bands can be added above and below each RVWAP, with customizable multipliers (set to 0 to hide).
Flexible Timeframe: Define a single timeframe (default: 1D) for all RVWAP calculations, independent of the chart’s timeframe.
Minimum Bars: Set a minimum number of bars (default: 10) to ensure reliable calculations.
Usage:
Ideal for traders analyzing price trends across multiple time horizons. Enable/disable specific RVWAPs, tweak colors, and add bands to suit your strategy.

Bollinger Bands Scalper + VWAPGet more consistent scalps by trading in-between Bollinger Band Deviations.
FEATURES:
1) 3 Bollinger Bands with default settings to 1, 2, and 3 deviations for more consistent scalps
2) Trendicator: a dynamic color changing moving average that helps you see trend quickly
3) Robust VWAP tool with up to 3 different deviations as well as different anchor points to help you see strong support and resistances
4) Calming "purple cloud" color palette helps you focus on price action
5) Discover new trading strategies with a wide range of customizability

CCI+MACD+VWAP+BreakoutDesign for LONG and Day Trade only
- Identify buy and sell signal using CCI
- Green Zone when
-- Price over VWAP
-- EMA9 > EMA50 > EMA200
-- MACD fast > MACD slow
- Yellow Zone when either one failed
- White line occurs when breakout of Higher High + Higher Low

EmperorBTC's VWAP IndicatorThis indicator was created after EmperorBTC's conditions. Conditions displayed below:
Good timeframes for it: 30', 15', 5'
To convert from strategy to study switch the commented lines in the beginning and at the end of the script
What this indicator does is:
1) Check if Pivot Point was crossed
2) Stoch-RSI and VWAP were crossed up in current or previous candle
3) Candle (or previous candle) is green
Then, it will plot a Long opportunity.
FUTURE IDEAS:
- Volume Expansion
- Candle Stick patterns
NK's Hilega-Milega (Swanidhi) RSI/WMA/EMA + VWAPThe indicator is inspired by inputs from Mr. Nitish Kumar.
It also takes into account VWAP but only if the current time frame is intraday, i.e less than 1D.
I hope this indicator will help a lot of retail investor save their hard earned money in the stock market and benefit from Mr. NK's strategy.
When blue - Go long.
When red - Go short.
Best,
Swan

Flunki VWAP minus MA OscillatorHerewith a simple oscillator that show the difference in price between a Moving Average of the price, and the current VWAP
This show as a histogram
On top of that is a Moving Average of the histogram value, shown as a blue / red line with an option to hight these crossing and also crossing zero
Simple idea ; code open.

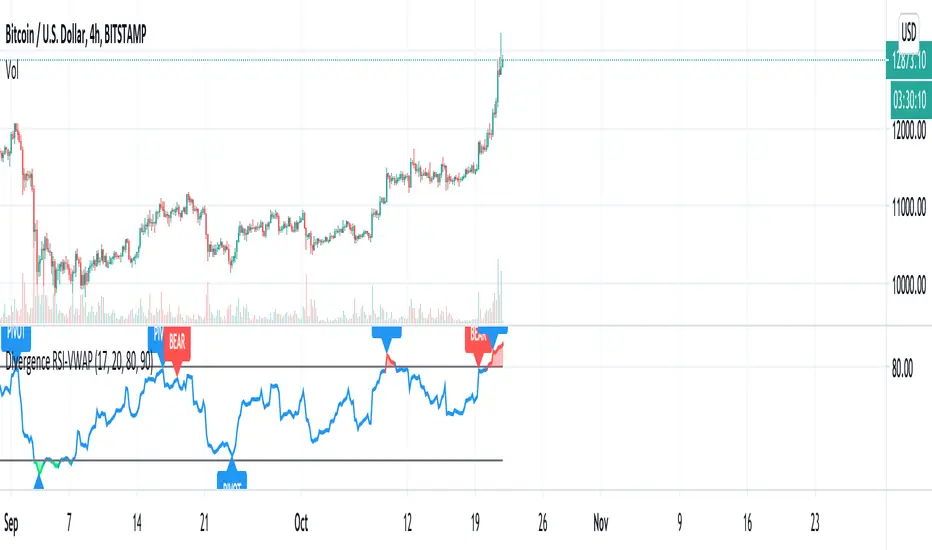
Divergence RSI-VWAPCombination of the script from XaviZ of RSI-VWAP and divergence detector from Libertus.
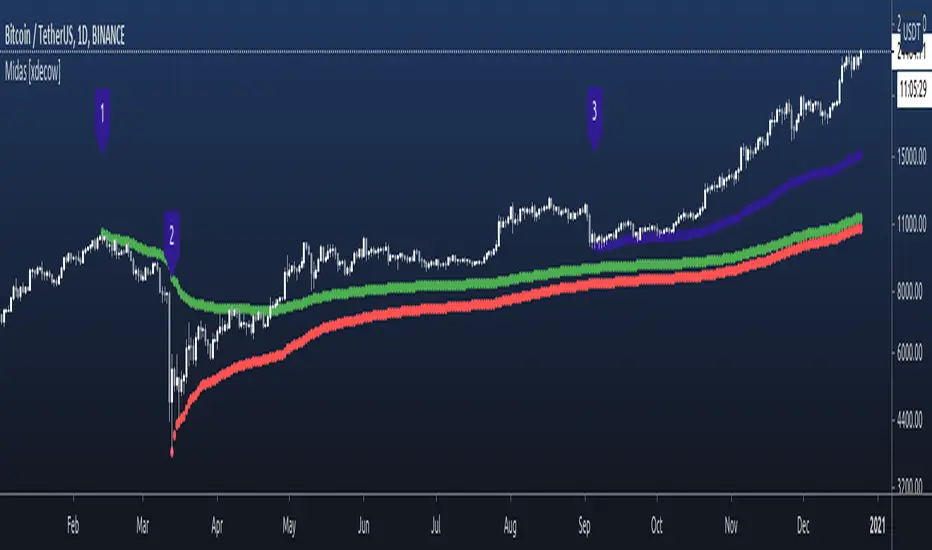
Midas 6 Anchored VWAP [xdecow]This script plots 6 anchored vwap from the selected bars.
The labels are only to help identify the starting points and can be disabled in the options.
MMDVZ 1.0 - Moving Multi-Day VWAP ZonesVolatility adjusted moving multi-day VWAP zones
Directionality, trend and support/resistance levels at a glance
Useful for trading practically all kinds of stocks and futures.
Works well with many timeframes.
More updates to come, stay tuned

Anchored VWAP & Standard DeviationsCalculates VWAP from a fixed point in time as well as standard deviations.
--------------------------------------
If you find it useful please consider a tip/donation :
BTC - 3BMEXEDyWJ58eXUEALYPadbn1wwWKmf6sA
--------------------------------------
All Time VWAP & Standard DeviationsAll time VWAP and standard deviations.
Either enable "scale price chart only" or disable deviations that go negative in the style options.
--------------------------------------
If you find it useful please consider a tip/donation :
BTC - 3BMEXEDyWJ58eXUEALYPadbn1wwWKmf6sA
--------------------------------------