Volume-Price Shift Box (Lite Version)Description
This indicator is a clean and intuitive visual tool designed to help traders quickly assess the current balance of bullish and bearish forces in the market.
It combines volume, price movement, VWAP, and OBV dynamics into a compact on-chart table that updates in real time.
This version focuses on the core logic and visualization of momentum and volume shifts, making it ideal for traders who want actionable insight without complex configuration.
How It Works
The script measures the combined strength of multiple market components:
VWAP trend indicates price bias relative to fair value.
OBV (On-Balance Volume) tracks volume flow to confirm or contradict price movement.
Volume ratio compares current volume to its recent average.
Momentum evaluates directional price movement over a configurable lookback period.
Accumulation / Distribution (A/D) Line estimates buying or selling pressure within each candle:
↑ — A/D is rising (buying pressure is increasing)
↑↑ — A/D is rising faster than before (acceleration of buying)
↓ — A/D is falling (selling pressure is increasing)
↓↓ — A/D is falling faster than before (acceleration of selling)
Each of these components contributes to an overall shift score.
Depending on this score, the box displays:
🟢 Bullish Shift — strong upward alignment
🔴 Bearish Shift — downward alignment
⚪ Neutral — mixed or indecisive conditions
Key Features
Compact on-chart information box with color-coded parameters
Combined volume-price relationship model
Configurable lookback and sensitivity controls
Real-time shift strength and trend duration tracking
Adjustable EMA/SMA smoothing for all averages
Lightweight design optimized for clarity
Inputs Overview
Box Position / Size – Place and scale the on-chart info box
Lookback Period – Number of bars used for calculations
VWAP Lookback – Period for VWAP distance smoothing
Shift Sensitivity – Adjusts reaction strength of bullish/bearish shifts
Neutral Zone Threshold – Defines when the market is considered neutral
EMA or SMA – Choose exponential or simple moving averages
Component Weights – Set the influence of VWAP, OBV, Volume, and Momentum on the shift score
Display Toggles – Enable or disable metrics shown in the box (Strength, Volume, VWAP, Duration, OBV)
How to Use
Apply the indicator to any symbol and timeframe.
Observe the box on the chart — it updates dynamically.
Look for transitions between Neutral → Bullish or Neutral → Bearish shifts.
Combine with your existing price action or confirmation tools (e.g., support/resistance, trendlines).
Use the “Strength” and “Duration” values to assess consistency and momentum quality.
(This indicator is not a buy/sell signal generator — it is designed as a contextual analysis and confirmation tool.)
How It Helps
Merges several key volume and price metrics into a single view
Highlights transitions in market control between buyers and sellers
Reduces clutter by presenting only relevant context data
Works on any market and timeframe, from scalping to swing trading
⚠️Disclaimer:
This script is provided for educational and informational purposes only. It is not financial advice and should not be considered a recommendation to buy, sell, or hold any financial instrument. Trading involves significant risk of loss and is not suitable for every investor. Users should perform their own due diligence and consult with a licensed financial advisor before making any trading decisions. The author does not guarantee any profits or results from using this script, and assumes no liability for any losses incurred. Use this script at your own risk.
ابحث في النصوص البرمجية عن "VWAP"

ORB + Session VWAP Pro (London & NY) — fixedORB + Session VWAP Pro (London & NY) — Listing copy (EN)
What it is
A clean, non-repainting intraday tool that fuses the classic Opening Range Breakout (ORB) with a session-anchored VWAP filter for London and New York. It highlights only the higher-quality breakouts (above/below session VWAP), adds an optional retest confirmation, and scores each signal with an intuitive Confidence metric (0–100).
Why it works
• ORB provides the day’s first actionable structure (range high/low).
• Session VWAP filters “cheap” breaks and favors flows aligned with session value.
• Optional retest reduces first-tick whipsaws.
• Confidence blends breakout depth (vs ATR), VWAP slope and band distance.
Key visuals
• LDN/NY OR High/Low (line break style) + optional OR boxes.
• Active Session VWAP (resets per signal window; falls back to daily VWAP outside).
• Optional VWAP bands (stdev or %).
• Session shading (London/NY windows).
• Signal markers (LDN BUY/SELL, NY BUY/SELL) fired with cooldown.
Signals
• London Long / Short: Break of LDN OR High/Low ± ATR buffer, aligned with VWAP side.
• NY Long / Short: Same logic during NY window.
• Retest (optional): Requires a tag back to the OR level ± tolerance before confirmation.
• Confidence: 0–100; gate via Min Confidence (default 55).
Inputs that matter
• Open Range Length (min): Default 15.
• London/NY times & timezones.
• ATR buffer & retest tolerance.
• Bands mode: Stdev (with lookback) or % (e.g., 1%).
• Signal cooldown: Avoids clutter on fast moves.
Non-repaint policy
• OR lines build within fixed time windows using the current bar’s timestamp.
• VWAP is cumulative within the session window; no lookahead.
• All ta.crossover/ta.crossunder are precomputed every bar (no conditional execution).
• Signals are based on live bar values, not future bars.
⸻
Quick start (examples)
1) EURUSD, London momentum
• Chart: 5m or 15m.
• OR: 15 min starting 08:00 Europe/London.
• Signals: Use defaults; keep ATR buffer = 0.2 and Retest = ON, Min Confidence ≥ 55.
• Play:
• BUY when price breaks LDN OR High + buffer and stays above VWAP; retest confirms.
• Trail behind VWAP or band #1; partials into band #2.
2) NAS100, New York breakout & run
• Chart: 5m.
• NY window: 09:30 America/New_York, OR = 15 min.
• Retest OFF on high momentum days; Min Confidence ≥ 60.
• Use band mode Stdev, bandLen=50, show ±1/±2.
• Momentum continuation: add on pullbacks that hold above VWAP after the breakout.
3) XAUUSD, London fake & VWAP fade
• Chart: 5m.
• Keep Retest ON; accept only shorts that break OR Low but retest fails back under VWAP.
• Confidence gate ≥ 50 to allow more mean-reversion setups.
⸻
Pro tips
• Adjust ATR buffer to the instrument: FX 0.15–0.25, indices 0.20–0.35, metals 0.20–0.30.
• Retest ON for choppy conditions; OFF for news momentum.
• Use VWAP bands: take partials at ±1; stretch targets at ±2/±3.
• Session timezones are explicit (London/New York). Ensure they match your instrument’s behavior.
• Pair with a higher-TF bias (e.g., 1H/4H trend) for directional filtering.
⸻
Alerts (ready to use)
• ORB+SVWAP — LDN Long, LDN Short, NY Long, NY Short
(Respect your cooldown; alerts fire only after confirmation and confidence gate.)
⸻
Known limits & notes
• Designed for intraday. On 1D+ charts, session windows compress.
• If your broker session differs from London/NY clocks on a holiday, adjust input times.
• Session-anchored VWAP uses the script’s signal window, not exchange sessions, by design.

Head Hunter HHHead Hunter HH - Advanced Market Structure & Volume Analysis Indicator
This indicator combines volume analysis, price action, and VWAP to identify high-probability trading opportunities across multiple timeframes.
Key Features:
• Smart Volume Analysis: Detects institutional volume patterns using dynamic thresholds
• VWAP-Based Market Structure: Multiple standard deviation bands for precision entry/exit
• Daily Level Integration: Previous day's high, low, close, and current day's open
• Advanced Signal Classification: Regular, Super Strong, and Scalp signals
Signal Types:
1. Regular Signals (White/Purple Triangles)
• Volume-confirmed reversals
• Institutional price levels
• Technical momentum alignment
2. Super Strong Signals (Green/Red Diamonds)
• High-volume breakouts
• Strong momentum confirmation
• Multiple timeframe alignment
3. Scalp Signals (Green/Magenta Circles)
• Quick reversal opportunities
• VWAP deviation analysis
• Volume surge confirmation
Visual Components:
• VWAP with Standard Deviation Bands
• 50 MA (optional)
• Daily Reference Levels
• Color-coded signals based on strength
• Bar color changes on confirmed signals
Best Practices:
• Most effective on higher timeframes (1H+)
• Use with major pairs/instruments
• Combine signals with support/resistance
• Monitor volume confirmation
• Wait for candle close confirmation
This indicator helps identify institutional order flow and high-probability reversal zones by analyzing volume patterns, price action, and market structure, providing traders with multiple confirmation layers before entry.
Note: Results may vary based on market conditions and timeframe selection. Always use proper risk management.

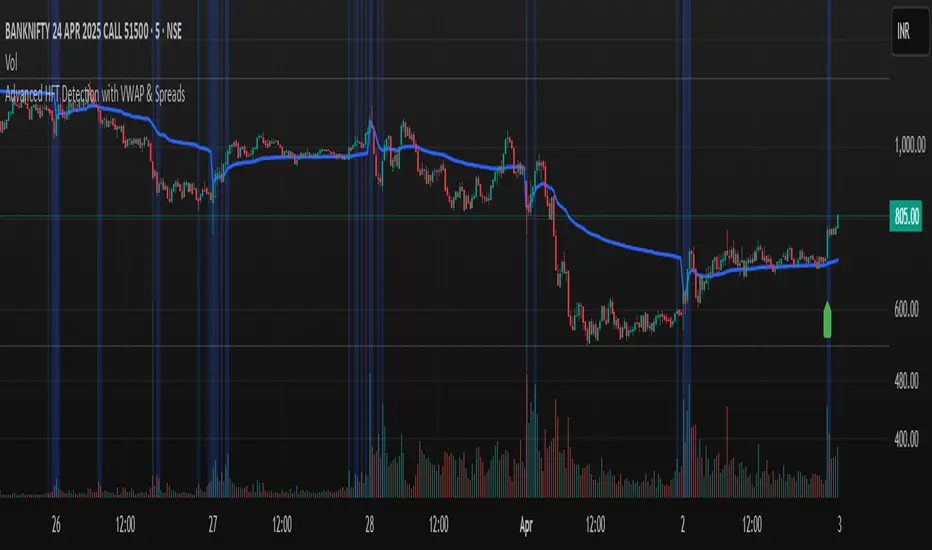
Advanced HFT Detection with VWAP & SpreadsExplanation of the HFT Detection Strategy
🔹 1. Key Indicators Used in the Strategy
It's works by combining VWAP, moving averages (SMA), volume spikes, and price jumps to detect potential HFT activity.
✅ (A) VWAP (Volume Weighted Average Price)
VWAP acts as a benchmark price that professional traders and institutions use to execute large orders.
If price is above VWAP, buyers are in control → Bullish trend
If price is below VWAP, sellers are in control → Bearish trend
HFT algorithms often place buy orders above VWAP and sell orders below VWAP to follow momentum.
➡️ Why VWAP? It ensures that signals follow the institutional trading trend.
✅ (B) Moving Averages (SMA)
Moving averages smooth out price data and help in detecting short-term momentum changes.
Fast Moving Average (5-period SMA): Reacts quickly to price changes
Slow Moving Average (20-period SMA): Identifies trend direction
➡️ Why SMA? It filters noise and confirms short-term trend shifts.
✅ (C) Volume Spike Detection
High-frequency trading is often accompanied by large volume surges. We define a volume spike as:
📌 Current Volume > 2× Average Volume of last 20 bars
➡️ Why Volume? HFTs execute rapid buy/sell orders when they detect liquidity, leading to sudden volume bursts.
✅ (D) Price Jump Detection (Sudden Volatility)
HFT algorithms often exploit quick price movements. We check if the price has moved more than twice the ATR (Average True Range) in the last 5 bars.
➡️ Why ATR? It helps to detect abnormal price movements compared to normal volatility.
🔹 2. Trading Signal Logic
Now that we have VWAP, moving averages, volume, and price movement filters, we generate buy and sell signals based on conditions.
✅ (A) Buy Signal Condition
A BUY signal is triggered when:
✔ Fast SMA crosses above Slow SMA → Short-term trend is turning bullish
✔ Volume spike occurs → HFTs are active
✔ Sudden price jump detected → High volatility
✔ Price is above VWAP → Confirms bullish trend
➡️ Why this works? It confirms that institutional traders & HFTs are buying aggressively.
✅ (B) Sell Signal Condition
A SELL signal is triggered when:
✔ Fast SMA crosses below Slow SMA → Short-term trend is turning bearish
✔ Volume spike occurs → HFTs are selling aggressively
✔ Sudden price drop detected → High volatility
✔ Price is below VWAP → Confirms bearish trend
➡️ Why this works? It confirms that institutional traders & HFTs are selling aggressively.
🔹 3. Visual Representation (Plotting Signals & VWAP)
Once we detect buy and sell signals, we mark them on the chart.
✅ (A) Buy/Sell Markers
🟢 Buy → Green upward arrow below the candle
🔴 Sell → Red downward arrow above the candle
✅ (B) VWAP Line on Chart
We also plot VWAP as a blue line to visualize trend direction.
✅ (C) Highlighting Volume Spikes
To easily spot HFT activity, we highlight volume spike bars with a blue background.
🔹 4. How to Use This Strategy?
1️⃣ Apply this script on a 1-minute or 5-minute intraday chart.
2️⃣ Look for BUY signals above VWAP and SELL signals below VWAP.
3️⃣ Verify that the volume spikes before taking action.
4️⃣ Use stop-loss & risk management (e.g., stop-loss at recent low/high).
🚀 Summary: Why This Strategy Works?
✅ VWAP ensures we follow institutional traders
✅ Volume spikes confirm sudden liquidity inflows
✅ Price jumps detect fast market moves caused by HFT bots
✅ Moving averages smooth out short-term trend shifts
TrendWave VWAP Indicator with ATR-based SignalsThe TrendWave VWAP Indicator with ATR-Based Signals is a robust TradingView tool for traders who prioritize precision and adaptability. This indicator combines the Volume-Weighted Average Price (VWAP) with the Average True Range (ATR) to provide actionable entry and exit signals while dynamically filtering out sideways market conditions. Designed with flexibility in mind, the indicator offers extensive customization options to tailor signals and filtering to individual trading styles.
Key Features and Customizable Settings
VWAP Integration
VWAP offers a volume-weighted benchmark, ideal for tracking price trends in relation to average trading levels. Customization: Traders can enable or disable VWAP functionality via a toggle, allowing easy adjustments based on market conditions or strategy preferences.
ATR-Based Signal Levels
ATR provides volatility-based levels for precise entry and exit points by measuring average price range. Customization: Traders can set the ATR length (default: 14) and the multiplier (default: 1.5) for adjusting sensitivity. A sideways threshold can be set to control the ATR value at which the indicator pauses signals, helping to avoid low-volatility markets.
Signal Cooldown
To reduce noise in choppy conditions, a signal cooldown enforces a minimum number of bars between signals. Customization: The cooldown period (default: 10 bars) can be adjusted to match preferred trading frequency and discipline requirements.
Signal Logic
Long Entry: Activated when price crosses above the VWAP in a trending market. Cooldown applies to avoid consecutive signals.
Long Exit: Triggered when price crosses below the VWAP.
Short Entry: Initiated when price crosses below the VWAP, in non-sideways conditions.
Short Exit: Occurs when price crosses back above the VWAP following a short position.
Visual Indicators
The VWAP is displayed as a line on the chart for easy trend reference. Entry and exit signals are clearly marked with color-coded shapes, enhancing readability without clutter.
Practical Application
The TrendWave VWAP Indicator with ATR-Based Signals provides tailored entries and exits for trending markets. Its customization options make it suitable for traders who require flexibility and precision in varying market conditions. By adjusting VWAP, ATR, and cooldown parameters, users can fine-tune the indicator to suit different trading styles, making it an essential tool for disciplined trading in dynamic markets.

Triple VWAP# Triple VWAP Indicator
## Description
The Triple VWAP Indicator is a powerful tool for traders who rely on Volume Weighted Average Price (VWAP) in their analysis. This indicator displays three VWAP lines on a single chart, each representing a different time frame: Session, Weekly, and Monthly.
## Features
- Session VWAP (Blue Line): Resets daily, providing intraday volume-weighted average price.
- Weekly VWAP (Green Line): Resets weekly, offering a medium-term perspective.
- Monthly VWAP (Red Line): Resets monthly, giving a longer-term view of price action relative to volume.
## How It Works
The indicator calculates the VWAP for each time frame separately, using the specified price source (default is HLC3). It then plots these values on your chart, allowing you to see how the current price compares to the volume-weighted average across different time periods.
## Use Cases
- Multi-timeframe Analysis: Compare short-term price movements against longer-term trends.
- Support and Resistance: VWAP lines often act as dynamic support/resistance levels.
- Mean Reversion: Identify potential overbought or oversold conditions when price deviates significantly from VWAP.
- Trend Confirmation: Use multiple VWAP lines to confirm trend strength and potential reversals.
## Customization
Users can customize the indicator by changing the price source and offset in the settings. The color and thickness of each VWAP line can also be adjusted in the code for personal preference.
## Note
This indicator is most effective on intraday charts but can provide valuable insights on any time frame. Remember that VWAP is typically most relevant for institutional traders on a session-by-session basis.
Enhance your trading strategy with the Triple VWAP Indicator – a versatile tool for comprehensive price-volume analysis across multiple time frames.

Multi VWAP for Wick HunterCredit: honeybadgermakesfunnymoney for this Open Source Script
Published:
This is a tool that will allow you to visualize Wick Hunter's calcation of VWAP. Wick Hunter uses this calcuation for its Liqudations Bots.
There are four settings that you need to be configured to visualize your VWAP Band:
Long VWAP - The distance from current VWAP price, in %, that price must be UNDER when a liquidation event occurs to meet your you VWAP condition. The higher the value, the more price must move below the current VWAP price for it to enter a LONG position.
Short VWAP - The distance from current VWAP price, in %, that price must be ABOVE when a liquidation event occurs to meet your you VWAP condition. The higher the value, the more price must move above the current VWAP price for it to enter a SHORT position.
VWAP Timeframe - Select the timeframe you want the VWAP to be measured on.
VWAP Periods: Input the time period over which you want the VWAP to be measured over. For example, if you use "5" for this and "15" for VWAP Timeframe. The VWAP will be calculated based on the last five 15 minute candles.
You can play around with these settings using the indicator provide above. The indicator will print a triangle when the conditon for VWAP is met for a long for short trade. Play around with these settings. A few good timeframes that are popular are 5 minute, 15 minute, and one hour (60 minute). As far as periods, the most common settings are between 5 periods and 15 periods. In general the lower the timeframe and periods and closer VWAP will follow price.

MTF VWAP + Candlestick VWAP Reactions (Bounce + Score)It’s an intraday VWAP + candlestick confluence tool that:
Draws daily, weekly, monthly, yearly VWAPs.
Detects textbook candlestick patterns, classed as BuH/BuM (bullish high/moderate) and BeH/BeM (bearish high/moderate) with colored boxes.
Triggers long/short arrows only when price bounces off a VWAP by at least 0.15% AND there’s a recent matching pattern.
Grades every signal as A / B / C with a score 1–10:
A (8–10) = high-reliability pattern (BuH/BeH) + strong 2-candle body reaction (your A+ setups).
B (5–8) = moderate pattern (BuM/BeM) + one solid bounce.
C (1–5) = weaker / mixed context (scalpy or gamble).

RSI VWAP v1 [JopAlgo]RSI VWAP v1.1 made stronger by volume-aware!
We know there's nothing new and the original RSI already does an excellent job. We're just working on small, practical improvements – here's our take: The same basic idea, clearer display, and a single, specially developed rolling line: a VWAP of the RSI that incorporates volume (participation) into the calculation.
Do you prefer the pure classic?
You can still use Wilder or Cutler engines –
but the star here is the VW-RSI + rolling line.
This RSI also offers the possibility of illustrating a possible
POC (Point of Control - or the HAL or VAL) level.
However, the indicator does NOT plot any of these levels itself.
We have included an illustration in the chart for this!
We hope this version makes your decision-making easier.
What you’ll see
The RSI line with a 50 midline and optional bands: either static 70/30 or adaptive μ±k·σ of the Rolling Line.
One smoothing concept only: the Rolling Line (light blue) = VWAP of RSI.
Shadow shading between RSI and the Rolling Line (green when RSI > line, red when RSI < line).
A lighter tint only on the parts of that shadow that sit above the upper band or below the lower band (quick overbought/oversold context).
Simple divergence lines drawn from RSI pivots (green for regular bullish, red for regular bearish). No labels, no buy/sell text—kept deliberately clean.
What’s new, and why it helps
VW-RSI engine (default):
RSI can be computed from volume-weighted up/down moves, so momentum reflects how much traded when price moved—not just the direction.
Rolling Line (VWAP of RSI) with pure VWAP adaptation:
Low volume: blends toward a faster VWAP so early, thin starts aren’t missed.
Volume spikes: blends toward a slower VWAP so a single heavy bar doesn’t whip the curve.
You can reveal the Base Rolling (pre-adaptation) line to see exactly how much adaptation is happening.
Adaptive bands (optional):
Instead of fixed 70/30, use mean ± k·stdev of the Rolling Line over a lookback. Levels breathe with the market—useful in strong trends where static bounds stay pinned.
Minimal, readable panel:
One smoothing, one story. The shadow tells you who’s in control; the lighter highlight shows stretch beyond your lines.
How to read it (fast)
Bias: RSI above 50 (and a rising Rolling Line) → bullish bias; below 50 → bearish bias.
Trigger: RSI crossing the Rolling Line with the bias (e.g., above 50 and crossing up).
Stretch: Near/above the upper band, avoid chasing; near/below the lower band, avoid panic—prefer a cross back through the line.
Divergence lines: Use as context, not as standalone signals. They often help you wait for the next cross or avoid late entries into exhaustion.
Settings that actually matter
RSI Engine: VW-RSI (default), Wilder, or Cutler.
Rolling Line Length: the VWAP length on RSI (higher = calmer, lower = earlier).
Adaptive behavior (pure VWAP):
Speed-up on Low Volume → blends toward fast VWAP (factor of your length).
Dampen Spikes (volume z-score) → blends toward slow VWAP.
Fast/Slow Factors → how far those fast/slow variants sit from the base length.
Bands: choose Static 70/30 or Adaptive μ±k·σ (set the lookback and k).
Visuals: show/hide Base Rolling (ref), main shadow, and highlight beyond bands.
Signal gating: optional “ignore first bars” per day/session if you dislike open noise.
Starter presets
Scalp (1–5m): RSI 9–12, Rolling 12–18, FastFactor ~0.5, SlowFactor ~2.0, Adaptive on.
Intraday (15m–1H): RSI 10–14, Rolling 18–26, Bands k = 1.0–1.4.
Swing (4H–1D): RSI 14–20, Rolling 26–40, Bands k = 1.2–1.8, Adaptive on.
Where it shines (and limits)
Best: liquid markets where volume structure matters (majors, indices, large caps).
Works elsewhere: even with imperfect volume, the shadow + bands remain useful.
Limits: very thin/illiquid assets reduce the benefit of volume-weighting—lengthen settings if needed.
Attribution & License
Based on the concept and baseline implementation of the “Relative Strength Index” by TradingView (Pine v6 built-in).
Released as Open-source (MPL-2.0). Please keep the license header and attribution intact.
Disclaimer
For educational purposes only; not financial advice. Markets carry risk. Test first, use clear levels, and manage risk. This project is independent and not affiliated with or endorsed by TradingView.

EMA 8/21 Crossover Alert IndicatorOverview of the Indicator
This is a custom Pine Script v5 indicator for TradingView titled "EMA 8/21/50 + VWAP Crossover Alert Indicator" (short title: "EMA+VWAP Cross Alert"). It's designed as an overlay indicator, meaning it plots directly on your price chart rather than in a separate pane. The primary purpose is to detect and alert on crossovers between the 8-period Exponential Moving Average (EMA) and the 21-period EMA, which can signal potential bullish or bearish momentum shifts. These are classic short-term trend reversal or continuation signals often used in trading strategies like momentum or swing trading.
To enhance analysis, it also includes:
A 50-period EMA for medium-term trend context (e.g., to confirm if the overall trend aligns with the crossover).
A Volume Weighted Average Price (VWAP) line, which provides a benchmark for the average price weighted by volume, useful for identifying intraday value areas or fair price levels.
The indicator works across all timeframes (e.g., Daily, 4H, 1H, 15M, 5M, 3M) because the calculations are based on the chart's current bars and adapt to volatility and data resolution. It's not a trading strategy (no entry/exit logic or backtesting), but an alert tool—signals are visual and can trigger notifications in TradingView. Always combine it with risk management, as crossovers can produce false signals in ranging or choppy markets.
How It Behaves Across Timeframes
Higher Timeframes (e.g., Daily/4H): Fewer crossovers, focusing on major trends. EMAs smooth out noise; VWAP might represent session averages.
Lower Timeframes (e.g., 3M/5M): More frequent signals due to sensitivity, but higher risk of whipsaws. VWAP resets per session, making it great for intraday trading.
Adaptability: All components scale with bar data—no manual adjustments needed, though tweaking inputs can optimize for specific frames.
In TradingView, you can set up these alerts to notify via popup, sound, email, SMS, or webhook (e.g., to a trading bot). Go to the chart's "Alert" button, select this indicator, and choose conditions like "Bullish Cross" or use the script's built-in alerts.

Fixed Date VWAP [victhoreb]**Fixed Date VWAP**
Fixed Date VWAP is a custom TradingView indicator that provides a versatile method for calculating the Volume Weighted Average Price (VWAP) by anchoring the calculation either to a specific fixed date or to a defined period (such as daily, weekly, or monthly). This dual approach allows traders to customize the VWAP based on their preferred time frame, making it ideal for both short-term and long-term analysis.
**Key Features:**
- **Dual Anchoring Options:**
- *Fixed Date:* Begin the VWAP calculation from a user-defined date. The fixed date can be easily selected either by dragging the vertical date bar directly on the chart or through the settings panel.
- *Period:* Reset the calculation at the start of each chosen time frame (e.g., daily, weekly, monthly, etc.).
- **Customizable Deviation Bands:**
Up to three sets of deviation bands are plotted around the VWAP. Each band uses user-defined multipliers to determine its distance from the VWAP, helping to identify potential support, resistance, and volatility areas.
- **Visual Customization:**
Users can adjust the visibility of each band, choose their preferred colors, and enable a fill between the bands for enhanced chart readability.
- **Flexible Anchoring Utility:**
One of the major benefits of Fixed Date VWAP is its ability to adapt the anchor point to significant chart events, such as pivot points, enhancing the relevance of the VWAP in technical analysis.
Whether you're analyzing intraday movements or broader market trends, Fixed Date VWAP offers a dynamic and flexible perspective on price action, supporting more informed and strategic trading decisions.

Money Flow Indicator (Chaikin Oscillator) with VWAPStrategy Overview
Entry Conditions:
Buy Entry:
The Chaikin Oscillator crosses above the signal line.
The current price is above the VWAP.
Sell Entry:
The Chaikin Oscillator crosses below the signal line.
The current price is below the VWAP.
Exit Conditions:
Profit Taking:
Take profit when a target profit is reached (e.g., a 2% increase from the entry price).
Stop Loss:
Set a stop loss, for example, at a 1% decline from the entry price.
Risk Management:
Manage risk by limiting each trade to no more than 1-2% of the account balance.
Calculate position size based on risk and trade accordingly.
Trend Confirmation:
Use other indicators (like moving averages) to confirm the overall trend and focus trades in the direction of the trend.
In an uptrend, prioritize buy entries; in a downtrend, prioritize sell entries.
Specific Trade Scenarios
Example 1: Buy Entry:
Enter a buy position when the Chaikin Oscillator crosses above the signal line and the price is above the VWAP.
Set a stop loss 1% below the entry price and a profit target 2% above the entry price.
Example 2: Sell Entry:
Enter a sell position when the Chaikin Oscillator crosses below the signal line and the price is below the VWAP.
Set a stop loss 1% above the entry price and a profit target 2% below the entry price.
Additional Considerations
Backtesting: Test this strategy with historical data to evaluate performance and make adjustments as needed.
Market Conditions: Pay attention to market volatility and economic indicators, adjusting the trading strategy flexibly.
Psychological Factors: Avoid emotional decisions and follow clear rules when trading.

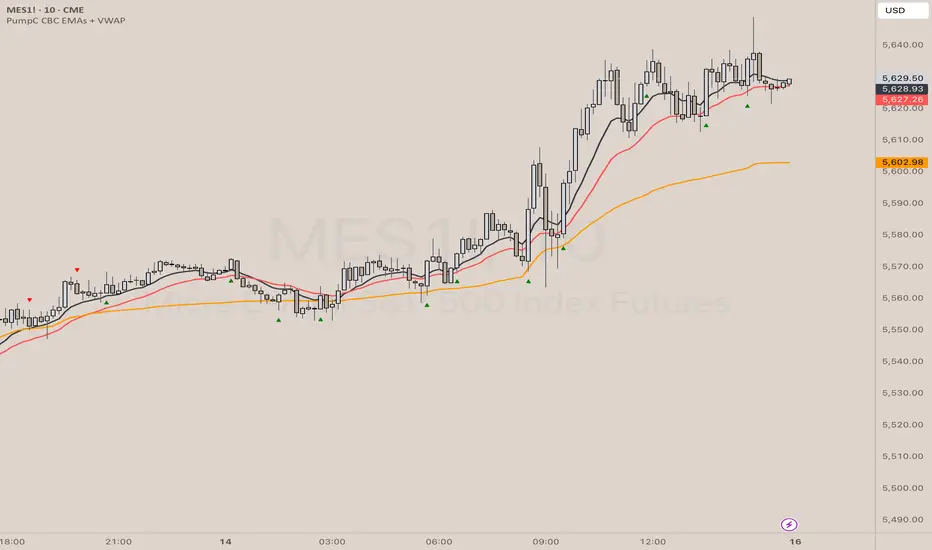
PumpC CBC EMAs + VWAPPumpC CBC EMAs + VWAP Indicator for Tradingview
Introduction
This is an indicator for the Candle By Candle (CBC) Flip strategy , based on the CBC Flip concept taught by MapleStax and inspired by the original CBC Flip indicator by AsiaRoo . The CBC Flip strategy is a simple yet effective approach to gauge if bulls or bears are in control for any given candle.
The logic behind the CBC Flip is as follows:
Bullish Flip : If the most recent candle’s close is above the previous candle’s high, bulls have taken control.
Bearish Flip : If the most recent candle’s close is below the previous candle’s low, bears are now in control.
No Flip : If neither condition is met, the previously dominant side (bulls or bears) remains in control until one of these conditions is satisfied, flipping the market sentiment—hence the name CBC Flip .
The PumpC CBC EMAs + VWAP Indicator enhances this simple strategy by adding trend confirmation filters using EMAs and VWAP , along with time-restricted signal generation and fully customizable alerts.
What Does This Indicator Do?
The PumpC CBC EMAs + VWAP Indicator helps traders identify CBC Flips to spot potential trend continuations or reversals. It combines candlestick logic , trend filters , and time-based restrictions to provide high-probability trade signals.
CBC Flip Detection
Bullish Flip : Current close is above the previous candle’s high.
Bearish Flip : Current close is below the previous candle’s low.
Strict Flips : Require a liquidity sweep for higher accuracy.
All Flips : Looser conditions that generate more frequent signals.
EMA and VWAP Trend Confirmation (Optional)
This filter ensures that long signals only trigger when the Slow EMA is above the VWAP , confirming an upward trend. For short signals, the Slow EMA must be below the VWAP.
Time-Based Filtering
The indicator allows you to set a specific trading window (e.g., 9:00 AM to 3:00 PM), helping you avoid low-volume or high-risk periods.
Visual Labels and Alerts
Labels : Arrows (▲ for long and ▼ for short) mark CBC Flip points on the chart.
Alerts : Fully customizable notifications for each signal type, based on your chosen filters.
Key Features
CBC Flip Detection : Identify potential reversals and trend continuations.
Strict vs. All Flips : Choose between higher-accuracy strict flips or more frequent all flips.
EMA-to-VWAP Filter : Optional trend confirmation filter to reduce false signals.
Customizable EMAs and VWAP : Configure lengths and colors for visual clarity.
Time-Restricted Signals : Focus on your preferred trading session.
Custom Alerts : Notifications for long and short signals based on filter settings.
Credits and Inspiration
The CBC Flip strategy was created by MapleStax .
This indicator is inspired by the original CBC Flip indicator by AsiaRoo .
Additional enhancements include EMA-to-VWAP filtering , custom alerts , and time-restricted signal generation for a more comprehensive trading experience.
Risks and Disclaimer
This indicator is for educational purposes only and does not constitute financial advice.
Trading involves significant risk, and past performance does not guarantee future results. Always test this indicator in a simulated environment before live trading.
MTF Key Levels - Support and ResistanceThis indicator shows how to Multi Time Frame (MTF) interpret levels:
Watch how price acts around these levels and how they can act as support/resistance and can be used as great confluence levels for your technical analysis.
This indicator displays:
VWAP Levels
Daily / Weekly / Monthly / Yearly
Within the chart above I have marked out how displaying these VWAP levels can provide support and resistance levels to be aware of.
Daily – Weekly - Monthly – Yearly Levels
O = Open / H = High / L = Low
pO = Previous Open / pH = Previous High / pL = Previous Low / pEQ = Previous Equlibrium
Having previous Low/High levels makes you aware of Swing Failure Patterns (SFP). Also the daily/weekly/monthly opening and previous opening can assist with the trend.
Daily Open: Gives you an idea who is in control for the day. This level very often acts as strong support or resistance.
Weekly Open: Indicates where the price is within the higher timeframe.
Monthly Open & Yearly Levels: Overview of direction for the whole month without looking at a monthly chart and Yearly chart
Line Options
Within the line options you can choose to have a clean chart and display a “short line”. These line length can be adjusted by the user.
Line just to the right.
Line across the screen.
Disclaimer: The Monthly and Yealy VWAP will only show on higher timeframes this is due to restriction of how many candles can be shown on the chart. The candles displayed need to go back to either the start of the month of year to be able to calculate their VWAPs.

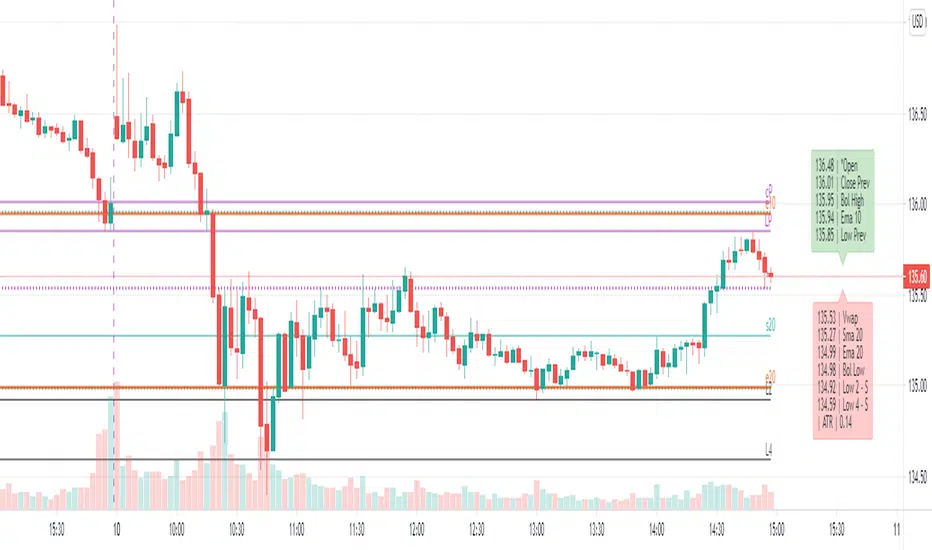
Dynamic levels from higher TF: EMA, SMA, OHLC, Bollinger, Vwap[ AR ] iLevels - indicator is intended for displaying important levels from a current and higher timeframe.
The indicator hides levels if they are far from the current price . The concealment range is based on the ATR * multiplier value. This keeps the graph clean and not shrinking .
Available levels:
- EMA - 5, 10, 20, 50, 100, 200, 300, 400, 500, 1000, 2000
- SMA - 20, 50, 100, 200
- Current day - Open/High/Low/Close
- Prev day - Open/High/Low/Close
- Prev days - Historical Open/High/Low/Close
- Vwap
- Local Bollinger - upper and lower channel boundaries from current timeframe
--- Detailed description ---
Why do you need an indicator?
The indicator is designed to display the most important levels from the current and upper time frames, which are support/resistance for the price. You do not need to constantly search for the level on the upper time frame and track it on the current one. For ease of understanding, here we will assume that the main time frame is one minute, and the upper one is daily, and we are trading intraday. Of course the indicator works on any time-frame. And the most convenient moment is that the indicator automatically hides and shows levels near the current price so that the chart does not shrink (does not increase along the vertical axis). An important point - the level is calculated for the current bar, i.e. 20 bars ago most likely it was not at this value (but you can see it through the market simulation). This means that the levels move with the price change and they are always horizontal for the current bar, and not historical in general.
Benefits
Automatic hiding of levels depending on ATR
Levels from the current time frame: Bollinger, Vwap
Levels from the upper time frame: Open/High/Low/Close of the current day and Open/High/Low/Close of the previous day
Levels from the upper time frame: popular EMAs, popular EMA fibonacci, popular SMA, previous historical High/Low, if the price did not touch them
Table (summary) with levels for quick orientation
When hovering over a table/level, a tooltip appears in%
Everything can customized. Levels, colors, styles, hints - you can customize everything and make a dream indicator.
Available levels
EMA and SMA
A whole set of popular EMAs from the higher time frame: 5, 10, 20, 50, 100, 200, 300, 400, 500, 1000, 2000. Fibonacci EMAs: 13, 34, 55, 89, 144, 233
In our basic example, we add the EMA from the daily chart to the minute chart:
SMA added only the most popular: 20, 50, 100, 200
Vwap and Bollinger Bands from the current time frame
Open/High/Low/Close of the current and previous day (bar)
Open/High/Low/Close of the current (example: Current Open) and the previous bar (example: Prev Open) are requested from the higher time frame. If we use the indicator on the data of the daily chart, then we get the open/close/min/max levels of the current and the previous day. These are the usual Pivot levels that can be used as support/resistance:
Historical Open/High/Low/Close
These are the Open/High/Low/Close values of 50+ previous bars from the upper time frame. Marked as o3 (the Open value of the 3rd bar back), H55 (the High value of the 55th bar back), etc. They serve as excellent support/resistance levels, you just need to look at the upper chart to determine the significance of this level
In our example with a one-minute chart and an upper daily time frame, we can, for example, see the exact values of the historical maximum resistance or some significant support at the close of the gap.
By default, only High and Low are enabled, as they are the most significant. The summary hint contains a letter after the level - R or S, respectively, this is resistance or support.
Another good example of historical levels. On the left chart there is a daily time frame, on the right is a minute with an indicator. The indicator accurately shows the nearest historical support Low 14, 19 and 54. On the left I have highlighted them for clarity:
Lines and labels
The line is the "level". The line is the ray. It starts from the last bar and goes to the left. Since this is a ray, looking at the historical data (rewinding the chart back), it will not rescale and collapse the chart.
Label is the abbreviated name of the level, for example V (Vwap), e50 (EMA 50), or H17 (High 17). The title has been abbreviated so as not to clutter up the graph. When you hover the mouse, a tooltip appears with the full name of the level, the price and the difference in % to this level from the current price.
Settings
The indicator is very flexible and you can customize it absolutely for any needs and tasks.
Higher time frame
This is the timeframe from where the indicator requests data for most levels.
You can use different variations: minute/day, day/week, etc.
Atr Multiplier
This is the setting that allows you to decrease/increase the number of displayed levels.
It's simple - a “space” is created near the price above and below. If the level falls into this “space”, then it is displayed.
The space above is calculated as:
Price + (ATR * AtrMultiplier) and below as: Price - (ATR * AtrMultiplier)
While on the minute chart, it is optimal to use the value up to 10, on the hourly chart - up to 2-3, on the daily chart - 0.5, etc.
Line Right Shift, Label Right Shift
How many bars the levels and labels above them move from the last bar. If Line Right Shift is set to negative, the line will start at this point and go to the right side of the chart.
Show Lines ?, Show Labels?
Need to show lines or labels above them? You can turn off one option and use only the other - lines without labels or vice versa.
Show Summary table?
Summary table is a table of data that conveniently displays the full name of the levels and the price. Hover displays a tooltip with levels as a percentage.
To maximize the acceleration of the trader, the following has been done:
Levels sorted by price
The table is split in two. Green table above - levels are more expensive than the current price (possible resistance). Red table below - levels are cheaper than the current price (possible support)
Distance between tables = ATR. We quickly and easily understand the value of ATR by looking at this distance. You can compare it with the nearest bars, which will give good information.
Show ATR in Summary?
In the lower table showing the value of the current ATR. Convenient, no additional indicator needed.
Always show in Summary
A list of levels that must always be displayed on the table, even if they are far away and have not appeared. The short names of the levels are specified, separated by commas. My basic set is Open, Vwap, EMA 10, EMA 20, Bollinger High, Bollinger Low.
Always show Levels
What levels should be displayed, even if they are far away. Bollinger channels are my choice. You can add Vwap, but in some cases it will compress the graph a lot, so Vwap is only in Summary by default.
Hide labels
In order not to clutter up the graph, you can remove some of the labels. For example, Bollinger Bands have their own style and are perceived visually - a mark above the level is not needed. You can add Vwap.
Replace labels on *
Which labels need to be replaced with an asterisk so as not to clog the graph. For example, this is Vwap, which has its own style. You can hover over the star and get a tooltip for the price.
Replace ALL labels on *
You can massively replace all tags with asterisks and get information when you hover over them.
Show Prevs Open/High/Low/Close?
4 settings that allow you to show historical levels. The labels are o12, H4, L72, c8. By default, only High and Low are enabled due to their significance.
Max Prev Days - how many bars back to get historical levels. Limited by TradingView's abilities and you can get about 50-100 bars back.
Current/Prev Open/High/Low/Close?
8 settings for displaying 8 levels of the current and previous day, which are important boundaries for the price. Current Close is disabled by default, as this is the current price level and is highlighted in TradingView.
Vwap?, Local Bollinger?, Sma ?, Ema?
Vwap level, Bollinger channels and a complete list of available Ema/Sma.
The most popular ones are enabled by default.
Color/Style/Width
Visual settings for lines. All lines are divided into 7 groups. Styles are customizable for the group as a whole.
Life hacks
You can add the indicator multiple times to the chart and set each copy to different time frames. For example, you have a minute chart. You add the indicator 3 times and set each indicator to daily, hourly and 15 minute time frames. Next, you set up the styles and colors for the lines on each indicator so that you can easily distinguish them from each other. Thus, you will not miss a single important level when trading intraday.
Known Issues
The main problem is overlapping of labels and levels. Overlapping labels is difficult to solve, but work is underway.
A side issue is the visual styles of levels and labels. The main goal is to create well-visually perceptible lines so that they can be instantly identified without reading the mark. We need to create a good color scheme for the level groups.
How can the community help and improve the indicator?
Suggest ideas.
Please, write them in the comments. Suggest edits to existing functionality. Suggest solutions to problems, new features, etc.
I believe that the community's suggestions for improvement can bring the indicator to perfection.
Thanks you!
Session VWAP & ATR H/L ZonesThis script is a comprehensive tool for day traders, designed to visualize key price levels and zones based on volume and volatility within a specific trading session.
Traders would use your script to identify potential areas of support and resistance, gauge the session's trend, and spot opportunities for mean reversion or breakout trades.
Core Concepts Explained
Your script plots three main types of information on the chart, each serving a different purpose for a trader.
1. Session VWAP (Volume-Weighted Average Price) 📈
What it is: The yellow line is the VWAP, which is the average price of an asset for the current trading session, weighted by the volume traded at each price level. It essentially shows the "fair" price for the day according to the market's activity.
How it's used:
Trend Gauge: If the price is consistently trading above the VWAP, it's generally considered a bullish intraday trend. If it's below, the trend is bearish.
Dynamic Support/Resistance: During a trend, traders often look for the price to pull back to the VWAP to find an entry point (e.g., buying a dip to the VWAP in an uptrend).
VWAP Bands: The optional gray, red, and green bands are standard deviations from the VWAP. They measure how far the price has strayed from its "fair value."
2. ATR High/Low Zones (Support & Resistance) 🎯
What they are: These are the shaded green and red areas at the top and bottom of the session's price range.
The red zone (resistance) is calculated by taking the session's current high and subtracting a value based on the Average True Range (ATR), which is a measure of recent volatility.
The green zone (support) is calculated by taking the session's current low and adding the ATR-based value.
How they're used: These are not just lines; they are zones of interest.
Profit-Taking Areas: A trader who is long might consider taking profits when the price enters the red resistance zone.
Reversal Signals: When the price enters one of these zones and shows signs of stalling (e.g., with specific candlestick patterns), it could signal a potential reversal.
3. Previous Session High & Low 📊
What they are: The script plots the high and low from the previous trading session as straight horizontal lines (teal and fuchsia by default).
How they're used: These are extremely significant static levels that many traders watch.
Price Magnets: Price is often drawn to these levels.
Key Inflection Points: A decisive break above the previous day's high can signal strong bullish momentum. Conversely, a failure to break it can indicate weakness. These levels frequently act as strong support or resistance.

TGFA Flexible Alerts Multi-MA CrossoversTGFA Flexible Alerts, Multi-MA Crossovers
Description
Flexible MA crossovers with BUY/SELL alerts, customizable candle colors, and an info box for ATR/volatility insights. Supports EMA/SMA/HMA/VWAP on any chart.
Overview
TGFA Flexible Alerts is a versatile Pine Script indicator for traders seeking customizable moving average (MA) crossovers, visual signals, and quick-reference metrics. It overlays crossover lines (e.g., fast EMA over slow SMA), generates BUY/SELL labels and alerts, colors candles based on themes, and includes an optional info box with ATR bands, support/resistance, and trend projections. Built for any symbol and timeframe (optimized for 1H intraday), it auto-detects Heikin Ashi charts and handles mixed MA types like responsive HMA with lagging EMAs. All logic uses built-in TA functions for reliability—no repainting on confirmed bars.
Key Features
MA Crossover Engine: Configurable lines (EMA, SMA, HMA, VWAP) with dynamic colors (HMA tints green/red based on slope). Enable/disable via inputs.
Invert Signals Toggle: Flips BUY/SELL logic for mixed MA setups (e.g., HMA as fast line over EMA).
Reasoning: Traditional crossovers assume a fast line (low lag) crossing above a slow line (high lag) for buys. HMA's hull design makes it ultra-responsive, so it may "lead" too aggressively—causing premature signals. Inverting aligns it with user intuition (e.g., HMA dipping below then recovering signals strength), reducing false positives in trending markets. Test on your pairs!
Visual Alerts: BUY/SELL labels at crossover price (with optional price display and offset adjustment).
Single MA Overlays: Independent plots for EMA/SMA/HMA/VWAP (length 0 to hide).
Info Box: Real-time table with current price, ±1/2 ATR bands, median price (over lookback), trend (SMA50 slope), volatility % (ATR normalized), support/resistance (recent highs/lows), and reversal projections (tied to SMA50 pivot for up/down bias).
Candle Coloring: 20+ themes (dark/light canvases) for bull/bear/reversal/low-volume bars—e.g., Emerald Blaze greens uptrends, dims on low vol. Toggle off for no changes.
Chart Source Flexibility: Auto-switches to Heikin Ashi if detected; manual override for Regular/HA.
Alerts fire on crossovers/crossunders (custom messages with ticker/interval). Open-source for forking.
How to Use
Add to Chart: Search in TradingView's public library, apply to any symbol (e.g., stocks, forex). Best on 1H for intraday, but works on daily/weekly too.
Setup Crossovers: Choose Line 1/2 types/lengths (e.g., HMA 9 over SMA 20). Enable "Invert Signals" if using HMA—prevents lag mismatches in volatile assets.
Alerts & Labels: Toggle labels for visuals; set TradingView alerts on "Buy"/"Sell" conditions. Use offset for crowded charts.
Info Box Insights: Enable for quick scans—e.g., enter long near support if trend is bullish and price > median. Adjust ATR length (default 14) for sensitivity.
Candle Themes: Pick a scheme (e.g., Neon Pulse for dark mode); it overrides bar colors without altering data.
Customization Tip: For HMA-heavy setups, invert + short lengths (5-9) catch turns early; pair with volume filter in alerts.
Limitations & Disclaimers - Designed for overlay on price charts; may overlap in tight ranges—adjust transparency via styles.
HMA can repaint intra-bar; signals confirm on close. Not back tested for all assets—validate with strategy tester.
Info box projections use SMA(50) as a trend pivot (same for up/down as reference); customize via code for advanced calcs. Candle colors are cosmetic only.
This is an analysis tool, not advice. Trading involves risk; combine with fundamentals/news. Past performance isn't indicative of future results. No liability for losses.
I'm still a newbie, so feedback encouraged!
Thank you!!
ThisGirl

EMA Crossover Lines with VWAP, EMA 50/200 and Premarket AlertsOverview
An intraday overlay that combines trend and liquidity cues in one view. It plots your Fast/Slow EMAs, the widely watched EMA-50 and EMA-200, plus VWAP for session bias. During the configured pre-market session, it tracks and projects the pre-market high/low into regular hours—then alerts when price breaks those levels.
What it shows
EMAs: Fast + Slow (user-defined), EMA-50, EMA-200 for trend and crossover context.
VWAP: Session anchor for mean-reversion vs. trend continuation.
Pre-Market Levels: Dynamic Pre-Market High/Low lines (extend into RTH).
Alerts: Triggers when price crosses above pre-market high or below pre-market low (bar-close, non-repainting).
Inputs
Fast EMA Length (default 9)
Slow EMA Length (default 21)
EMA 50 Length (default 50)
EMA 200 Length (default 200)
Pre-market Session (default 04:00–09:30)
Session Timezone (default America/New_York)
How to use
Use EMA-50/200 slope and position to gauge higher-timeframe trend.
VWAP helps identify premium/discount within the day.
Watch pre-market breakouts for momentum entries, or fades back inside for mean reversion.
Combine with your own risk rules; alerts are informational.
Notes
Alerts fire on closed bars to avoid repainting.
Works on most intraday timeframes. Ensure the timezone matches the exchange you trade.
Lines only show when a pre-market session exists for the day.

Z Distance from VWAP Enhanced (ZVWAP)The "Z Distance from VWAP Enhanced" (ZVWAP) indicator is a comprehensive oscillator that provides deep insights into market dynamics. It calculates a Z-score, which tells you how many standard deviations the current price is away from the VWAP. This normalization makes it a consistent and reliable tool for identifying market extremes.
The indicator comes packed with features, including:
Customizable Overbought & Oversold Zones
Built-in Bullish & Bearish Divergence Detection
Automatic Trendline Plotting
A Moving Exponential Average (MEA) for crossover signals
Fully customizable alerts for every key event.
How to Use It - The BTC Dominance Strategy for Altcoins
As shown in the screenshot, this indicator is an exceptional tool for trading altcoins by analyzing the BTC Dominance (BTC.D) chart. The relationship is typically inverse:
When ZVWAP on BTC.D is RISING (or Overbought) ➔ It's BEARISH for Altcoins.
This means Bitcoin is gaining dominance, and capital is flowing out of altcoins and into Bitcoin. This is a time to be cautious with or short altcoins.
When ZVWAP on BTC.D is FALLING (or Oversold) ➔ It's BULLISH for Altcoins.
This means Bitcoin is losing dominance, and capital is flowing into altcoins, often starting an "altcoin season." This is a great time to look for long entries on your favorite altcoins.
Key Signals on the BTC.D Chart:
Zone Entries: When ZVWAP enters the red (Overbought) zone, prepare for altcoins to weaken. When it enters the blue (Oversold) zone, look for altcoin strength.
MEA Crossover: A crossover of the yellow ZVWAP line below the cyan MEA line is a strong confirmation that dominance is falling and the trend is becoming bullish for altcoins.
Divergences: A bearish divergence on the BTC.D chart can be an early warning that dominance is about to fall, signaling a potential bullish move for altcoins.
Key Features Explained
Overbought / Oversold Zones: The red and blue shaded areas clearly define when an asset is statistically over-extended. These are prime areas to look for mean reversion or trend exhaustion.
Divergence Detection: The script automatically detects and plots divergences between price and the ZVWAP.
• Bullish Divergence: Price makes a lower low, but ZVWAP makes a higher low. (Potential buy signal).
• Bearish Divergence: Price makes a higher high, but ZVWAP makes a lower high. (Potential sell signal).
The Reference Lines (+1 / -1): These gray lines represent one standard deviation from the VWAP. They act as an early warning system. When the ZVWAP crosses these lines, it shows that momentum is building, and the price is starting to deviate significantly from its average.
Automatic Trendlines: The indicator can automatically draw and manage trendlines based on recent pivots in the ZVWAP, helping you visualize the current momentum and potential breakout points. This feature can be turned off if you prefer a cleaner chart.
Customization and Alerts
The indicator is fully customizable. You can adjust the lengths, zone levels, and visual settings to fit your trading style. Most importantly, it includes a comprehensive set of alerts:
Enter Overbought Zone
Enter Oversold Zone
Bullish Divergence Detected
Bearish Divergence Detected
Enter Any Zone (OB/OS) - a single alert for either condition.
Any Divergence (Bull/Bear) - a single alert for any divergence.
This allows you to stay informed of every important signal without having to watch the charts all day.
i.imgur.com

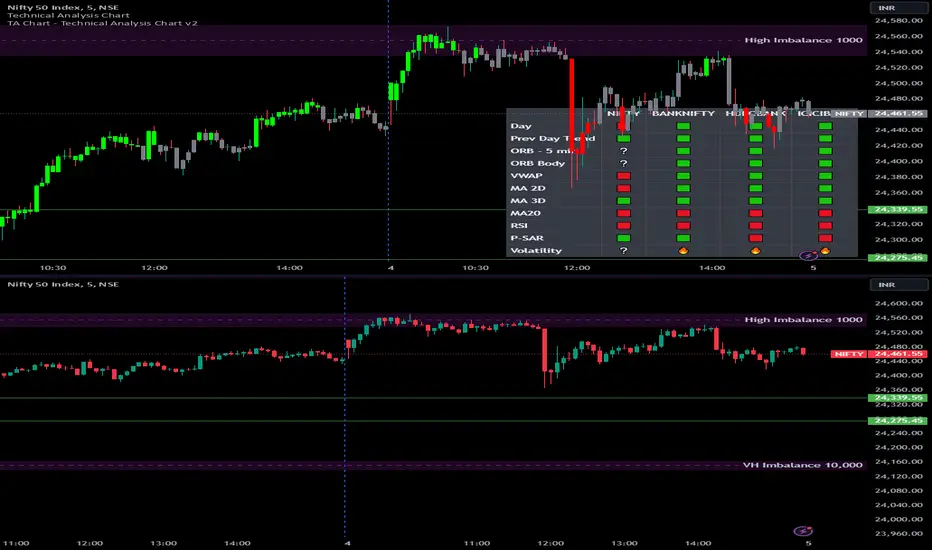
Options Series - Technical Analysis Chart➤ Simple Technical Chart Only:
➤ With MA-20 Overlay and Volatility background bars:
➤ With RSI Candles:
⭐ Overview and How It Works:
This script provides a multi-asset analysis tool to assess various market conditions across four symbols simultaneously. It combines several indicators such as daily price change, Moving Averages (MA), Bollinger Bands (BB), Parabolic SAR, RSI, and VWAP to generate buy/sell signals and trend indicators. Its strength lies in the layered use of indicators to enhance signal reliability, making it valuable for traders needing cross-validation in decision-making.
⭐ Key Features and Functionality:
The script evaluates each symbol's price against various indicators and conditions:
Daily Price Conditions: It checks if each symbol’s close price is above or below the previous day’s open, close, and intra-day ranges, forming a foundational bullish/bearish condition.
Range Breakout 1st 5min Candle (ORB): Opening Range Breakout levels are calculated and compared with current close prices, detecting breakout/breakdown conditions.
ORB Body: This basically calculates the previous day Daily candle body size, if todays Daily candle body size is greater than previous day, then we can say that we are having good momentum else its likely to be in-sidebar trading.
Moving Averages (MA): It leverages EMA-20, 2-day, and 3-day exponential moving averages to gauge short to medium-term trends.
RSI and VWAP: Relative Strength Index (RSI) determines overbought or oversold conditions, while VWAP compares prices to volume-weighted levels.
Bollinger Bands and Trend Analysis: Detects volatility and potential breakout conditions.
Concept of ORB Body:
Current_PrevDay_Body = (math.max(var_Current_PrevD_Open, var_Current_PrevD_Close) - math.min(var_Current_PrevD_Open, var_Current_PrevD_Close))
Current_Upper_ORB = var_Current_D_Open + Current_PrevDay_Body
Current_Lower_ORB = var_Current_D_Open - Current_PrevDay_Body
Current_TodayDay_Body = math.max(var_Current_D_Open, var_Current_Close) - math.min(var_Current_D_Open, var_Current_Close)
Current_ORBBody = Current_TodayDay_Body > Current_PrevDay_Body
Current_Upper_ORB_bull = (var_Current_Close > Current_Upper_ORB)
Current_Lower_ORB_bear = (var_Current_Close < Current_Lower_ORB)
🎨 Visualizations and User Experience:
The script can dynamically display colored backgrounds indicating trends when conditions are met. For example, the bgcolor function changes the background when certain trend-based criteria are satisfied, offering visual cues to users. Additionally, the checkbox input toggles trend bar visualizations, enhancing user experience by providing a quick visual reference without needing to interpret individual data points manually.
RSI-Based Candle Coloring:
➤ The script customizes candle colors based on RSI thresholds, specifically defining upper (60) and lower (40) RSI levels. When the RSI value exceeds the upper threshold, candles are colored as bullish (green), and if it falls below the lower threshold, candles are colored as bearish (red). Neutral RSI values result in a default color (gray).
➤ This setup offers a visually intuitive way to identify potential trend directions based on RSI levels, making it ideal for traders looking to gauge momentum visually.
⭐ Settings and Customization:
With multiple user-configurable inputs, the script allows for tailored analysis. Customizable parameters, such as enabling/disabling trend bars and setting various look-back periods for indicators like Bollinger Bands and Moving Averages, make it adaptable to various trading styles and preferences. It also allows users to modify visual elements like colors and styles, improving flexibility.
⭐ Uniqueness of the Concept:
The unique aspect of this script is its multi-symbol approach combined with complex conditions. By comparing not only one but four symbols simultaneously, it provides a broader market view and allows traders to correlate signals across different assets, offering a potential edge for diversified or comparative strategies. Additionally, the incorporation of ORB and multi-timeframe MAs gives it a robustness often lacking in simpler single-symbol scripts.
🚀 Conclusion:
This script is a powerful multi-indicator tool suited for traders looking for a comparative, multi-symbol analysis. With features like ORB, Bollinger Band-based trend detection, and MA cross-verification, it can assist traders in identifying and validating trend signals across assets. The user-friendly visualizations and customizable settings further enhance its usability, making it versatile for various trading strategies and preferences.
[KVA] Custom Sessions Custom Sessions: Multi-Timeframe Analysis & Key Level Insights
Introduction:
Introducing " Custom Sessions," an innovative Pine Script indicator meticulously crafted to empower traders by offering an advanced level of analysis on various global trading sessions. This tool is designed not just to highlight trading sessions but to delve deeper into the nuances of market movements by analyzing candlestick behavior within those sessions, offering a nuanced view of market trends, liquidity, and potential turning points.
Core Features :
Session Customization : Tailor trading sessions to align with your strategy, focusing on the markets that matter most to you. Whether it's London, New York, Tokyo, Sydney, or Frankfurt, you have the control.
Enhanced Market Insight : Beyond session timing, gain a refined understanding of market dynamics through detailed candlestick analysis within each session, providing a granular view of price action.
Comprehensive Analysis Tools : Alongside session analysis, the indicator includes features like VWAP (Volume Weighted Average Price) and Fibonacci retracement levels, offering a multifaceted approach to market analysis across chosen timeframes.
VWAP : Gain insights into the market's trend and liquidity by viewing the Volume Weighted Average Price calculated for the custom timeframe.
Fibonacci Retracement Levels : Easily identify potential reversal points with automatically plotted Fibonacci levels at 0.236, 0.382, 0.5, 0.618, and 0.782for each candle
Real-Time Updates : As the market moves, so does " Custom Sessions," offering real-time insights that adapt to the unfolding market conditions.
Utilization Guide :
Configure Your Sessions : Begin by setting up the sessions that are most relevant to your trading approach, customizing their times as needed.
Select the Desired Timeframe : Input your preferred higher timeframe to analyze data that is most relevant to your trading strategy.
Dive into the Details : Use the detailed candlestick analysis within sessions to pinpoint potential entry and exit points, supported by VWAP and Fibonacci levels for deeper market insight.
Customize Your View : Adjust the visual aspects of the indicator, including session color coding and which elements to display, tailoring the tool to your preferences.
Acknowledgements :
A special thanks to Aurocks_AIF for their foundational work on "Sessions on Chart" . This project has been an invaluable resource, inspiring the development of " Custom Sessions" and pushing the boundaries of traditional session analysis.
Final Thoughts :
" Custom Sessions" is more than just an indicator; it's a comprehensive analysis tool that brings a new depth to the understanding of market sessions. By offering detailed insights into the behavior of candles within these sessions, along with essential analysis features, this indicator is a must-have for traders seeking to enhance their technical analysis arsenal.
Whether you're a day trader looking to capture short-term movements or a long-term investor seeking broader market insights, this indicator offers valuable data visualization to enhance your trading decisions. By integrating highs, lows, VWAP, and Fibonacci levels into your analysis, you gain a comprehensive view of market behavior across different timeframes and sessions

Smoothed RSI w/ VWAP & Moving AverageThis indicator is the default Tradingview RSI with smoothing and an RSI based VWAP. I've also added the RSI based VWAP to the Moving Average options list. By default, the RSI based VWAP is turned on with the WMA selected as the Moving Average. The RSI changes colors when it is above the 55 level, VWAP, and Moving Average or below the 45 level, VWAP, and Moving Average. There is also an option for barcoloring based on the RSI colors.
Default settings
Default settings w/ Barcoloring
VWAP off w/ Bollinger Bands as the Moving Average
VWAP on w/ Bollinger Bands as the Moving Average and Barcoloring
VWAP as the Moving Average option

Day Selectable Weekly Anchor VWAPSimple script to anchor VWAP on selected day of the week.
It is very useful when you want to anchor VWAP from a particular day instead of default Monday when you use weekly VWAP
Please note that this is a weekly VWAP and not daily or monthly vwap.
Example use case:
Lets say I want to anchor VWAP on specific day like Friday instead of Monday, I would just select the Friday from the drop down window and voila!
