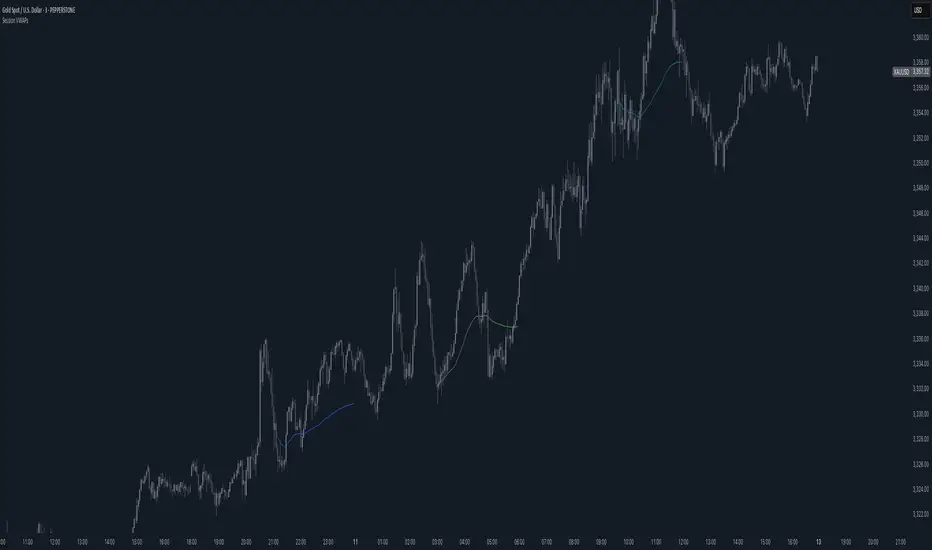
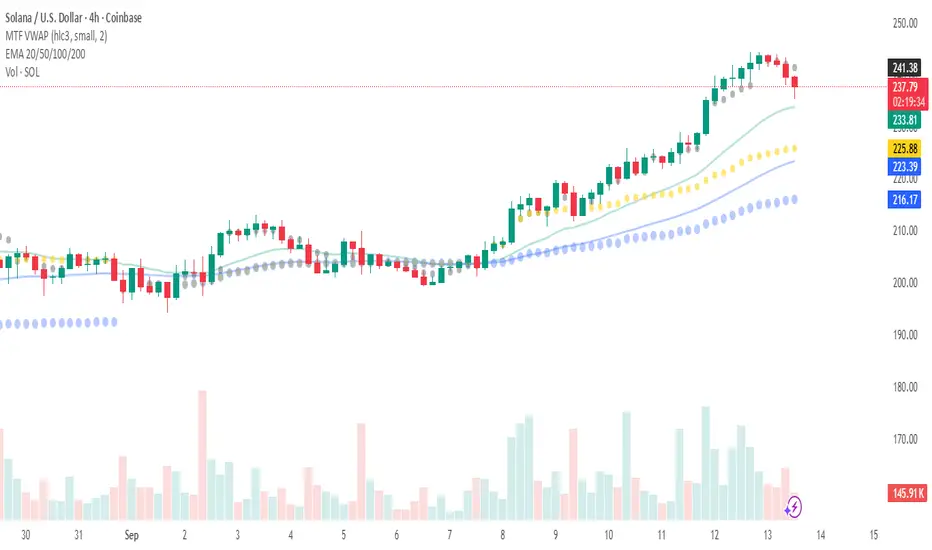
Session VWAPsThis indicator plots volume-weighted average price (VWAP) lines for three major trading sessions: Tokyo, London, and New York. Each VWAP resets at the start of its session and tracks the average price weighted by volume during that window. You can choose the exact session times, turn individual sessions on or off, and optionally extend each VWAP line until the end of the trading day.
It’s designed to give you a clear view of how price is behaving relative to session-specific value areas. This can help in identifying session overlaps, shifts in price control, or whether price is holding above or below a particular session’s average. The indicator supports futures-style day rollovers and works across markets.
ابحث في النصوص البرمجية عن "VWAP"
Anchored VWAP + Prev Session Levels by Avenoircustom vwap for weekly, monthly, quarterly and yearly vawp.
also highlighting previous vwaps.

VWAPVWMAATRAdapted ATR that i am using in BTC 15M charts. It is an usual ATR-Stop smoothed by a VWAP and a VWMA.
This crazy config i am using only for BTC, but i found others configs with others assets, like brlusd contracts.
You can turn off the barcolor function and change the lenght of the VWAP and VWMA.

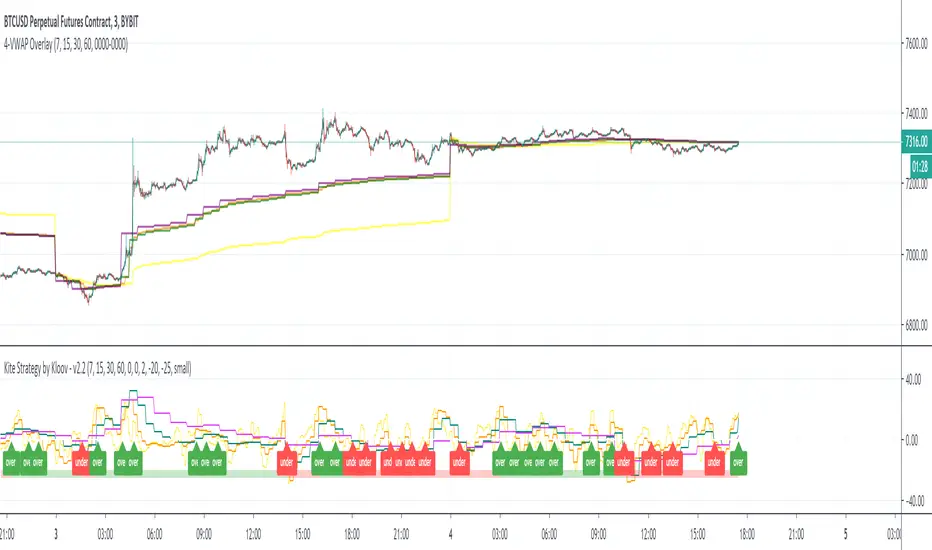
4-VWAP overlayI am a big fan of Kite Crossing Oscillator by Kloov. In an effort to see the actual vwap values I created a simple overlay of the vwaps with adjustable intervals.
multiday auto vwapwork in progress script to automatically generate multi vwaps - starting with current day and generating the prior 2 days to that.

ifish VWAPDISCLAIMER:
The Following indicator/code IS NOT intended to be a formal investment advice or recommendation by the author, nor should be construed as such. Users will be fully responsible by their use regarding their own trading vehicles/asset
Volume weighted average price (VWAP)
Calculating VWAP
Choose your time frame (tick chart, 1 minute, 5 minutes, H1 etc.)
Calculate the typical price for the first period (and all periods in the day following). Typical price is attained by taking adding the high, low and close, and dividing by three: (H+L+C)/3
Multiply this typical price by the volume for that period. This will give you a value called TP*V.
Keep a running total of the TP*V values, called cumulative TPV. This is attained by continually adding the most recent TPV to the prior values (except for the first period, since there will be no prior value). This figure should get larger as the day progresses.
Keep a running total of cumulative volume. Do this by continually adding the most recent volume to the prior volume. This number should also get larger as the day progresses.
Calculate VWAP with your information: cumulative TPV/cumulative volume. This will provide a volume weighted average price for each period and will provide the data to create the flowing line that overlays the price data on the chart.
The VWAP identifies the true average price of a stock by factoring the volume of transactions at a specific price point and not based on the closing price.
How to trade? Essentially, you wait for the market to test the VWAP to the downside. Next, you will want to look for the market to close above the VWAP depending the TF you are trading.
Above VWAP bullish
Below VWAP bearish.
You might choose your desired deviations by entering different inputs, once values are crosses depending bullish/bearish cross, VWAP will color flip red/blue. color flip will be additional confirmation when market due to drop below VWAP line.
What Does Volume Weighted Average Price (VWAP) Tell You?
Large institutional buyers and mutual funds use the VWAP ratio to help move into or out of stocks with as small of a market impact as possible. Therefore, when possible, institutions will try to buy below the VWAP, or sell above it. This way their actions push the price back toward the average, instead of away from it.
Retail traders tend to use VWAP more as a trend confirmation tool, similar to a moving average. When the price is above VWAP they look only to initiate long positions. When the price is below VWAP they only look to initiate short positions.
The Difference Between Volume Weighted Average Price (VWAP) and a Simple Moving Average
On a chart, VWAP and a moving average may look similar. These two indicators are calculating different things.
VWAP is calculating the sum of price multiplied by volume, divided by total volume.
A simple moving average is calculated by summing up closing prices over a certain period (say 10), and then dividing it by how many periods there are (10). Volume is not factored in.
While some institutions may prefer to buy when the price of a security is below the VWAP, or sell when it is above, VWAP is not the only factor to consider. In strong uptrends, the price may continue to move higher for many days without dropping below the VWAP at all or only occasionally. Therefore, waiting for the price to fall below VWAP could mean a missed opportunity if prices are rising quickly.

ueuito VWAP + VWAP Previous Day EndThis script is a fully featured VWAP indicator, based on the standard Volume-Weighted Average Price formula used by professional traders. It calculates the VWAP anchored to the selected period and also provides optional standard deviation or percentage-based bands.
In addition to the traditional VWAP logic, this version introduces an important enhancement:
⭐ Previous Day VWAP Closing Line (New Feature)
The script automatically calculates the final VWAP value of the previous trading day and plots it as a horizontal line at the start of each new session.
This line remains visible throughout the current day, allowing traders to quickly identify where the market closed relative to the VWAP on the prior day.
This added feature provides several advantages:
Highlights a key institutional reference level that is often used for mean-reversion setups.
Allows intraday traders to compare current price action with the previous session’s VWAP benchmark.
Helps identify support/resistance behavior around the prior VWAP close.
The line is customizable with options for:
Color
Width
Style (solid, dashed, dotted)
On/off toggle
✔ Summary of Features
Standard VWAP calculation with optional session or custom anchors
Three optional VWAP bands (standard deviation or percentage based)
Fully configurable appearance settings
Previous Day VWAP Closing Line added as a key enhancement
Works on any intraday timeframe
Automatically resets at the start of each trading session

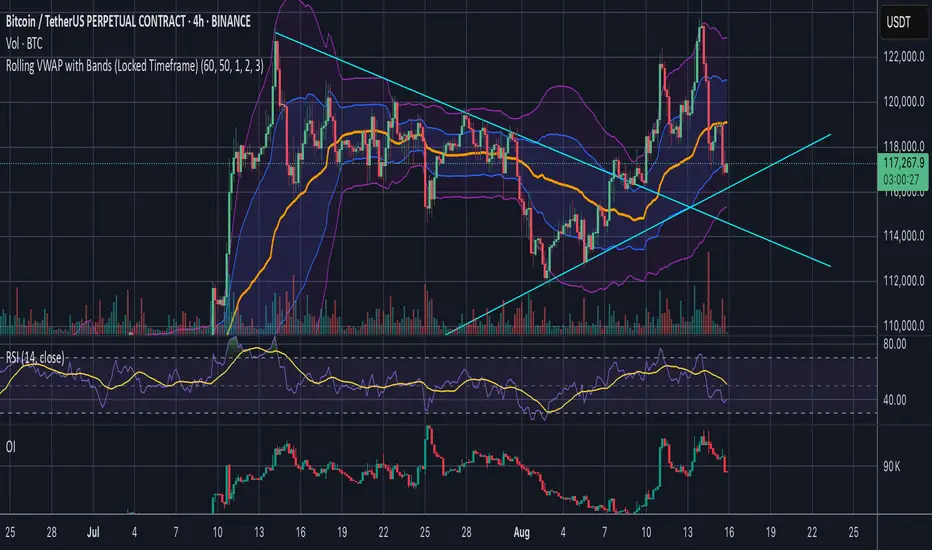
Rolling VWAP with Bands (Locked Timeframe)Rolling VWAP with Customizable Bands — Locked Timeframe
This indicator plots a rolling Volume Weighted Average Price (VWAP) over a fixed, user-selected timeframe — so it stays consistent no matter what chart timeframe you’re viewing. Unlike the standard anchored VWAP, this one works like a moving average weighted by volume, providing a smoother, more adaptive central price line that doesn’t reset each session.
It also includes up to three optional deviation bands, each with its own toggle and multiplier setting. The bands are based on standard deviation, helping you quickly identify when price is stretched above or below its mean.
Features:
Locked-timeframe VWAP — calculation stays fixed to your chosen resolution (e.g., 1H, 4H, Daily)
Adjustable lookback length for VWAP calculation
Up to 3 standard deviation bands, each with:
On/Off toggle
Independent multiplier control
Works on any chart timeframe without changing shape
Optional filled shading between bands for clarity
Uses:
Spot overbought/oversold conditions relative to VWAP
Identify dynamic support & resistance
Confirm trend strength or mean reversion setups
Keep a consistent reference line across multiple chart timeframes
Spot Vwap Diff [Auto+Osc] [Intromoto]This script shows the percent difference from price, or in percent terms how far away price is from it. This is the oscillator version.
Roughly, the further price goes away from the vwap , the more likely it is to revert.
This script only runs properly on Binance perpetual charts, and auto updates to the SPOT, underlying asset, difference between price and the vwap . The vwap has a resolution option to change the timeframe of the Vwap .
IMPORTANT: If you are not on a Binance perpetual chart, this script will reference the VWAP difference to price on Binance:BTCUSDT.
If you're using this on a recently listed coin, there's a chance I haven't updated the script. Check accordingly.
Settings include bracketing for color reference. High time frame VWAP resolution will cause the colors to go extreme, since price can move further away on high time frames.
I'm hoping to update this script to account for normal uses on high time frame settings.
DM for access.
Thanks

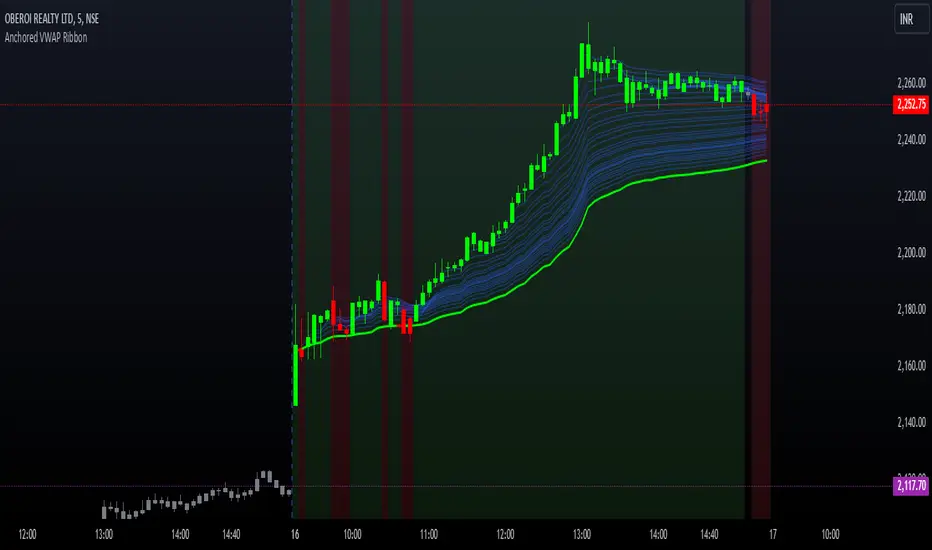
Options Series - Anchored VWAP Ribbon➤ AVWAP On different chart symbols:
⭐ Overview and Key Features:
Anchored VWAP Calculation:
The script implements the Anchored Volume Weighted Average Price (AVWAP), a tool used by professional traders to identify key price levels weighted by volume, starting from a specific timestamp (anchor point).
Bullish and Bearish Analysis:
It determines the dominance of bullish or bearish momentum based on the relationship between the close price and AVWAP levels across multiple time points.
Dynamic Visualization:
The background of the chart changes color based on overall bullish or bearish sentiment, making it easier to interpret market trends.
Multi-Time Anchors:
By defining multiple anchor points (e.g., 09:15, 09:20), the script calculates a series of AVWAP values for fine-grained intraday analysis.
Customizable Inputs:
Users can select the source price (e.g., hlc3), date, and time for AVWAP calculation.
⭐ How It Works and Functionality:
AVWAP Logic:
Uses the timestamp() function to establish a reference (anchor point).
Calculates the cumulative weighted price (price * volume) and cumulative volume from this anchor point.
The ratio of these sums gives the AVWAP, which updates dynamically with new bars.
Bullish and Bearish Signals:
Binary flags (1 or 0) are set for each time point depending on whether the closing price is above or below the AVWAP for that time.
Aggregates these flags into AVWAP_bull and AVWAP_bear to represent the overall market sentiment.
Decision Logic:
Determines final market conditions (bullish or bearish dominance) based on aggregated scores.
Visual feedback (background and bar colors) is applied accordingly.
⭐ Visualizations and User Experience:
Background Colors:
Green or red background highlights the overall sentiment (bullish or bearish), providing a quick market overview.
Bar Coloring:
Bars are color-coded based on bullish, bearish, or neutral conditions, making it easier to identify trends directly on the chart.
AVWAP Levels:
The calculated AVWAP values are plotted as colored lines for each anchor point, giving precise intraday levels of significance.
Bright colors (fluorescent green/red) are used for additional clarity when the close price is above or below these levels.
🎨 Settings and Customization:
Anchor Point:
Fully customizable anchor points allow users to set specific dates and times (e.g., 09:15 on December 13, 2024) for AVWAP calculations.
Source Price:
Users can choose from hlc3, close, or any other price source to calculate the AVWAP, tailoring the indicator to their strategy.
Visual Appearance:
The transparency, colors, and line styles are adjustable, enabling users to customize the chart to match their trading preferences.
Dynamic Signals:
The script accommodates numerous AVWAP levels, providing flexibility for scalpers and swing traders alike.
⭐ Uniqueness of the Concept:
Precise Intraday Analysis:
Unlike static VWAP, this script allows anchoring to specific times during the day, offering granular insights into market behavior.
Cumulative Sentiment Approach:
Aggregates signals across multiple time intervals, providing a comprehensive view of intraday momentum rather than a single-point reference.
Blending AVWAP with Visual Feedback:
Combines traditional AVWAP calculations with visually impactful features like background shading and bar coloring to enhance decision-making.
Scalability:
Supports adding multiple additional anchor points and customization for broader applicability in different market conditions.
🚀 Conclusion:
The Anchored VWAP Ribbon script is a powerful tool for traders seeking to analyze price behavior relative to volume-weighted levels anchored at specific times. It provides a visually intuitive way to assess intraday market sentiment, combining traditional technical indicators with customizable visualization features. The script’s flexibility makes it suitable for a variety of trading styles, from scalping to swing trading, while its unique cumulative sentiment logic sets it apart from conventional VWAP tools.
NQ Futures VWAP on QQQOverlay NQ1 vwap for QQQ
Track NQ future's vwap on your QQQ chart to scale with optional bands

ABG VWAP Linessimple script about vwap
the indicator plots the current vwap level with 1std on the chart for a cleaner and simpler key level look.
this is Version 1

Multi Rolling VWAP Indicator - RVWAPThe Rolling VWAP (RVWAP) Indicator calculates a volume-weighted average price over a user-defined lookback period, providing a smoother alternative to traditional VWAP without session resets. Ideal for intraday and swing traders, it helps identify dynamic support/resistance levels and market trends across any timeframe.
Features:
Customizable Lookback: Adjust the rolling window (default: 14 bars) to suit your trading style.
Dynamic Coloring: RVWAP line changes color based on price position—green (above), red (below), or yellow (equal).
Standard Deviation Bands: Optional upper/lower bands (toggleable) highlight volatility and potential reversal zones.
Visual Clarity: Semi-transparent band fill for easy trend analysis.
Usage:
Add the indicator to your chart, tweak the lookback period and band settings, and use it to spot trend direction, support/resistance, or mean-reversion opportunities. Perfect for stocks, forex, crypto, and more.

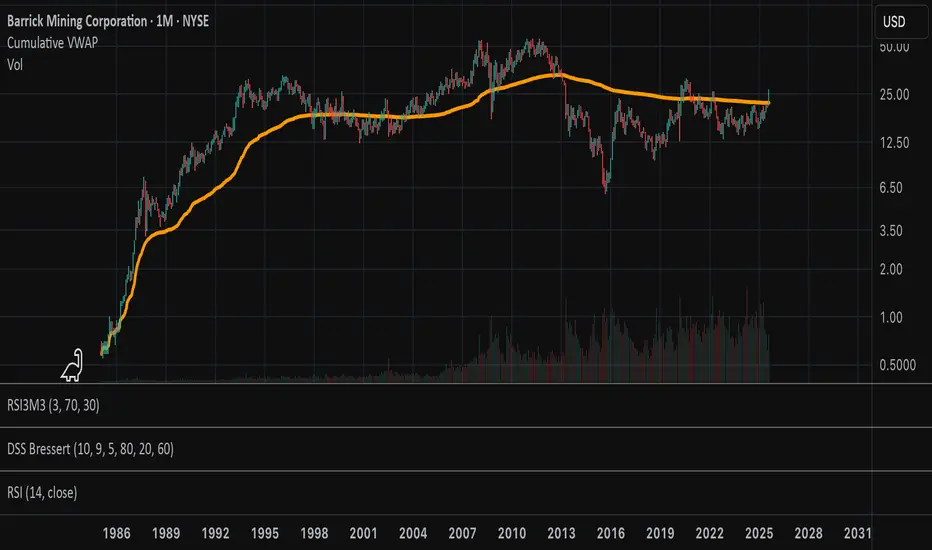
Cumulative VWAPThis indicator plots the cumulative VWAP from the first bar loaded on the chart. Unlike the traditional daily VWAP that resets at the start of each trading session, this version continuously aggregates price and volume over the full visible chart history.
Buyer and Seller VWAPThis indicator calculates and visualizes Buyer and Seller Volume-Weighted Average Prices (VWAP) using a Least Squares Moving Average (LSMA) smoothing method. It classifies trades based on candle direction—buys when the close is above or equal to the open, and sells when the close is below the open.
The indicator applies LSMA to both buyer and seller VWAP values to reveal underlying trends with reduced noise. It also calculates a standard deviation band around each LSMA line, creating a shaded zone that represents volatility. This helps traders identify periods of expansion, contraction, and potential breakout opportunities based on buyer/seller strength.

Multi-Session VWAP (NY, London, Asia) + HOD/LOD BandsMulti-Session VWAP (NY, London, Asia) + HOD/LOD Bands

Goat VWAPMulti TF Vwap used by Goat in most of his trades.
Used for TP/SL; support/resistance.
Goat used it most on high TF like daily.

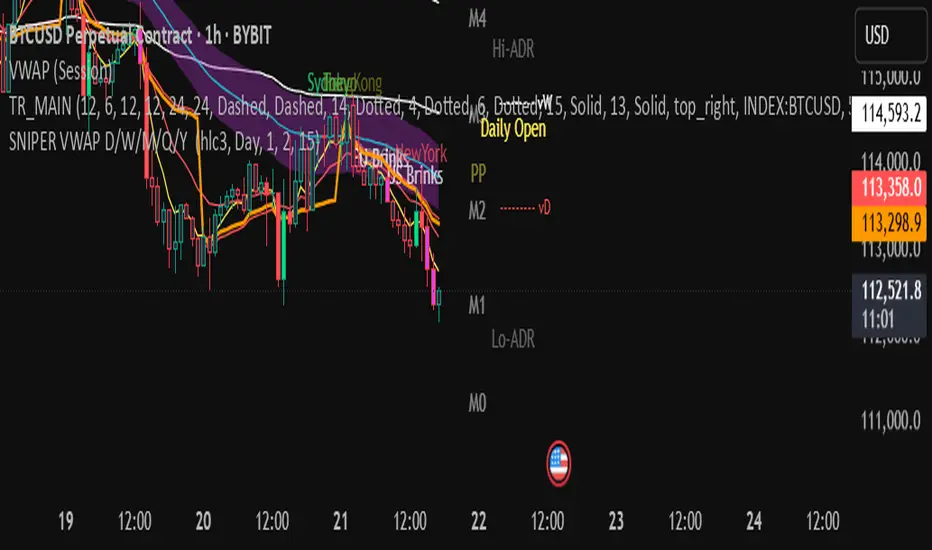
Koalafied VWAP D/W/M/Q/Y Volume Weighted Average Price (VWAP) for multiple periods with Standard Deviation band selection - Daily, Weekly, Monthly, Quarterly, Yearly

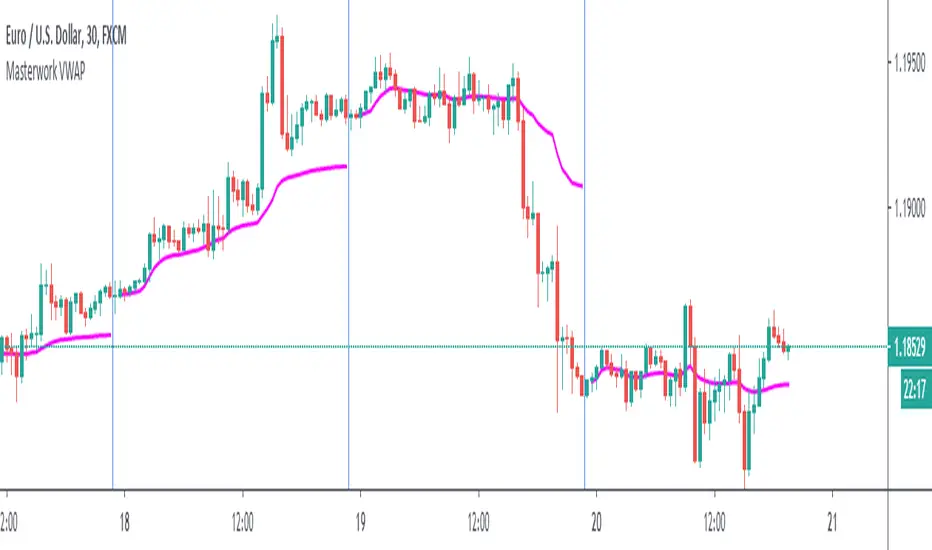
Masterwork VWAPWhen the session ends, built-in VWAP connects the line to the open of a new session. This transmission from session to another session very ugly. My script solves that.
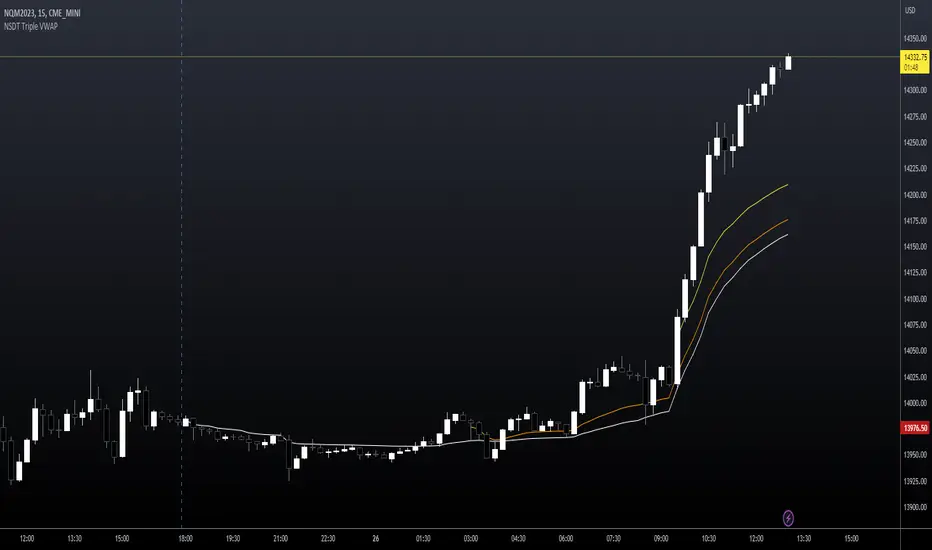
NSDT Triple VWAP with Adjustable Start TimesAllows you to plot 3 VWAP's with 3 different start times. Very useful for trading futures where there are multiple sessions involved. Can also be used with stocks to set as previous day, pre-market, and market open.
Anchored VWAPPine implementation of VWAP, similar to build-in, with anchors to Session, Week, Month and Year
