Simple Volatility MomentumOverview:
The Simple Volatility Momentum indicator calculates the mean and standard deviation of the changes of price (returns) using various types of moving averages (Incremental, Rolling, and Exponential). With quantifying the dispersion of price data around the mean, statistical insights are provided on the volatility and the movements of price and returns. The indicator also ranks the mean absolute value of the changes of price over a specified time period which helps you assess the strength of the "trend" and "momentum" regardless of the direction of returns.
Simple Volatility Momentum
This indicator can be used for mean reversion strategies and "momentum" or trend based strategies.
The indicator calculates the average return as the momentum metric and then gets the moving average of the average return and standard deviations from average return average. On the options you can determine if you want to use 1 or 2 standard deviation bands or have both of them enabled.
Settings:
Source: By default it's at close.
M Length: This is the length of the "momentum".
Rank Length: This is the length of the rank calculation of absolute value of the average return
MA Type: This is the different type of calculations for the mean and standard deviation. By default its at incremental.
Smoothing factor: (Only used if you choose the exponential MA type.)
The absolute value of the average return helps you see the strength of the "momentum" and trend. If there is a low ranking of the absolute value of the average return then you can eventually expect it to increase which means that the average return is trending, leading to trending price moves. If the Mean ABS rank value is at or near the maximum value 100 and the average return is at -2 standard deviation from the mean, you can see it as the negative momentum or trend being "finished". Similarly, if the Mean ABS value is near or at the maximum value 100 and the average return is at +2 standard deviation from the mean, you can view the uptrend, as "finished" and the Mean ABS rank can't really go higher than 100.
Moving Average Calculations type:
Incremental: Incremental moving averages use an incremental approach to update the moving average by adding the newest data point and subtracting the oldest one.
Exponential: The exponential moving average gives more weight to recent data points while still considering older ones. This is achieved by applying a smooth factor to the previous EMA value and the current data point. EMA's react more quickly to recent changes in the data compared to simple moving averages, making them useful for short term trends and momentum in financial markets.
Rolling: The moving average is calculated by taking the average of a fixed number of data points within a defined window. As new data becomes available, the window moves forward and the average is recalculated. Rolling Moving Averages are useful for smoothing out short-fluctuations and identifying trends over time.
Important thing to note about indicators involving bands and "momentum" or "trend" or prices:
For the explanation we will assume that stock returns follow a normal distribution and price follows a log normal distribution. Please note that in the live market this assumption isn't always true. Many people incorrectly use standard deviations on prices and trade them as mean reversion strategies or overbought or oversold levels which is not what standard deviations are meant for. Assuming you have applied the log transformation on the standard deviation bands (if your input is raw price then you should use a log transformation to remove the skewness of price), and you have a range of 2 standard deviations from the mean, under the empirical rule with enough occurrences 95% of the values will be within the 2 standard deviation range. This doesn't mean that if price falls to the bottom of the 2 standard deviation bound, there is a 95% chance it will revert back to mean, this is incorrect and not how standard deviations or mean reversion works.
"MOMENTUM"
In finance "momentum" refers to the rate of change of a time series data point. It shows the persistence or tendency for a data series to continue moving in its current direction. In finance, "momentum" based strategies capitalize on the observed tendency of assets that have performed well (or poorly) in the recent past to continue performing well (or poorly) in the near future. This persistence is often observed in various financial instruments including stocks, currencies and commodities.
"Momentum" is commonly calculated with the average return, and relies on the assumption that assets with positive "momentum" or a positive average return will likely continue to perform well in the short to medium term, while assets with a negative average return are expected to continue underperforming. This average return or expected value is derived from historical observations and statistical analysis of previous price movements. However, real markets are subject to levels of efficiencies, market fluctuations, randomness, and may not always produce consistent returns over time involving momentum based strategies.
Mean Reversion:
In finance, the average return is an important parameter in mean reversion strategies. Using statistical methodologies, mean reversion strategies aim to exploit the deviations from the historical average return by identifying instances where current prices and their changes diverge from their expected levels based on past performance. This approach involves statistical analysis and predictive modelling techniques to check where and when the average rate of change is likely to revert towards the mean. It's important to know that mean reversion is a temporary state and will not always be present in a specific timeseries.
Using the average return over price offers several advantages in finance and trading since it is less sensitive to extreme price movements or outliers compared to raw price data. Price itself contains a distribution that is usually positively-skewed and has no upper bound. Mean reversion typically occurs in distributions where extreme values are followed by a tendency for the variable to return towards its mean over time, however the probability distribution of price has no tendency for values to revert towards any specific level. Instead, values may continue to increase without a bound. Returns themself contain more stationary behavior than price levels. Mean reversion strategies rely on the assumption that deviations from the mean will eventually revert back to the mean. Returns, being more likely to exhibit stationary, are better suited for mean reversion based strategies.
The distribution of returns are often more symmetrically distributed around their mean compared to price distributions. This symmetry makes it easier to identify deviations from the mean and assess the likelihood of mean reversion occurrence. Returns are also less sensitive to trends and long-term price movements compared to price levels. Mean reversion strategies aim to exploit deviations from mean, which can be obscured when analyzing raw price data since raw price is almost always trending. Returns can filter out the trend component of price movements, making it easier to identify opportunities.
Stationary Process: Implication that properties like mean and variance remain relatively constant over time.
ابحث في النصوص البرمجية عن "Volatility"

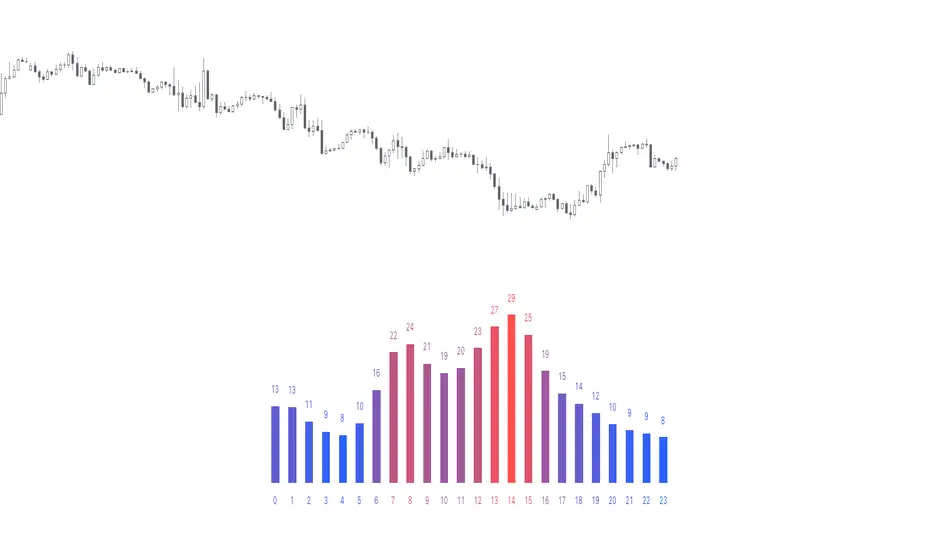
Time of Day - Volatility Report█ OVERVIEW
The indicator analyses the volatility and reports statistics by the time of day.
█ CONCEPTS
Around the world and at various times, different market participants get involved in the markets. How does this affect the market?
Knowing this gets you better prepared and improves your trading. Here are some ideas to explore:
When is the market busy and quiet?
What time is it the most volatile?
Which pairs in your watchlist are moving while you are actively trading?
Should you adjust your trading time? Should you change your trading pairs?
When does your strategy perform the best?
What entry times do your winners have in common? What about the exit times of your losers?
Is it worth keeping your trade open overnight?
Bitcoin (UTC+0)
Gold (UTC+0)
Tesla, Inc. (UTC+0)
█ FEATURES
Selectable time zones
Display the statistics in your geographical time zone (or other market participants), the exchange time zone, or UTC+0.
Configurable outputs
Output the report statistics as mean or median.
█ HOW TO USE
Plot the indicator and visit the 1H timeframe.
█ NOTES
Gaps
The indicator includes the volatility from gaps.
Calculation
The statistics are not reported from absolute prices (does not favor trending markets) nor percentage prices (does not depict the different periods of volatility that markets can go through). Instead, the script uses the prices relative to the average range of previous days (daily ATR).
Extended trading session
The script analyses extended hours when activated on the chart.
Daylight Saving Time (DST)
The exchange time or geographical time zone selected may observe Daylight Saving Time. For example, NASDAQ:TSLA always opens at 9:30 AM New York time but may see different opening times in another part of the globe (New York time corresponds to UTC-4 and UTC-5 during the year).
Artharjan INDIA VIX v/s Nifty Volatility DashboardHi,
I have created Artharjan INDIA VIX v/s Nifty Volatility Dashboard to forecast the Annual, Quarterly, Monthly, Weekly, Daily and Hourly Volatility of NIFTY Benchmark Index based on current value of INDIA VIX. This will help Index Options Sellers to decide the range of Nifty for the given period based on current level of volatility indicated by INDIA VIX.
Options Sellers may make use of the Min Range and Max Range values for the Strike Price Selection.
Regards
Rahul Desai
@Artharjan

Historical Volatility OscilattorHistorical Volatility Oscilattor is a tool that helps us to identify changes in the volatility regime. The histogram is the result of the substraction of the fast historical volatility to the slow historical volatility

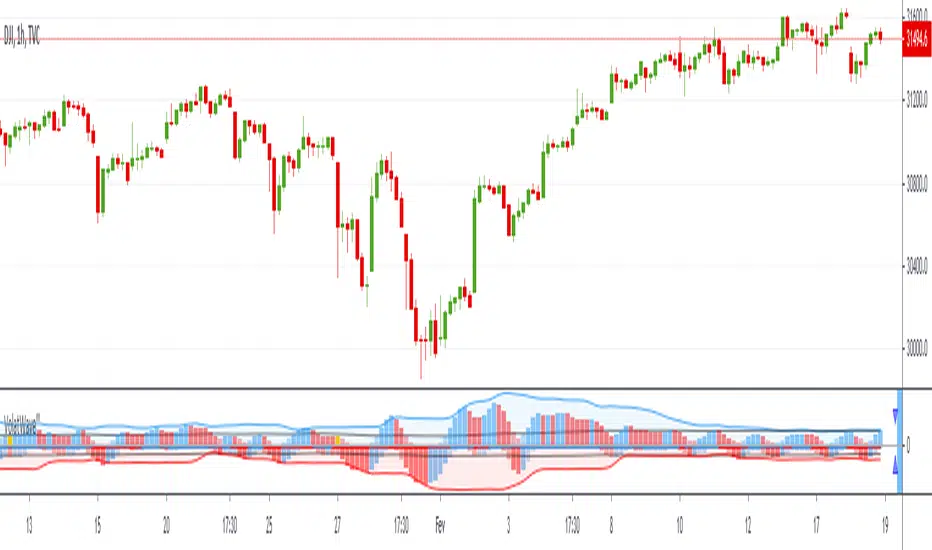
VolatWave‴ | Volatility Wave‴What does it do?
This indicator allows you to identify possible asset top and bottom reversals by having a prior Volatility acting among the price movement with a sequential positive (top reversal) or negative (bottom reversal) waves.
How does it work?
Everytime the wave starts showing a curved top movement (ascending price movment) or a curved bottom movement (descending price movment), it might be signing that a price reversal is on its way. It is possible to adjust the wave shape by increasing/decreasing its gradient value analysis, but it's so easy to use that most of the times no reconfiguration is needed, just add it and let it guide you.
Important to mention that the positive wave band, histogram bars and moving average line are calculate totally separete from the the negative wave.
What's my filling?
I'm still testing this indicator for only a week and so far still trying to understand its signs. I'm using it in conjunction with Volume Wave (VolWave) and Price Spread Wave (PSWave).
Indicator attributes:
- generally waves formation makes a symmetrical arc
- when the second half of a wave is elongated (compared to its first half), it suggests a lack of directional force of the current movement
- peak / bottom formation suggests reversal of the current movement
- smaller amplitude of a wave (compared to the previous wave) suggests loss of power, and vice-verse
- indicates divergence indication between peaks / bottoms
- when the volatility bar touches the volatility wave band, it suggests imminent reversal of the current movement
- wave band opening suggests movement increasing strength in that direction
- wavelengths (distance between two peaks / bottoms) tend to be similar
- subsequent wave rarely occurs
Technical information:
- the calculation of the positive movement is independent of the calculation of the positive movement
- the black line in the upper and lower zone is the average of the wave that is overcome, suggests strength in movement
- bands suggest delimitation of a wave's peak / bottom
To have access to this indicator, please DM me.
Don't contact me in the comment area.
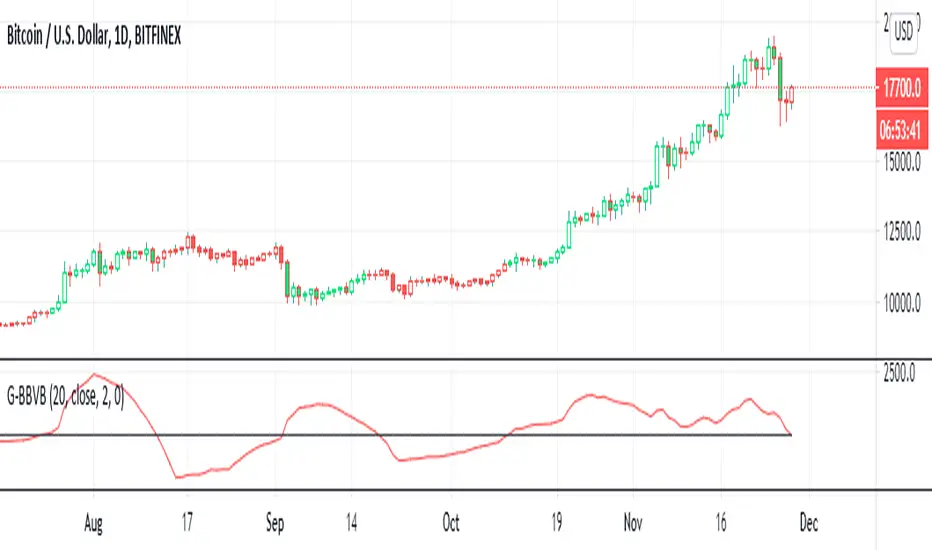
G-Bollinger bands volatility breakout v.1This is my frist publish scrpit. I developed this indicator origin is BB. It make from easy idea but powerful for sideway to breakout
1. I findout volatility by upper band of BB - lower band of BB (I called "Aline")
2. I created SMA of Aline (I called Bline)
3. I created the special line is "Cline" from Aline - Bline
4. I created 0 line " Baseline "
G-BBvB is the very good indicator to detect low volatility to begin the volatility = Buy signal
Now I can't find the sell signal form indicator. I try backtest sell at Cline cross zeroline but it not work.
I'll develop "G" indicator for free .
Goodluck :D
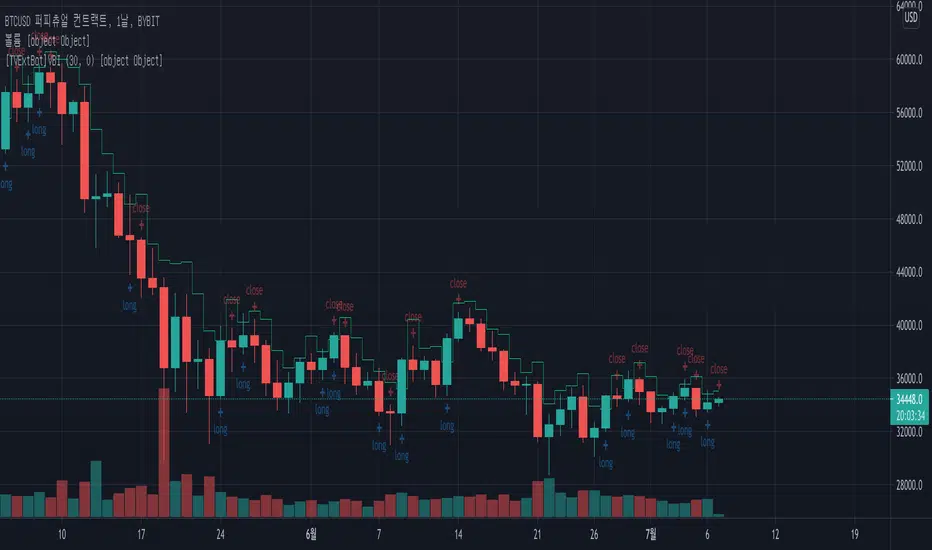
[TVExtBot]Volatility Breakout Indicator(With Alerts)Volatility Breakout Indicator(With Alerts)
It is based on the legendary trader Larry R. Williams' volatility breakout strategy.
The volatility breakout strategy is a short-term trading strategy that realizes rapid profits on a daily basis, following the upward trend of a strong upward trend that exceeds a certain level on a daily basis.
변동성 돌파 지표란 전설적인 트레이더 래리 윌리엄스(Larry R. Williams)의 변동성 돌파 전략을 기본으로 개발한 지표입니다.
변동성 돌파 전략은 일일 단위로 일정 수준 이상의 범위를 뛰어넘는 강한 상승세를 돌파 신호로 상승하는 추세를 따라가며 일 단위로 빠르게 수익을 실현하는 단기매매 전략입니다.
Relative Candle Volatility & Directionality IndexThis is an enhanced (closed-source) implementation of the Relative Candle Volatility Index (RCVI), with a Relative Candles Directionality Index (RCDI) added.
When the RCVI switch significantly positive, it indicates a sudden increase in volatility ; whereas, when the RCVI switch significantly negative, it indicates a sudden decrease in volatility -- in relative to the (just prior) market trend.
A positive (green) RCDI indicates a net positive price trend, while a negative (red) RCDI indicates a net negative price trend.
Buy/Sell strategy circle-markers, derived base on the interaction between the RCVI and the RCDI , are also introduced in this edition.
The parameters should be manually "history-matched", for a particular chart and time-frame, for the best result.
RCVI QUICK GUIDE:
~ * ~ * ~ * ~ * ~ * ~ * ~ * ~ * ~ * ~ * ~ * ~ * ~ * ~ * ~ * ~ * ~ * ~ * ~ * ~ * ~
Note:
In no way is this intended as a financial/investment/trading advice. You are responsible for your own investment decisions and trades.
Please exercise your own judgement for your own trades base on your own risk-aversion level and goals as an investor or a trader. The use of OTHER indicators and analysis in conjunction (tailored to your own style of investing/trading) will help improve confidence of your analysis, for you to determine your own trade decisions.
~ * ~ * ~ * ~ * ~ * ~ * ~ * ~ * ~ * ~ * ~ * ~ * ~ * ~ * ~ * ~ * ~ * ~ * ~ * ~ * ~
Please check out my other indicators sets and series, e.g.
LIVIDITIUM (dynamic levels),
AEONDRIFT (multi-levels standard deviation bands),
FUSIONGAPS (MA based oscillators),
MAJESTIC (Momentum/Acceleration/Jerk Oscillators),
PRISM (pSAR based oscillator, with RSI/StochRSI as well as Momentum/Acceleration/Jerk indicators),
PDF (parabolic SAR /w HighLow Trends Indicator/Bar-color-marking + Dynamic Fib Retrace and Extension Level)
and more to come.
Constructive feedback and suggestions are welcome.
~ JuniAiko
(=^~^=)v~

Relative Candle Volatility IndexI am not certain if something similar is already available out there. However, here's my own implementation of my simple idea of using the length of the candle-body, or wicks (high-low), to derive a Relative Volatility Index / Oscillator.
In summary: When the R.CVI is significantly positive, it indicates a sudden increase in volatility; whereas, when the R.CVI drops significantly negative, it indicates a sudden decrease in volatility -- in relative to the (just prior) market trend.
If you do wish to copy, modify, and publish an alternate version base on this script, please do not plagiarize and kindly reference/link back to this original script. =D
~ * ~ * ~ * ~ * ~ * ~ * ~ * ~ * ~ * ~ * ~ * ~ * ~ * ~ * ~ * ~ * ~ * ~ * ~ * ~ * ~
Note:
In no way is this intended as a financial/investment/trading advice. You are responsible for your own investment decisions and trades.
Please exercise your own judgement for your own trades base on your own risk-aversion level and goals as an investor or a trader. The use of OTHER indicators and analysis in conjunction (tailored to your own style of investing/trading) will help improve confidence of your analysis, for you to determine your own trade decisions.
~ * ~ * ~ * ~ * ~ * ~ * ~ * ~ * ~ * ~ * ~ * ~ * ~ * ~ * ~ * ~ * ~ * ~ * ~ * ~ * ~
Please check out my other indicators sets and series, e.g.
LIVIDITIUM (dynamic levels),
AEONDRIFT (multi-levels standard deviation bands),
FUSIONGAPS (MA based oscillators),
MAJESTIC (Momentum/Acceleration/Jerk Oscillators),
PRISM (pSAR based oscillator, with RSI/StochRSI as well as Momentum/Acceleration/Jerk indicators),
PDF (parabolic SAR /w HighLow Trends Indicator/Bar-color-marking + Dynamic Fib Retrace and Extension Level)
and more to come.
Constructive feedback and suggestions are welcome.
~ JuniAiko
(=^~^=)v~

Relative Volatility IndexCorrected Relative Volatility Index. This indicator was originally developed by Donald Dorsey (Stocks & Commodities V.11:6 (253-256): The Relative Volatility Index).
The indicator was revised by Dorsey in 1995 (Stocks & Commodities V.13:09 (388-391): Refining the Relative Volatility Index).
I suggest the refined RVI with optional settings. If you disabled Wilder's Smoothing and Refined RVI you will get the original version of RVI (1993, as built-in).
Also, you can choose an algorithm for calculating Standard Deviation.

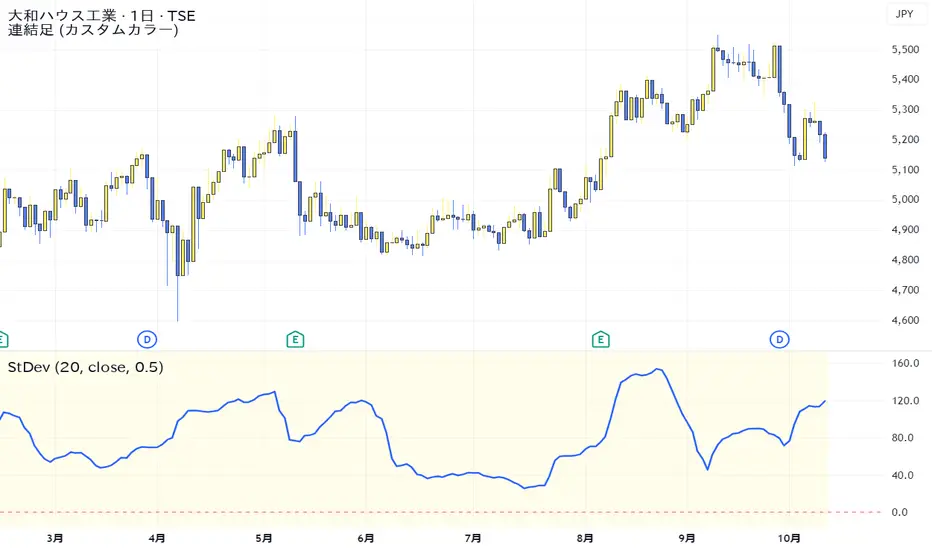
Standard Deviation VolatilityThe Standard Deviation (StDev) measures the volatility or dispersion of price from its historical average. Higher values suggest greater price fluctuation and potentially a trending market. Lower values indicate lower volatility, often found during consolidation or ranging markets.
標準偏差(Standard Deviation)は、価格の過去の平均からの**ばらつき(ボラティリティ)**を測る指標です。値が高いほど価格変動が激しく、トレンド相場であることを示唆します。値が低いほど、レンジ相場または保ち合いであることを示します。
EyeOn VolatilityEyeOn Volatility tracks how market volatility affects trading spreads. It adapts dynamically using recent price fluctuations and shows symmetric bid/ask bands around the chart. A live info box displays the current spread in percent, and an optional panel lets you review spread history over time.

Smart Volatility Squeeze + Trend Filter📌 Purpose
This indicator detects volatility squeeze conditions when Bollinger Bands contract inside Keltner Channels and signals potential breakout opportunities.
It also includes an optional EMA-based trend filter to align signals with the dominant market direction.
🧠 How It Works
1. Squeeze Condition
Bollinger Bands (BB): Length = 20, StdDev = 2.0 (default)
Keltner Channels (KC): EMA Length = 20, ATR Multiplier = 1.5 (default)
Squeeze ON: Occurs when BB Upper < KC Upper and BB Lower > KC Lower (low volatility zone).
2. Breakout Signals
Long Breakout: Price crosses above BB Upper after squeeze.
Short Breakout: Price crosses below BB Lower after squeeze.
3. Trend Filter (optional)
EMA(50) used to confirm breakout direction:
Long signals allowed only if price > EMA(50)
Short signals allowed only if price < EMA(50)
Toggle Use Trend Filter to enable/disable.
4. Visual & Alerts
Green circle at chart bottom indicates Squeeze ON.
Green/Red triangles mark breakouts.
Background gradually brightens during squeeze buildup.
Alerts available for long and short breakouts.
📈 How to Use
Look for Squeeze ON → then wait for breakout arrows.
Trade in breakout direction, preferably with trend filter ON.
Works best on higher timeframes (1h, 4h, D) and trending markets.
Markets: Crypto, Forex, Stocks — effective in volatile assets.
⚙️ Inputs
BB Length / StdDev
KC EMA Length / ATR Multiplier
Use Trend Filter
Trend EMA Length
⚠️ Disclaimer
This script is for educational purposes only. It does not constitute financial advice.
Always test thoroughly before live trading.

BB VolatilityBB Volatility indicator is monitoring the famous Bollinger Bands volatility in a normalised manner.
Could not find anything similar so thought this would be useful.
For confirmation signals of the BB to move into one or another direction it is complemented with SMA and EMA.
Additionally, it is complemented with Min Level of BB line - a level user can define and decide to use or not for even stronger conviction for a potential BB expansion.
How to use?
As it monitors when the BB narrows, it helps to identify potential price breakout moments in one or another direction.
Users can adjust duration and Min Level inputs as per security they are interested.
For better visualisation purposes, the background is plotted light green when BB crosses both SMA and EMA upwards. And plotted light red when BB crosses both downwards. Users can also adjust the colors as per their preferences.
This indicator just helps to define potential BB expansion moments. No indicator alone is perfect and for most effective use needs to be complemented with overall market context and other chart patterns.

Symbol vs Benchmark Performance & Volatility TableThis tool puts the current symbol’s performance and volatility side-by-side with any benchmark —NASDAQ, S&P 500, NIFTY or a custom index of your choice.
A quick glance shows whether the stock is outperforming, lagging, or just moving with the market.
⸻
Features
• ✅ Returns over 1W, 1M, 3M, 6M, 12M
• 🔄 Benchmark comparison with optional difference row
• ⚡ Volatility snapshot (20D, 60D, or 252D)
• 🎛️ Fully customizable:
• Show/hide rows and timeframes
• Switch between default or custom benchmarks
• Pick position, size, and colors
Built to answer a simple, everyday question — “How’s this really doing compared to the broader market?”
Thanks to @BeeHolder, whose performance table originally inspired this.
Hope it makes your analysis a little easier and quicker.

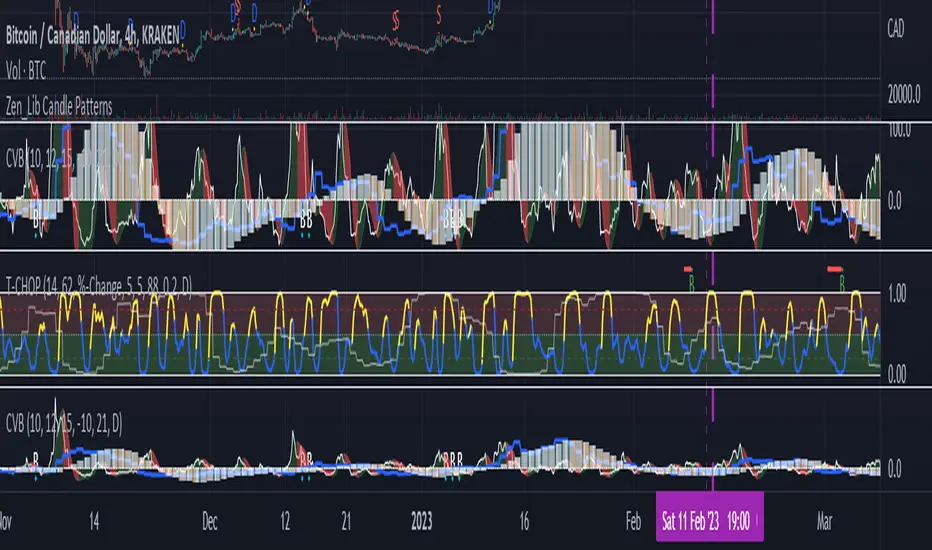
Market Volatility Key: CHOP, ATR, VIX & 10Y BondThis script builds upon existing market analysis tools by providing a comprehensive dashboard that combines the Choppiness Index (CHOP), Average True Range (ATR) with a user-selectable timeframe, VIX (Volatility Index), and the 10-year US Treasury bond price in a compact tile format. The color-coded key provides quick visual cues for market conditions—highlighting whether the market is trending or consolidating—allowing traders to make informed decisions quickly.
For example, when trading the Nasdaq (NQ), you might use this indicator to help manage your scalping trades. If you trade on a 10-minute chart but set the ATR timeframe to 1 minute, it helps identify whether there is enough price movement to justify entering a trade. If the ATR is less than 10, it suggests there's not enough range for scalping opportunities, and you may choose to stay out of the trade.
This expanded indicator integrates and enhances existing concepts to deliver a well-rounded view of volatility, trend strength, and market conditions all in one glance, making it an essential tool for both trend-following and scalping strategies.

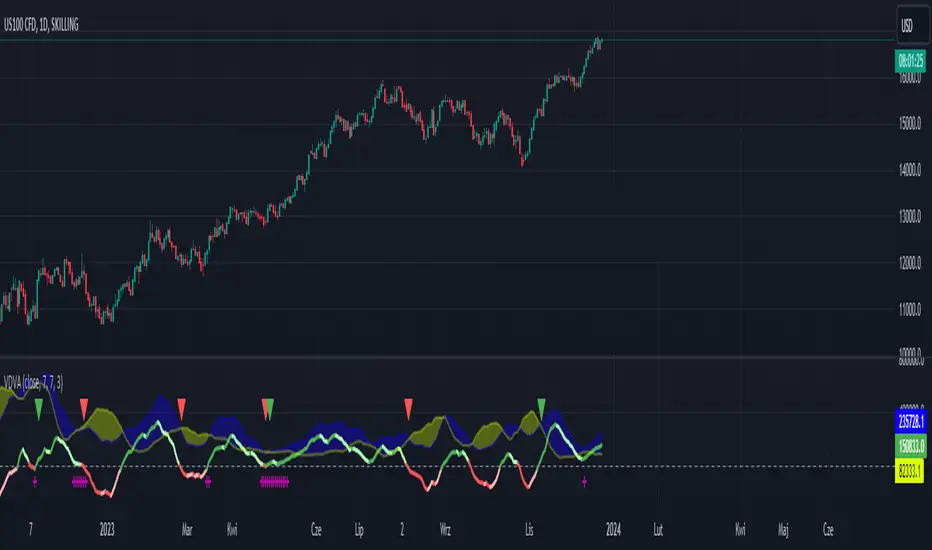
VDVA - Volume Delta Volatility AmplifierThis script defines an indicator named VDVA (Volume Delta Volatility Amplifier), which combines volume delta (the difference between volume up and volume down) and volatility (ATR) into one line. This line is then smoothed using a moving average and compared with the zero level and a shorter-period moving average. The script also plots shapes when the rate of change of the line exceeds the first standard deviation. Moreover, the script uses Bollinger Bands and Keltner Channels to determine the squeeze condition, which is a signal of a potential breakout. Finally, the script plots two bar charts that show the volume up and volume down multiplied by ATR.
dark green line - bullish
light green line - potential bearish
dark red line - bearish
light red line - potential bullish
blue cloud - bullish
yellow cloud - bearish
red triangle - bearish entry
green triangle - bullish entry
purple cross - squeeze
JZ_Chaikin HTF Volatility BreakoutFirst off, all credit to Harry Potter as this is a minor customization of his indicator.
Basic additions:
-- Added a Higher Timeframe that is set to Daily but can be changed. Timeframe does wait until barstate.isconfirmed so won't repaint.
-- Added HMA smoothing line to both Chart and HTF. Can be used as it's own signal, as confirmation or in combination with faster signal line -- Breakout signal & Range Highlight use both.
-- Added optional coloring of HMA based on whether increasing or decreasing.
-- Added a low volatility option that highlights Range/No Trade zones. Defval is off so needs to be selected from inputs.
Breakout Signals are very simple and both take the HTF signal and HMA. When the faster Volatility line rises from below zero and comes within the range of -10 to 0, AND the HMA signals is increasing (and also below zero) for confirmation, generates a breakout signal of an incoming big move. You can alter the breakout threshold to be greater or less than -10, I just found that works best for filtering out the noise and false signals. Won't catch everything, but pretty reliable when it does.
Tested mostly on BTC so can't vouch for other assets and would likely need modification.
I've JUST taught myself coding from scratch (and to say I'm an amateur is an understatement), so apologies in advance if anything is unclear or could be coded better. Open to any suggestions.
Heikin Ashi Volatility Percentile - TraderHalaiThe Heikin Ashi Volatility Percentile (HAVP) Oscillator was inspired by the legendary Bollinger Band Width Percentile indicator(known as BBWP), written by Caretaker, and made famous by Eric Krown, a famous influencer.
This script borrows aspects of the BBWP indicator which enables the HAVP oscillator to visually match the look and feel of BBWP and allows similar configuration functions (such as colouring function, smoothing MAs and alerts)
The fundamentals of this script are however different to BBWP. Instead of Bollinger band width, this script uses a reverse function of Heikin Ashi close (implemented in my Smoothed Heikin Ashi Trend
indicator, linked below).
The reverse Heikin Ashi close is smoothed using Ehler's SuperSmoother function, providing smooth oscillation and earlier signals of volatility tops and bottoms.
From an automated backtest that I have conducted on the BTCUSD index pair, I have observed comparable performance to BBWP across multiple timeframes when combining with stochastic direction to give a bias on overall direction. Using parameters I have tested, it performs better on mid-term timeframes such as 3h,4h and 6h. BBWP outperforms on 1h and 1d, with lower timeframes being comparable.
From the results, using HAVP over BBWP tends to result in reduced holding time and more frequent trades, which may or may not be desirable, although the behaviour can be adjusted using the parameters provided.
For instance, the smoother oscillation provided by HAVP provides a great predictability factor and earlier confirmation signals, which is something that Ehler emphasised in his trading style, and something which I agree with personally. I would encourage you to try out both HAVP and BBWP and see which fits your trading style.
Releasing this as open source allows for the betterment of the community and further development, criticism and discussion.
Thanks and enjoy! :)

Cryptogrithm's Secret Momentum and Volatility IndicatorThis indicator is hard-coded for Bitcoin, but you may try it on other asset classes/coins. I have not updated this indicator in over 3 years, but it seems to still work very well for Bitcoin.
This indicator is NOT for beginners and is directed towards intermediate/advanced traders with a sensibility to agree/disagree with what this indicator is signalling (common sense).
This indicator was developed back in 2018 and I has not been maintained since, which is the reason why I am releasing it. (It still works great though! At the time of this writing of May 2022).
How to use:
Terms:
PA (Price Action): Literally the candlestick formations on your chart (and the trend formation). If you don't know how to read and understand price action, I will make a fast-track video/guide on this later (but in the meanwhile, you need to begin by learning Order-Flow Analysis, please google it first before asking).
CG Level (Cryptogrithm Level/Yellow Line): PA level above = bullish, PA level below = bearish
CG Bands (Cryptogrithm Bands): This is similar to how bollingers work, you can use this the same was as bollinger bands. The only difference is that the CG bands are more strict with the upper and lower levels as it uses different calculations to hug the price tighter allowing it to be more reactive to drastic price changes (earlier signals for oversold/overbought).
CG Upper Band (Red Upper Line): Above this upper bound line means overbought.
CG Middle Band (Light Blue Line): If PA trades above this line, the current PA trend is bullish continuing in the uptrend. If PA trades below this line, the current PA trend is bearish continuing in the downtrend. This band should only be used for short-term trends.
CG Lower Band (Green Lower Line): Below this lower bound line means oversold.
What the CG Level (yellow line) tells you:
PA is trading above CG Level = Bullish
PA is trading below CG Level = Bearish
Distance between CG Level and price = Momentum
What this means is that the further away the price is from the CG Level, the greater the momentum of the current PA trend. An increasing gap between the CG Level and PA indicates the price's strength (momentum) towards the current upward/downward trend. Basically when the PA and CG Level diverge, it means that the momentum is increasing in the current trend and when they converge, the current trend is losing momentum and the direction of the PA trend may flip towards the other direction (momentum flip).
PA+CG Level Momentum:
To use the CG Level as a momentum indicator, you need to pay attention to how the price and the CG level are moving away/closer from each other:
PA + CG Level Diverges = Momentum Increasing
PA + CG Level Converges = Momentum Decreasing
Examples (kind of common sense, but just for clarity):
Case 1: Bullish Divergence (Bullish): The PA is ABOVE and trending AWAY above from the CG Level = very bullish, this means that momentum is increasing towards the upside and larger moves will come (increasing gap between the price and CG Level)
Case 2: Bearish Convergence (Bearish): - The PA is ABOVE the CG Level and trending TOWARDS the CG Level = bearish, there is a possibility that the upward trend is ending. Look to start closing off long positions until case 1 (divergence) occurs again.
Case 3: Neutral - The PA is trading on the CG Level (no clear divergence or convergence between the PA and CG Level) = Indicates a back and forth (tug of war) between bears and bulls. Beware of choppy price patterns as the trend is undecisive until either supply/liquidity is dried out and a winner between bull/bear is chosen. This is a no trade zone, but do as you wish.
Case 4: Bearish Divergence (Bearish): The PA is BELOW and trending AWAY BELOW from the CG Level = very bearish, this means that momentum is increasing towards the downside and larger downward moves will come (increasing gap between the price and CG Level).
Case 5: Bullish Convergence (Bullish): - The PA is BELOW the CG Level and trending TOWARDS the CG Level = bullish, there is a possibility that the downward trend is ending and a trend flip is occuring. Look to start closing off short positions until case 4 (divergence) occurs again.
CG Bands + CG Level: You can use the CG bands instead of the PA candles to get a cleaner interpretation of reading the momentum. I won't go into detail as this is pretty self-explanatory. It is the same explanation as PA+CG Level Momentum, but you are replacing the PA candles with the CG Bands for interpretation. So instead of the PA converging/diverging from the CG Level, the Upper and Lower Bound levels are converging/diverging from the CG level instead.
Convergence: CG Level (yellow line) trades inside the CG bands
Divergence: CG Level (yellow line) trades outside the CG bands
Bullish/Bearish depends on whether the CG Band is trading below or above the CG level. If CG Band is above the CG Level, this is bullish. If CG Band is below the CG level, this is bearish.
Crosses (PA or CG Band crosses with CG level): This typically indicates volatility is incoming.
There are MANY MANY MANY other ways to use this indicator that is not explained here and even other undiscovered methods. Use some common sense as to how this indicator works (it is a momentum indicator and volatility predictor). You can get pretty creative and apply your own methods / knowledge to it and look for patterns that occur. Feel free to comment and share what you came up with!

Market Maker Volatility Diameter V2 by Hawkeye Charting***German Description below***
Hey guys,
we are proud to publish the Market Maker Volatility Diameter V2!
Our goal with this indicator is to provide an All-in-one indicator, combining some special tools of open source scripts as well as some of our own developments and the algorithm of our MMVD V1.
We will create a video series very soon, where we will explain each aspect of the tool, your options and of course our trading strategies with this indicator.
You have the following technical tools and information combined in this indicator, which can each be shown and hidden:
- Psychological Ranges (Weekly Opening High/ Low for Crypto and Forex)
- Market Maker Sessions (Sydney, Asia, London, NY)
- Trade Cloud (algorithm developed by Hawkeye Charting)
- Fibonacci Cloud (inspired by watching paid offerings, coded by Hawkeye Charting)
- Display Moving Averages (select the visualization of up to 6 moving averages. You can change for each of these 6 MA's the type and the length.)
- Display Major Trend Cloud (developed by Hawkeye Charting)
- PVSRA Candle Colors
- Vector Candle Zones
- Pivots
- Pivot Fibonacci Levels (developed by Hawkeye Charting)
- OHLC-Levels
- Average Daily, Weekly, Monthly Ranges
- Volume Profile for Intraday Trading for up to 8 days.
We hope especially for people, who can not afford the Pro offering from TradingView, to give access to a good indicator, which includes many tools and alerts.
Our goal is to lower the barriers for new entrants and of course to protect people, to pay for indicators, which are completely insane priced.
Only, that you get an idea: the whole indicator has only cost me about 100 h of work (for a single person!), and I'm no Pine script expert, so don't get fooled when someone offers you insane amounts for an indicator...
There is no holy grail. Each indicator works only with calculations on previous data.
We appreciate seeing that you guys like this work, so please leave a like and a follow and share this indicator.
*****German Description*****
Hey Leute,
wir sind stolz, unsere 2. Version des Market Maker Volatility Diameter zu veröffentlichen!
Unser Ziel ist es, mit diesem Indikator eine All-In-One Lösung anzubieten, welche einige nicht ganz geläufige Tools sowie unsere eigenen Entwicklungen und natürlich den Algorithmus des MMVD V1 vereinen.
Wir werden in naher Zukunft eine Video Serie veröffentlichen, in welcher wir Stück für Stück jeden Aspekt des Werkzeugs, die Einstellungsmöglichkeiten sowie unsere Trading Strategien mit diesem Indikator erklären werden.
Ihr habt die folgenden technischen Werkzeuge und Informationen in diesem Indikator vereint, welche jede einzeln an- oder abgewählt und eingestellt werden können:
- Psychological Ranges (Weekly Opening High/ Low für Krypto and Forex)
- Market Maker Sessions (Sydney, Asia, London, NY)
- Trade Cloud (Algorithmus von Hawkeye Charting entwickelt)
- Fibonacci Cloud (inspiriert von der Beobachtung eines Paid-Indikators, Code geschrieben von Hawkeye Charting)
- Moving Averages (Ihr könnt die Darstellung von bis zu 6 Gleitenden Durchschnitten auswählen und für jeden dieser Durchschnitte den Typ und die Länge ändern.)
- Display Major Trend Cloud (entwickelt von Hawkeye Charting)
- PVSRA Candle Colors
- Vector Candle Zones
- Pivots
- Pivot Fibonacci Levels (entwickelt von Hawkeye Charting)
- OHLC-Levels
- Average Daily, Weekly, Monthly Ranges
- Volume Profile für Intraday Trading, Darstellungsmöglichkeit für 3-8 Tage
Wir hoffen, dass wir speziell für Leute, die sich nicht das PRO-Abo aufwärts von TradingView leisten können, Zugang zu einem guten Indikator, welche viele Werkzeuge und Alarme vereint gewährleisten zu können.
Unser Ziel ist es, die Eintrittsbarrieren für neue Marktteilnehmer senken und natürlich Leute vor wahnsinnigen Paid-Angeboten beschützen zu können.
Nur, damit ihr eine Vorstellung bekommt: den gesamten Indikator hat mich lediglich 100h Arbeit gekostet (für eine einzelne Person!), und ich bin kein Pine Script Experte. Also lasst euch bitte nicht verar******, wenn euch Paid-Angebote erreichen, mit dem Versprechen, den "zu 95% erfolgreich" Indikator erwerben zu können.
Es gibt keinen heiligen Gral, jeder Indikator arbeitet nur mit Berechnung von Vergangenheitswerten.
Wir würden uns riesig freuen, wenn euch diese Arbeit gefällt und ihr uns Likes und Follows hinterlasst und ihr diesen Indikator teilt.

Directional Volatility and VolumeAn oscillator that manages to display the direction of volatility and volume in a single indicator. This allows viewing the trend in concert with the volume strength. Thus a trader can check if the price movement has volatility and volume behind it or not.

[GM-PRO] Money ManagementVolatility riskreward moneymanagement
This script tells you where to place your Initial Take Profit Targets and Stop Losses both long and short. The position of these targets is based on price volatility (using ATR to calculate).
Distance of stop loss and take profit can be modified as multiples of the ATR.
For a 2:1 reward:risk ratio, set Take Profit to 2 and Stop Loss to 1.
Coming Soon:
BASELINE
- over 20 moving averages to chose from
- ATR bands
- trend colored candles and signals on crossover
TDFI (Trend Direction and Force Index ).
- Ultimate Volatility Indicator
- Keeps you out of flat Matkets
- Many settings to tweak for optimization.
