Volatility BeltThe Volatility Belt is a Premium indicator which plots in the price chart a simple-to-read volatility color bar.
The indicator allows plotting multiple Volatility Studies, including:
Squeeze
Bollinger Bands Volatility
Volatility Index
TTM Squeeze
Historical Volatility
Additional volatility studies might be included down the road.
If you're interested in this one, please PM me.
ابحث في النصوص البرمجية عن "Volatility"

Volatility IndexWhat is volatility and why does it matter?
Volatility is a measure of how much the price of an asset varies over time.
Volatility refers to the amount of uncertainity or risk about the size of changes in a finacial asset's value. A higher volatility means that the price of the asset can change dramatically over a short time period in either direction.
A lower volatility means that a financial asset's value does not fluctuate dramatically, but changes in value at a steady pace over a period of time.
How does the volatility gets calculated?
It uses the standard deviation of the closing price for the preceding selected period (i.e. 30, 60...) and plots the value in relative terms (%).

Volatility Strategy 01a quantitative volatility strategy (especially effective in trend direction on the 15min chart on the s&p-index)
the strategy is a rule-based setup, which dynamically adapts to the implied volatility structure (vx1!–vx2!)
context-dependent mean reversion strategy based on multiple timeframes in the vix index
a signal is provided under following conditions:
1. the vvix/vix spread has deviated significantly beyond one standard deviation
2. the vix is positioned above or below 3 moving averages on 3 minor timeframes
3. the trade direction is derived from the projected volatility regime, measured via vx1! and vx2! (cboe)

Volatility & Momentum Nexus (VMN)Volatility & Momentum Nexus (VMN)
This indicator was designed to solve a common trader's problem: chart clutter from dozens of indicators that often contradict each other. The Volatility & Momentum Nexus ( VMN ) is not just another indicator; it's a complete analysis system that synthesizes four essential market pillars into a single, clean, and intuitive visual signal.
The goal of VMN is to identify high-probability moments where a period of accumulation (low volatility) is about to erupt into an explosive move, confirmed by trend, momentum, and volume.
VMN analyzes the real-time confluence of four critical elements:
The Trend (The Main Filter): A 100-period Exponential Moving Average (EMA) sets the overall context. The indicator will only look for buy signals above this line (in an uptrend) and sell signals below it (in a downtrend). The line's color changes for quick visualization.
Volatility (Energy Accumulation): Using Bollinger Bands Width (BBW), the indicator identifies "Squeeze" periods—when the price contracts and builds up energy. These zones are marked with a yellow background on the chart, signaling that a major move is imminent.
Momentum (The Trigger): An RSI (Relative Strength Index) acts as the trigger. A signal is only validated if momentum confirms the direction of the breakout (e.g., RSI > 55 for a buy), ensuring we enter the market with force.
Volume (The Final Confirmation): No breakout move is credible without volume. VMN checks if the volume at the time of the signal is significantly higher than its recent average, adding a vital layer of confirmation.
Green Arrow (Buy Signal): Appears ONLY when ALL the following conditions are met simultaneously:
Price is above the 100 EMA (Bullish Trend).
The chart is exiting a Squeeze zone (yellow background on the previous bar).
Price breaks above the upper Bollinger Band.
RSI is above the buy threshold (default 55).
Volume is above average.
Red Arrow (Sell Signal): Appears ONLY when all the opposite conditions are met.
Do not treat signals as blind commands to trade. They are high-probability confirmations.
Look for signals near key Support/Resistance levels for an even higher success rate.
Always set a Stop Loss (e.g., below the low of the signal candle or below the lower Bollinger Band for a buy).
All parameters (EMA, RSI, Bollinger Bands lengths, thresholds, etc.) can be customized from the settings menu to adapt the indicator to any financial asset or timeframe.
Disclaimer: This indicator is a tool for educational and analytical purposes. It does not constitute and should not be interpreted as financial advice. Trading involves significant risk. Always perform your own analysis and backtesting before risking real capital.

Volatility Adjusted Grid [Gann]█ OVERVIEW
Gann Square of 9 is one of the many brilliant concepts from W.D.Gann himself where it revolves around the idea that price is moving in a certain geometrical pattern. Numbers on the Square of 9 spiral tables, especially those lie in every 45degree in the chart act as key vibration levels where prices have tendency to react to (more on the table below).
There are few square of 9 related scripts here in Tradingview and while there's nothing wrong with them, it doesn't address 1 particular issue that i have: The numbers can be too rigid even when scaled based on current price because the levels are fixed, which makes them not tradable on certain timeframes depending on where the price currently sitting.
Heres 5min and 1hour Bitcoin chart to illustrate what i mean: Grey line on the left is based on Volatility Adjusted levels, while red/blue on the right are the standard Gann levels.
You can see that on 1hour chart, it provides a good levels (both Volatility Adjusted and the standard one happened to share the same multiplier in this case),
1Hour Chart:
On 5 min chart tells a different story as the range between blue/red levels can be deemed as to big for a short term trade, while the grey line is adjusted to suit that particular timeframe (You can still adjust to make it bigger/smaller from the settings, more on this below)
5Min Chart:
█ Little bit on Gann Square of 9 table
This is the square of nine table, the numbers highlighted in Red are known as Cardinal Cross and considered to be a major Support/Resistance while those in Blue color are known as Ordinal Cross considered as minor (but still important) Support/Resistance levels
Similarly, this script use these numbers (and certain multipliers) to print out the levels, with Cardinal numbers represented by solid lines and Ordinal numbers by dotted lines.
█ How it Works and Limitations
The Volatility Adjusted grid will go through several iterations of different multipliers to find the Gann number range that is at least bigger than times ATR. Because it's using ATR to determine the range, occasionally you'll notice that the line become smaller as ATR contracting (and vice versa). To overcome this, you can change the size range multiplier from the settings to retrieve the previous range size.
Use the size guide at the bottom left to find the multiplier that suits your need:
1st Row -> Previous Range -- Change Range Size to number lower than this to get a smaller range
2nd Row -> Next Range -- Change Range Size to number higher than this to get a larger range
Example:
Before:
After:
As you'll soon realise, the key here is to find the range that fits the historical structure and suits your own strategy. Enjoy :)
█ Disclaimer
Past performance is not an indicator of future results.
My opinions and research are my own and do not constitute financial advice in any way whatsoever.
Nothing published by me constitutes an investment recommendation, nor should any data or Content published by me be relied upon for any investment/trading activities.
I strongly recommends that you perform your own independent research and/or speak with a qualified investment professional before making any financial decisions.
Any ideas to further improve this indicator are welcome :)

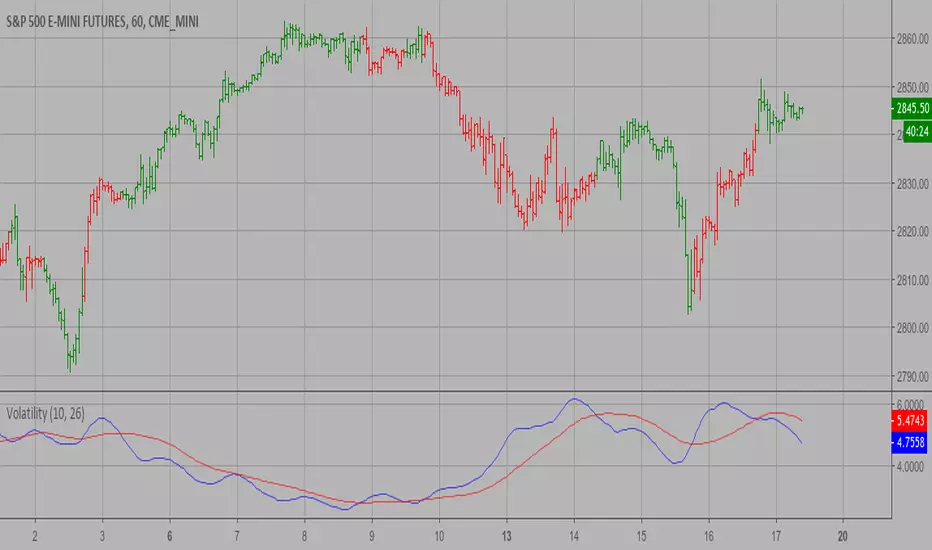
Volatility Color‴What does it do?
Used for calling your attention to rally price movements:
1. red color: signals that the market is "hot" and price spread might be on its way;
2. blue color: signals that the market is "cold" and regular or no price spread will be seen;
3. right side bar signals the market mood (hot or cold) in order to call your attention
How does it work?
When the indicator color is red the market tends to move fast and with volume. The distance between the volatility colored and the black moving average lines gives you a hint of the volatility direction.
This indicador is used in conjunction with other indicadtor in the BOLLINGER BLAST setup that provides a way bigger knowledge of a huge price rally.
What's my filling?
It's just great once you DO NOT have to keeo your eyes on the indicator, just let the red color pop up into your eyes. In other words, let the indicator work for you, let it do the easy stuff while you focus on the strategic part of the trade.
Indicator attributes:
- red color suggests trade with rally and or volume
- blue color suggests regular or weak trade
- right side bar: signals the suggested trade mood (same volatility lines signals)
To have access to this indicator, please DM me.
Don't contact me in the comment area.

Volatility IndexThis indicator is based on Historical Volatility (HV) built-in indicator with minor tweaks to match the Bitcoin Volatility Index (from Bybt).
Also, you can select a symbol to compare its volatility with the volatility of the currently selected symbol.

Volatility of Volatility MA - LayeringProvides a volatility of volatility moving average to show trends in Vol of Vol. Meant to be used with Volume MA, and Volatility MA, layered on top of eachother.

Volatility OptimizerI created Volatility Optimizer to test various volatility conditions and how they affect signals/indicators I create for my customer. It pits long-term, short-term and middle-term ranges against each other. Whichever is highest will also print a dot on the top of the indicator window.
Most indicators and strategies work well in only one area. Whether you differentiate market phases to contraction/expansion/trend or sideways/impulse wave/correction, Optimus might help you filter out wrong signals. For example, in the impulse wave, the shortest period range (Blue) should get quickly on top. If you are seeking opportunities in the correction phase, it is when red should be dominant.
The lengths of ranges need to be set based on your strategy and timeframe. If you look many candles back, the preset values probably need to be increased.
You may look are which volatility length average is highest. You might also look at which one is ascending or descending.
Good luck!

LOSS2PROFIT-BB/KC-VOLATILITY-BANDVOLATILITY SQUEEZE INDICATOR
BB-BOLLINGER BAND (SHOWS STANDARD DEVIATION VOLATILITY )
KC-KELTNER CHANNEL (SHOWS TRUE RANGE VOLATILITY)
IT IS COMBINATION OF BB AND KC WHICH SHOWS SQUEEZE VOLATILTIY ON PRICE.
WHENEVER UPPER AND LOWER BOLLINGER BAND SQUEEZES AND ENTER INTO THE KELTER CHANNEL UPPER AND LOWER BAND AREA, PRICE VOLATILITY SQUEEZES AND CHANCE OF HIGH BREAKOUT TOWARDS TREND DIRECTION.
EMA20 ACT AS A DYNAMIC SUPPORT AND RESISTANCE ,ALSO SHOWS MINOR TREND .
USE HEDGING TECHNIQUE TO GET MAXIMUM PROFIT...

Volatility Quality Zero Line This technical indicator plot the current market volatility with trend direction signals. If the curve is above the zero line, market is bullish, if it is below, market is bearish.
It is calculated with recent market range compounded from the OHLC values of Weighted moving average. The pro of this indicator is that it can’t avoid ranging market because of its embedded volatility filter : when you are already in a trend, no inverse signal will be given unless a new reversal volatility is detected. The con is that because of its smoothing over the last 15 periods (default parameter), trend catching maybe a little
late to appear on screen.
-----
Este indicador técnico dibuja la volatilidad del mercado con señales de tendencia. Si la linea esta arriba de la linea de cero , el mercado es alcista, SI esta abajo, es bajista.
Es calculado con el rango reciente del mercado , compuesto por medias móviles ponderadas de valores OHLC. Agarrar la tendencia puede ser medio tardío, ya que esta suavizado por los últimos 15 periodos.
Port from prorealcode.

Volatility IndicatorThe Volatility Index measures the market volatility by plotting a smoothed average of the True Range.
Based on HPotter's idea (),
it returns an average of the TrueRange over a specific number of bars.
Here the result is passed through the Fisher's transform and normalized to 0/1-range.
This indicator may be used to identify stretches in the price movements, suitable for entry.

Volatility Across CoinsCompare the recent volatility of 8 cryptocurrencies, based on percentage change per candle.
Useful for volatility strategies to find the highest volatility coins over recent periods or to get an at-a-glance view of volatility correlations.
Options to change the resolution and find average % change per candle over user defined length.
Key:
BTC = Yellow/Gold
ETH = Purple
LTC = Gray
NEO = Green
IOTA = Light Blue
XMR = Orange
BCH = Red
Dash = Blue

Volatility MeasureThis indicator is super simple, it gives you the average amount of volatility (IN PERCENT) in any given asset over any given timeframe over the last 100 periods. Adjustable. This is useful for gauging volatility, risk, reward, opportunity set, and more. It can help you set stop losses, tell how much risk you are actually taking based on historical measures, and how much of what you do is based on skill or luck. Enjoy!
Pholesolus

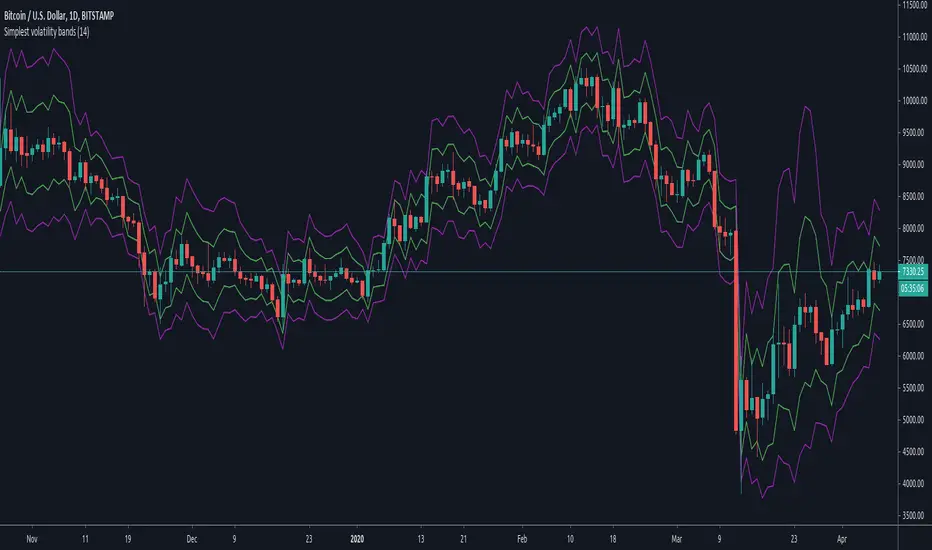
Simplest volatility bandsVolatility bands based on average candle percentage spread. Tested on BTCUSD charts only.
Based on the 68-95-99.7 rule, it seems that the spread, for daily and 4-H candles, follows a normal distribution: that means, around 85% of candles have a %-spread within sma(low/high, some_len) and sma(high/low, some_len) , and around 95% of candles within the pow2 of that range.
If you take the mean between the boundaries of the first %-spreads band, and calculate the 1.5 standard deviation of past some_len candles (I'm speaking from memory, it has been a while since I did them), the 1.5 standard deviation bands match similarly the %-spread bands, and around 85% of the candles are within these %-spread bands.
If you then take the pow2 of the bands, it will be similar to the 2 * std of the original bands, with around 95% of data within the pow2 bands.
You can take ema or other similar means with similar results, and the same for different lengths, but it seems that sma with a len of 14 is the more stable ones for both daily and 4-H, and taken other average calculations doesn't cause too many differences respect to the sma. I haven't tested too much for lower or higher timeframes.
With those %-spread bands, I multiple and divide those spreads to the open value of a new candle to get the two bands.
So, in short, you know that 85% of candles are within the closer bands, and around 95% of candles, around the bigger one. Once a new candle is born, the bands won't move (the bands are calculated from the previous candle, so the current candle's price movement doesn't move the band).
Going out the bands implies a sudden increase in volality, which usually causes rejection. They happen mostly at breakouts and ends of heavy trends. If a candle closes above the bigger band, you have probably got a breakout (a rejection rarely happens if the candle have already closed), although a breakout can happen without closing above the bands if volatility was already high.
If a trend is already stablished and is healthy, you won't probably see candles going out the bands, not even with a wick. When the trend is parabolic, and goes above the candle, the trend has probably ended, although the trend can be exhausted without going out the bands as well.
Heavy but not yet exhausted trends (specially recently started heavy downtrends), usually reach the bottom of the bigger bands during 4 o 5 contiguous candles (check visually looking at bitcoin history though, I'm speaking from memory).
So, the possibilities are multiple and you cannot use the bands to form a strategy, as usual. It can be comfortable enough psycologically for going to sleep, by moving your stop-loss to a point out of the bands in the opposite direction of your trade, and adjusting your position size accordingly; or just to check momentum looking at how close are the candle limits to the bands.
But, as usual, you are responsible of what you do with your money :)
Volatility Strategy The Volatility function measures the market volatility by plotting a
smoothed average of the True Range. It returns an average of the TrueRange
over a specific number of bars, giving higher weight to the TrueRange of
the most recent bar.
WARNING:
- This script to change bars colors.
Volatility Calculator for Daily Top and Bottom RangeWith the usage of ATR, applied on the close of the daily candle, I am calculated the volatility channels for the TOP and BOTTOM
Based on this logic, we can estimate, with a huge confidence factor, where the prices are going to be compressed for the trading day.
Having said that, lets take a look at the data gathered among the most important financial markets:
SPX
TOP CROSSES : 2116
BOT CROSSES : 1954
Total Daily Candles : 18908
Occurance ratio = 0.215
NDX
TOP CROSSES : 1212
BOT CROSSES : 1183
Total Daily Candles : 9386
Occurance ratio = 0.255
DIA
TOP CROSSES : 759
BOT CROSSES : 769
Total Daily Candles : 6109
Occurance ratio = 0.25
DXY
TOP CROSSES : 1597
BOT CROSSES : 1598
Total Daily Candles : 13156
Occurance ratio = 0.243
DAX
TOP CROSSES : 1878
BOT CROSSES : 1848
Total Daily Candles : 13155
Occurance ratio = 0.283
BTC USD
TOP CROSSES : 416
BOT CROSSES : 417
Total Daily Candles : 4290
Occurance ratio = 0.194
ETH USD
TOP CROSSES : 247
BOT CROSSES : 268
Total Daily Candles : 2452
Occurance ratio = 0.21
EUR USD
TOP CROSSES : 820
BOT CROSSES : 805
Total Daily Candles : 7489
Occurance ratio = 0.217
GOLD
TOP CROSSES : 1722
BOT CROSSES : 1569
Total Daily Candles : 13747
Occurance ratio = 0.239
USOIL
TOP CROSSES : 1077
BOT CROSSES : 1089
Total Daily Candles : 10231
Occurance ratio = 0.212
US 10Y
TOP CROSSES : 1302
BOT CROSSES : 1365
Total Daily Candles : 9075
Occurance ratio = 0.294
Based on this, we can assume with a very high confidence ( 70-80%) that the market is going to stay, within the range created from the BOT and TOP ATR points.

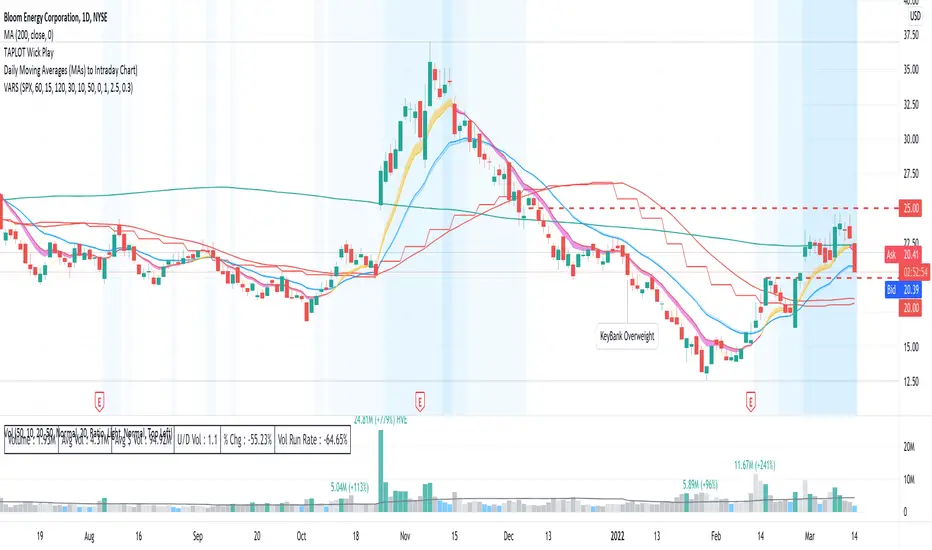
Volatility Adapted Relative StrengthVARS uses a stock's ALPHA in comparison to the SPX to determine whether there is RS on an volatility adjusted basis.
Volatility in PipsThis indicator shows volatility in Pips as text in order to analyze how much price moves in different timeframes.
-Today’s pips variation
-Yesterday’s pips variation
-Past N day’s average pips variation (N = user input)
e.g. If today is Oct15 and you select 2, then average pips variation is average of yesterday(Oct14) and 2days ago(Oct13)'s pips variation.
-This week’s pips variation
-Last week’s pips variation
-This month’s pips variation
-Last month’s pips variation
Assets in scope is currently Forex, Gold, Silver and Cruide Oil.
Enjoy!
——————————————
ボラティリティをPips数でメインチャートにテキスト表示するインジケーターです。
監視対象通貨のボラティリティ分析用にお使いください。
表示できる情報
-本日Pips変動
-前日Pips変動
-過去N日間平均Pips変動(Nはユーザ設定)
例: 本日が10月14日の時に2を選択すると、10月13日(昨日)と10月12日(一昨日)の二日間の平均Pips変動を計算します。
-今週Pips変動
-先週Pips変動
-今月Pips変動
-先月Pips変動
対象の商品はFX、ゴールド、シルバー、原油です。

Volatility Quality Histogram (NicoadW)This indicator is based on the Volatility Quality Index ( VQI ) by Thomas Stridsman.
It shows the slope of the VQI in form of a histogram.
The VQI is calculated in the following Steps:
1. Applying a WeightedMovingAverage with the onto the low, open, high, close and prior close
2. Calculating the true range and the range from the results of step 1 and setting them into relation
3. Calculating a weighted lumpsum of the results from step 2 (This is the value of the widely known VQI )
4. The change from the current value of step 3 compared to the last value is the VQI-Slope
5. The VQI-Slope is filtered by only recogning changes greater as the User-Input
6. If the Slope is rising, its considered a long trend and if its falling its considered a short trend
User Inputs
Valuation Period: Length of the WMAs
Filter in Pips: minimum change of the VQI-Slope to result in a Trend-Change
Visuals
Inrease the size of the Signal: Highligts the Trend-Changes
Color Chart Bars: Colors the bars of the main chart depending on the trend given by the VQI

Volatility OscillatorThis tool displays relative volatility and directional trend. Excellent way to pickup diversions and reversals. Length can be lowered to 11 or 13 in settings to show price range.
Can be used to identify patterns such as parallel channels and likely direction of price action as pictured below.

Volatility Support & Resistance [LM]Hello guys,
I would like to introduce you volatility support and resistance horizontals. It draws line horizontal on high and low vhighly volatile candles. You can select lines on this timeframe and/or another one. It's done in the same spirit like my other indicators for horizontals
The colors are dynamic depending whether price is below or above the line:
for the current timeframe green is used for support and blue for resistance
for the other timeframe by default 4h orange is used for support and violet for resistance
There are various sections in setting:
general settings - here you can select ATR length, multiplier and show labels
show and hide section of the current timeframe
other timeframe
show and hide other timeframe horizontals
Any suggestions are welcome

Volatility Quality Zero Line MAP-- VOMVolatility Quality Zero Line MAP
15 min
30 min
1 H
2 H
4 H
6 H
8 H
12 H
1 D
Suscribe!
