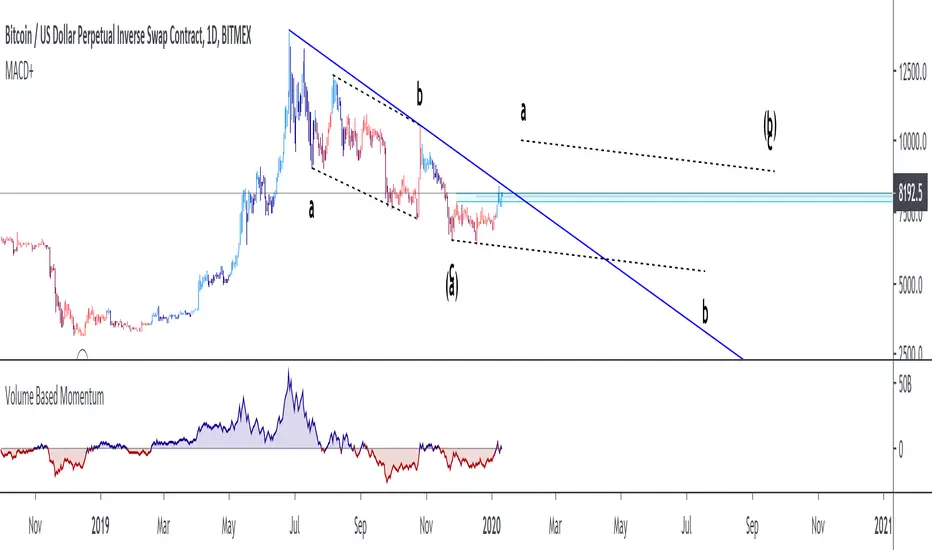
Volume Based MomentumThis is a volume based momentum indicator that should be used to spot regular and hidden divergences. This has some similarities to OBV, but it is not OBV and should be treated uniquely.
Input selections are 1-5, a higher number is better on a lower timeframe. When viewing daily or weekly, you should probably be on 1. When viewing timeframes such as 15 minute, 4 is most likely sufficient.
ابحث في النصوص البرمجية عن "Volume"
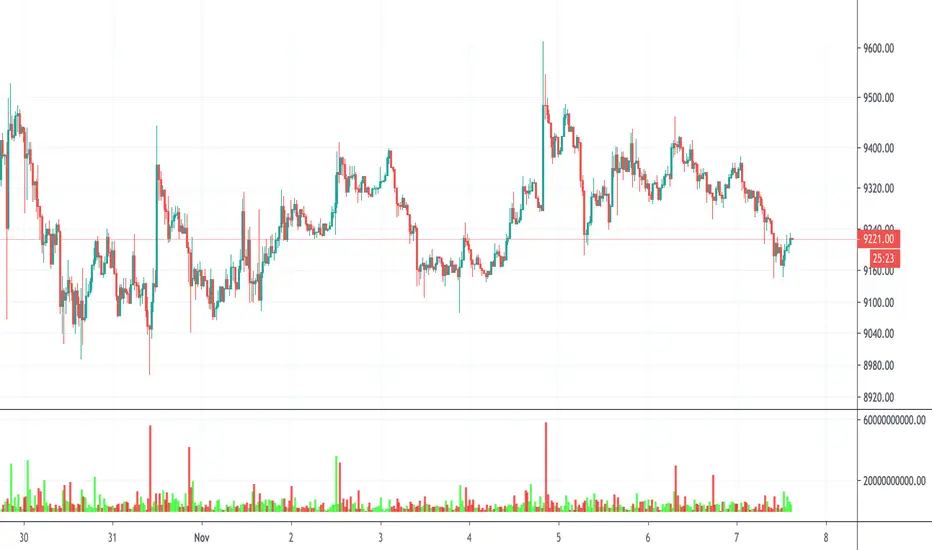
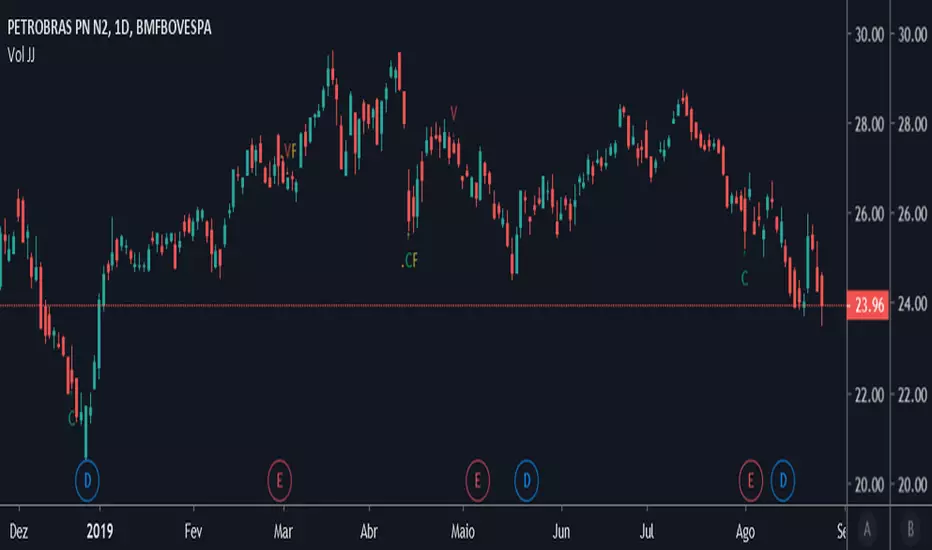
Volume JJEstudo baseado no volume
Se superar o dobro da EMA 21 Compra
Se não superar a metade da EMA 21 Venda
Se superar o triplo da EMA 21 Compra Forte
Se não superar um terço da EMA 21 Venda Forte


Volume Direction [MarkPark]In case a market volume is changing routinely, It is useful to see which is meaningful

Volume CandleHighlight significant Candles, i.e. those candles that carry volume above the average volume of the chosen period by the chose proportion.
The value=1.25 with period=20 will highlight candles with volume 125% above the volume average for the last 20 candles.


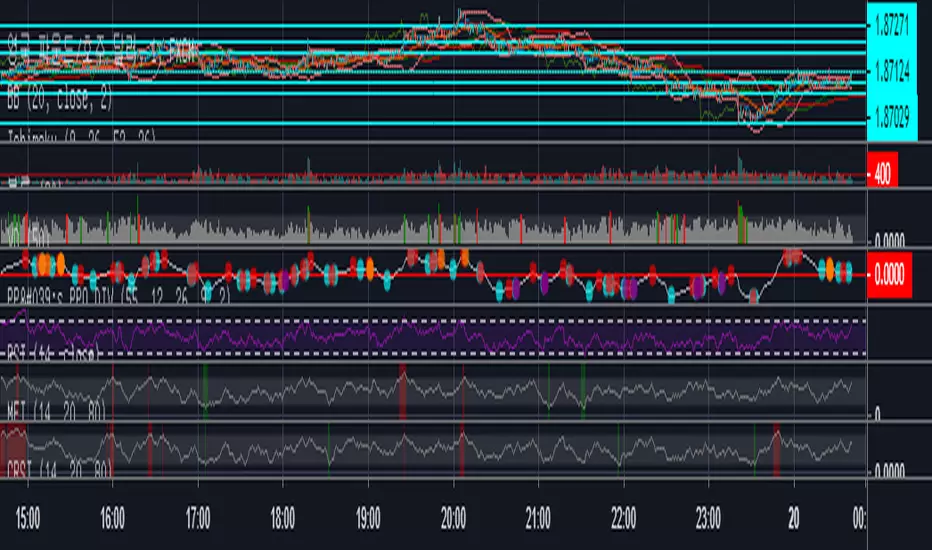
Volume RSI altsSo this allow you to put major alts against each other and compare the Volume RSI to each other and to the alts that you are currently looking In this example we see TRX breaking from the major pack of the other alts in 1D chart making the breakthrough up
Each alt has it own color
if you want to add more alts just copi paste and add the code for your alt to make this system better for you
here you see how XRP break from the pack show in arrow down
here on 4 h chart we see LTC is breaking before BTC (its a btc chart and LTC in orange)

Volume Trend HistogramsColor-Coded Volume Trend indicator, if bars are green, volume is increasing, if bars are red volume is decreasing. Bar height tells trend strength

Volume change analysis**this is a test script written to excercise with pinescript**
this script will track for sudden change in volume and will print an histogram to show how much volume has changed bar to bar against a smoothed volume ma.
use volume ma in settings for smoothing purpose.


Volume Flow Indicator [LazyBear]LFThis is Lazybear's port of VFI by Katsanos, which ideally requires 2 different sets of coefficients for intraday vs longer term charts. I added definitions of the values to allow for one set to be used intraday while the other is used for resolutions of 1d or more. This version will dynamically adapt the coefficients using the chart's resolution. I've also added options to show crosses with the MA and the zero line, and the possibility to have the zero line change color when using the long term set of coefficients, as a reminder.
LazyBear's original version is here .
This is the Katsanos documentation on VFI: www.mkatsanos.com .

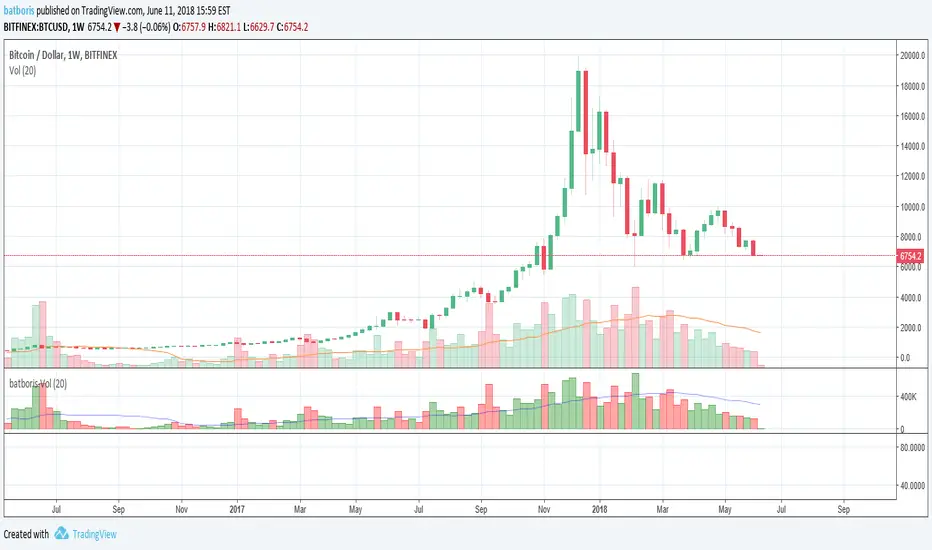
batboris-VolumeVolume colored by all candle components (open, close, low and high) instead of open and close only
Volume+Price Action AlertThis script identifies sudden changes in both volume and price.
You can set the sensitivities for both volume change and price change with respect to the moving averages.
There are four inputs in this script: the first two parameters indicate the length for moving averages of volume and price and the last two parameters indicate how much the volume change (e.g. 2 times) or the price change (e.g. 0.01; that is 1 percent of close price) should be.

VolumeThis is an OBV (On Balance Volume) with two different moving averages on it plus a bollinger band set to OBV to find the squeeze and expansion points on OBV. As you many know, OBV is one of those indicators that can show you the volume and not only that but also the direction that volume is going.

Volume in moneyThe indicator estimates the money volume of a certain bar.
The indicator gives control if to present the volume by units / by money
The indicator gives control if to color differently bars that the price increased / decreased and if the volume support the price movement


Volume with High-Volume Highlight + ThresholdThis indicator highlights true high-volume candles without guessing.
It compares the current bar’s volume to the average volume over the last X candles and highlights bars that exceed your chosen threshold (ex: 1.5× the average).
Features
Automatic high-volume detection
Customizable volume multiplier
Bull/bear color coding
Average volume line
Threshold line (shows exactly where “high volume” begins)
Optional on-chart label showing the required volume level
Alert for any high-volume bar
What It’s Used For
Identifying breakout strength
Confirming bounce setups at key levels
Spotting real buyers/sellers stepping in
Avoiding fake moves with weak volume
Simple Rule
If volume is greater than (Average × Multiplier) → the bar is highlighted.
