ابحث في النصوص البرمجية عن "Volume"

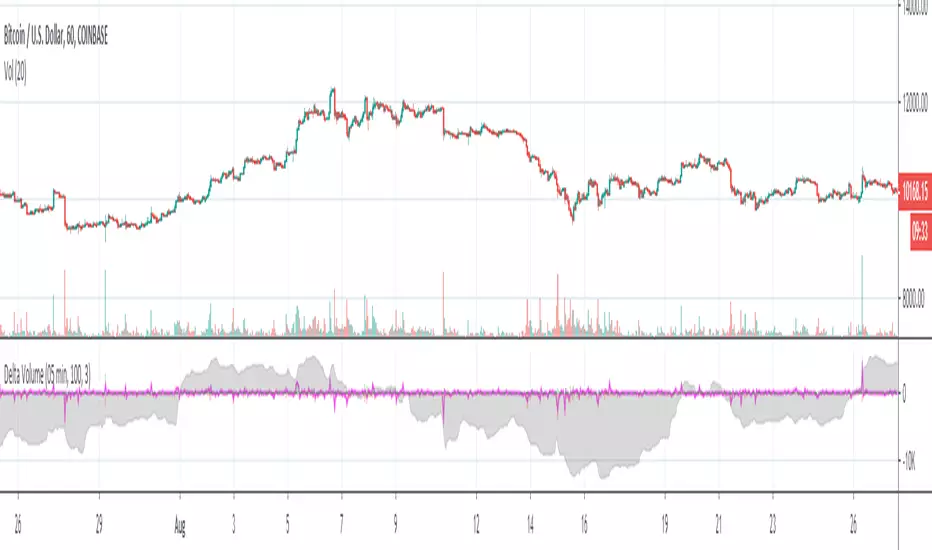
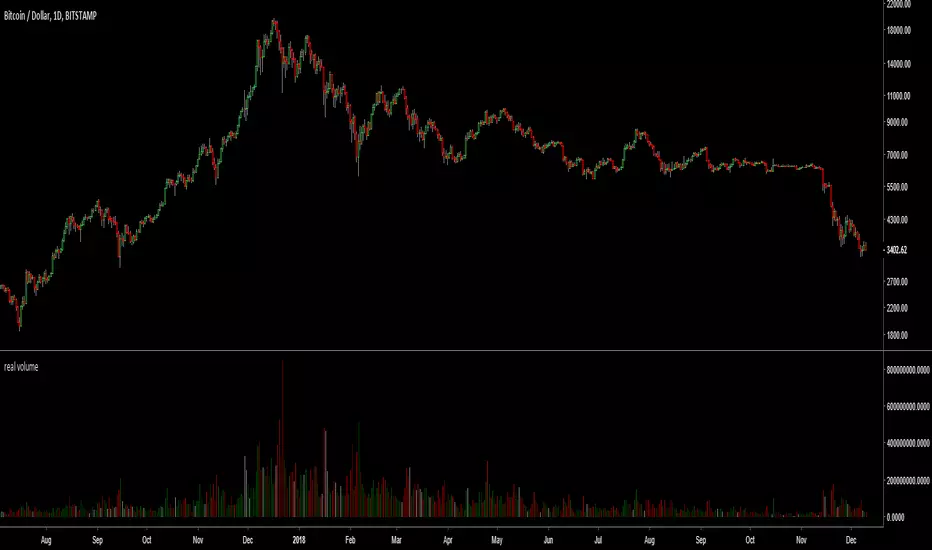
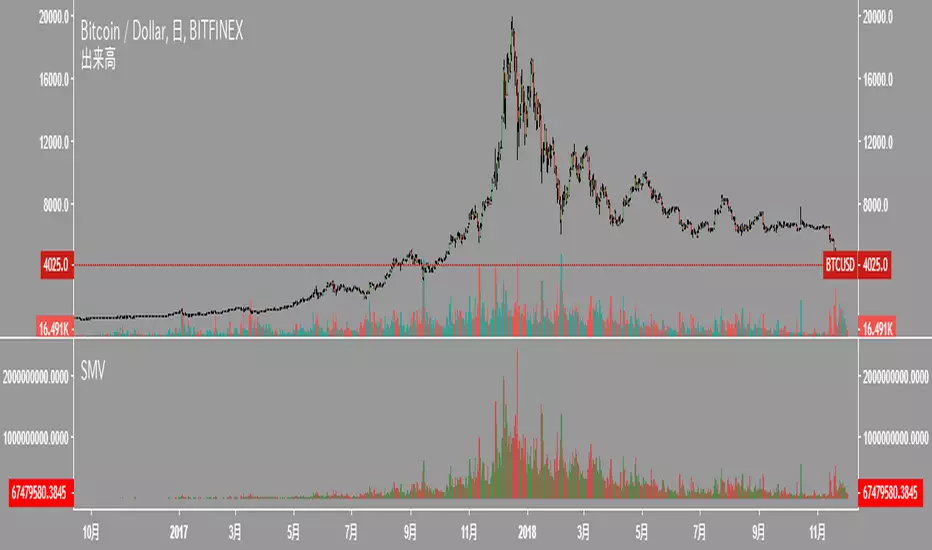
real (colored) volumeThis script plots the volume in terms of the underlying base (e.g. USD or btc) not number of coins traded. It plots volume*mid price.
In addition, the volume color density depends on the candle body divided to high-low. Very green for long up candle body, grey means short candle body compared to high-low, very red for long down candle body. It may provide some indications of the strength of bulls versus bears.
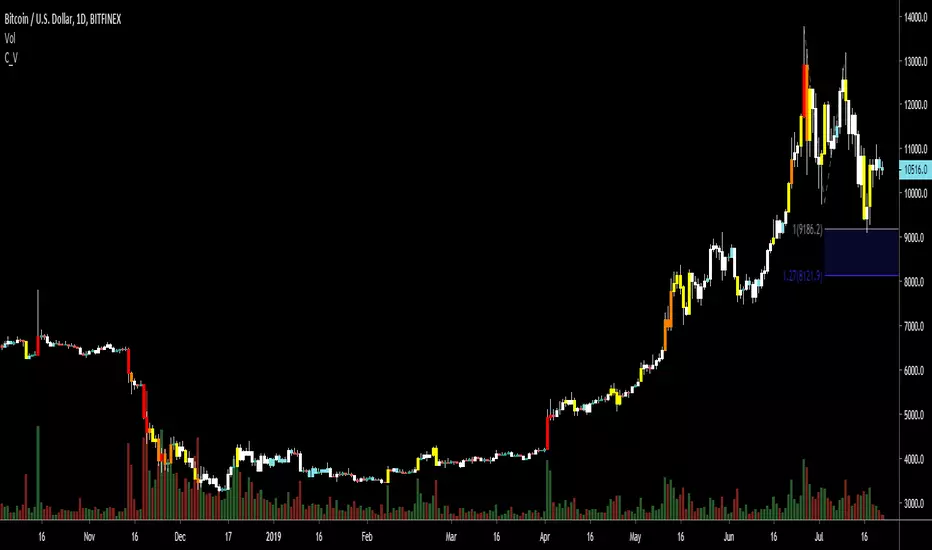
C Volume BarsOk do not take this one as serious as I made it as a joke .Its a volume bar that give you such great results and you can call it with fancy names and even hide the code . as there is no signals no one will pay attention that its repaint . And folks can even pay you money for it as its look so good. I even give you the script to show you how generous I am :)
its even better then the fancy name one as it actually give you time frames to choose from.
but on the other hand who said that repainting is bad?
mine look better:)))

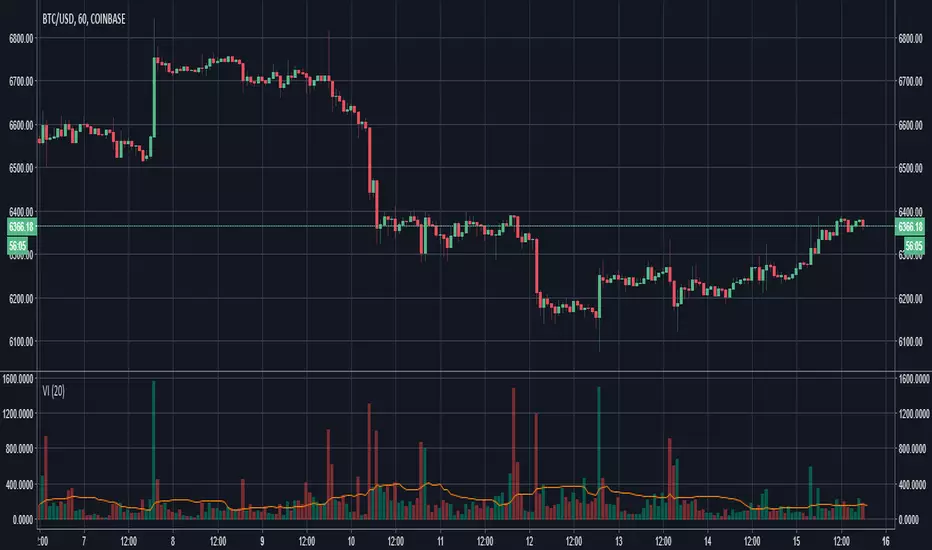
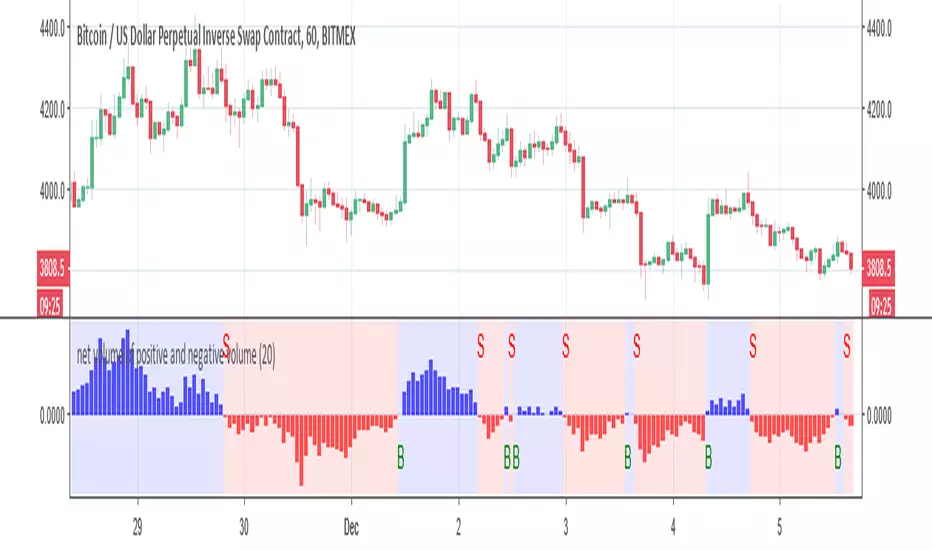
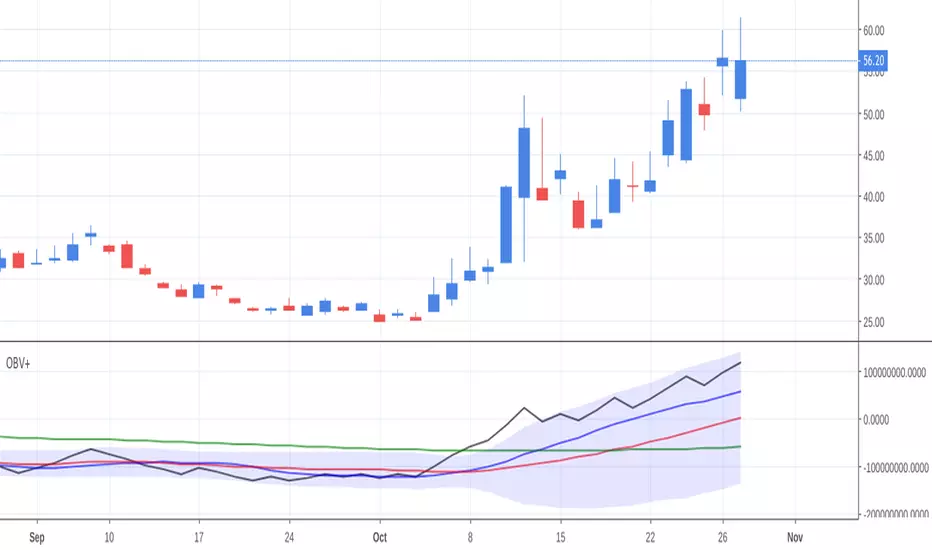
net volume of positive and negative volume buy and sell alertThis indicator try to give the mean number of bars in regarding to net volumes
This signal is produce by either cross up the 0 =buy or crossdown the 0 =sell
alerts inside
you can play with length to make optimization

BTC Volume Stacked [v2018-11-17] @ LekkerCryptisch.nlCombine the volume of 8 BTCUSD(T) exchanges in one graph.
Two use cases:
1) Stack the absolute volume to see the combined volume in BTC over time.
2) Stack the relative volume to see the relative size of exchange change over time.

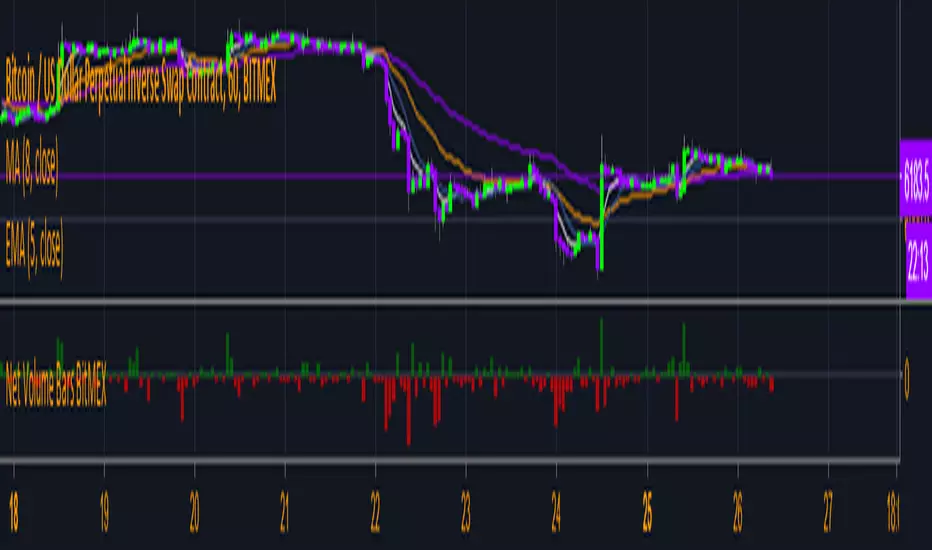
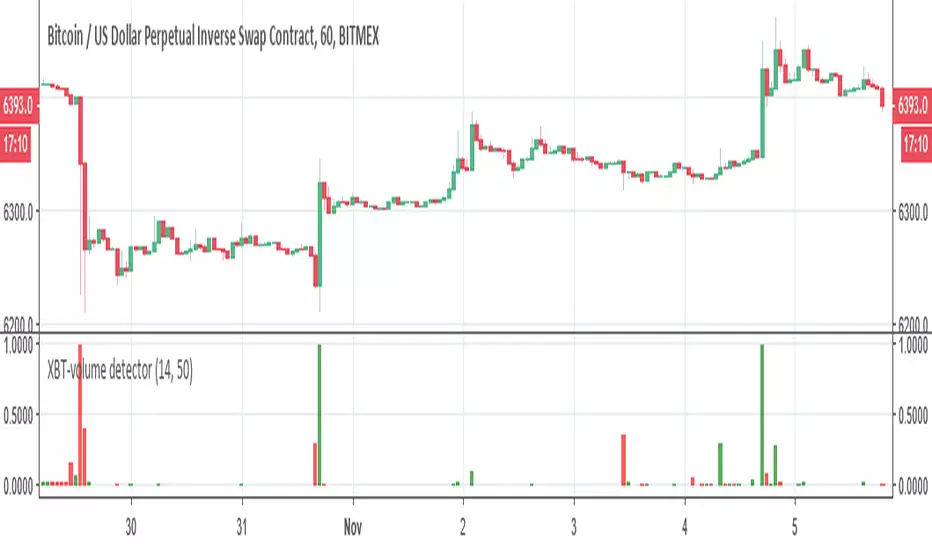
XBT-volume detectorThis is XBT volume detector . it working on bitmex for XBT detection of volume changes, I suggest to play between 30 min to 1 hour graph candle
it will give you a very nice look on potential breakout or downfall ..
I normalize it so you can make alerts if you wish
have fun
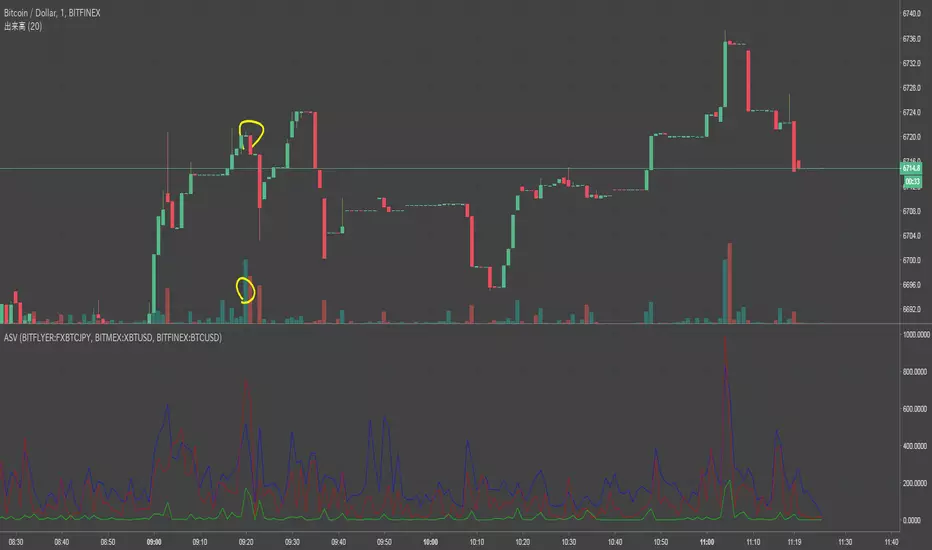
Another symbol volumepull another symbol volume
dafult:BF(blue)/MEX(red)/FINEX(lime)
*need MEX's volume devided XBTUSD
if you input another symbol as sym2, please comment out line 11 and remove "/mext" on line 12
mext=security(sym2,period,close)
plot(sym2v/mext,color=red)
//mext=security(sym2,period,close)
plot(sym2v,color=red)
#101 Volume Data Overlay [bionis]#101 Volume Data Overlay indicator for team CryptoSociety and their community


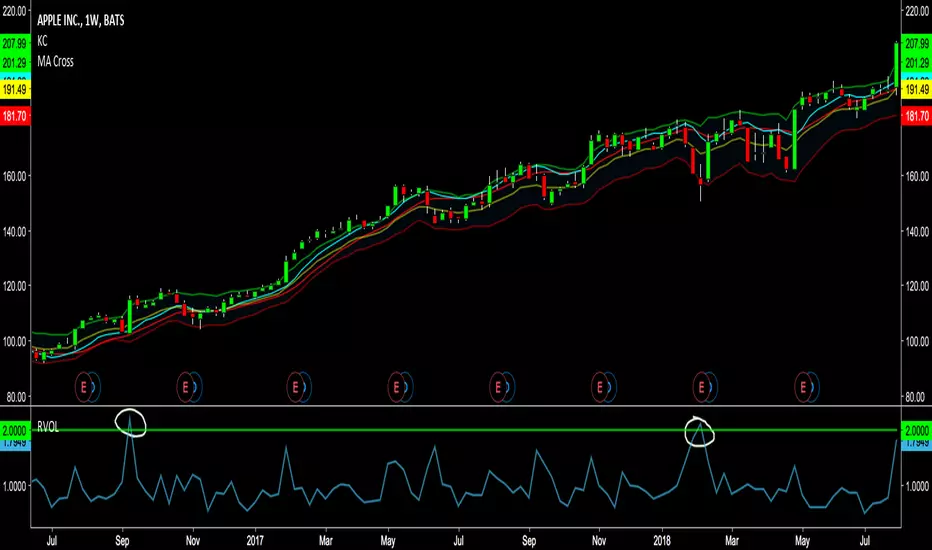
RVOL - Relative VolumeSee how much "in play" a stock is, filter the noise and take action on the big volume spikes.
v volume new RSIso this is by far my best creation
the indicator is V volume which is similar to VPT ( my design) and after normalization we can make it to function as similar to RSI only much more accurate.
buy is above 20
sell above 80
have fun
please give remarks on how to make it better:)

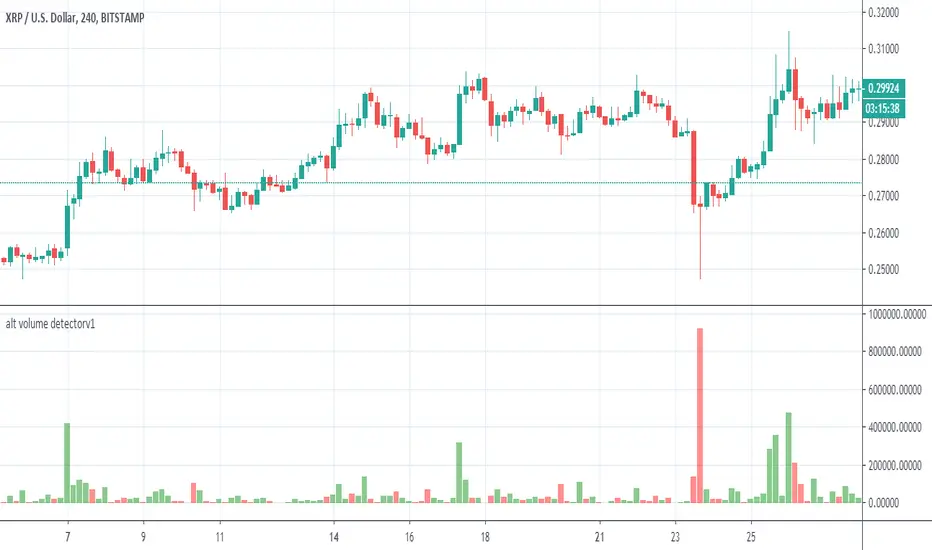
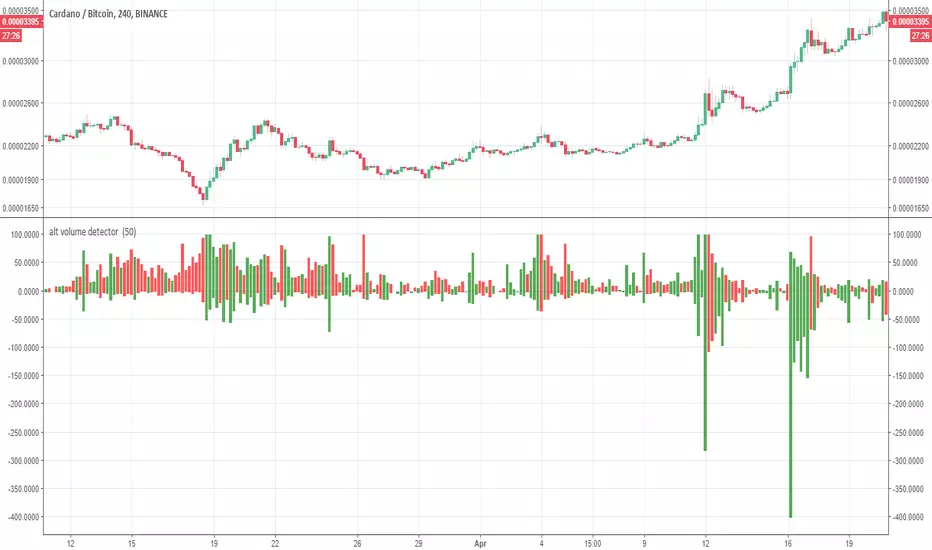
alt volume detectorv1 so this diffrent version of alt volume detector ,
on bitcooin its work nice on 1 day charts ' on alts trade against BTC 4H and bellow
when you loock on it think on accordion:)
alt volume detector this symple indicator will show you volume break on allts (only alts against BTC and graph 4 hours)
great indicator to find volume break up or down
i made the script open for you to have fun or to improve it
put any alts on 4 hours graph and have fun
make your own alerts and get all alts when thery break
i did not set alerts for it
but it easy to do it:)

Separate Volume IndicatorFor those that want the volume indicator in a separate view, this is for you. Now you can apply drawing tools, scale, hide, whatever you wish to the volume graph.
This is very similar to "Unmerge down" when applying the volume graph, but the idea being you can add more customization to the pine script rather than applying separate indicators.