Heikin Ashi+RSI+EMA Strategy 2.0 v4 [Cryptocurrency] by GodtrixHi,
I know a lot of people are looking for a more sophisticated and customizable strategy tool, I'm facing the same problem too, so I created one for myself and decided to share it for free trials and if you think this tool do what you wanted, you can contact me for the subscription "Premium" version.
I'll keep it simple with point forms, if you have any further inquiries or questions, please feel free to message me. Thank you.
Best profit plan with this strategy is you trade on Future leverage while you hold on to your coin, so that when price goes up, your coin value goes up, and at the same time, you trade with your leverage to earn even more, easily doubling up your total profit.
Benefits:
Fully customizable and you can easily personalized it and FINE TUNE it according to the market or coin you trading on.
The strategy is based on REAL PRACTICAL trading skills, so it works in real-world.
I fixed the "repainting" issue so the backtest it shows you IS ACCURATE when you run for real-time.
We all know one indicator is not going to help you win your trades, so this strategy combines ALL three: EMA for long+short term trend, HA for short term trend, RSI for entry/exit
This strategy is designed for LONG trade (Buy low, Sell high), not for SHORT trade.
This is not day trading, it is more to mid-term trading, where there's only few trades per month
Mainly is coded to work with 3Commas bot auto trading, so you only need to key in your Bot ID & Email Token.
Bot trading NOTE:
You need to replace the Alert Message with this: {{strategy.order.alert_message}}
One Alert will work for both Buy and Sell Order
If you using other Bot service, you can enter Custom Command too, so it works on any bot service.
Lastly,
regarding the setting advice, I would say you try playing with different settings and your objective is to achieve a backtest result that has:
1) Profitable is > 80%
2) Losing trades is nearly 0 or below 25% of your winning trades. Trick is using far stop loss %
3) Net Profit be almost same or more than "Buy & Hold Profit"
If you interested in our subscription version, message me for price.
Best Luck & a million dollar profit to you,
Godtrix BITSTAMP:BTCUSD BINANCE:DOTUSDT
ابحث في النصوص البرمجية عن "alert"

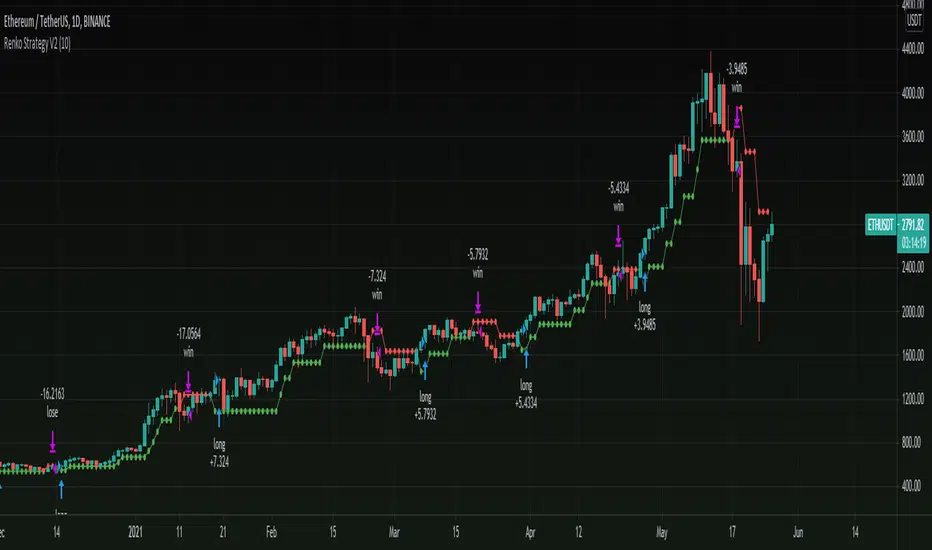
Renko Strategy V2Version 2.0 of my previous renko strategy using Renko calculations, this time without using Tilson T3 and without using security for renko calculations to remove repaint!
Seems to work nicely on cryptocurrencies on higher time frames.
== Description ==
Strategy gets Renko values and uses renko close and open to trigger signals.
Base on these results the strategy triggers a long and short orders, where green is uptrending and red is downtrending.
This Renko version is based on ATR, you can Set ATR (in settings) to adjust it.
== Notes ==
Supports alerts.
Supports backtesting time ranges.
Shorts are disabled by default (can be enabled in settings).
Link to previous Renko strategy V1:
Stay tuned for version V3 in the future as i have an in progress prototype, Follow to get updated:
www.tradingview.com
MrBS:Directional Movement Index [Trend Friend Strategy]This goes with my MrBS:DMI+ indicator. I originally combined them into one, but then you cannot set alerts based on what the ADX and DMI is doing, only strategy alerts, so separate ones have more flexibility and uses.
Indicator Version is found under "MrBS:Directional Movement Index " ()
//// THE IDEA
The majority of profits made in the market come from trending markets. Of course there are strategies that would say otherwise but for the majority of people, THE TREND IS YOUR FRIEND (until the end). The idea is to follow the trend, entering once it has established its self and exiting positions when the trend weakens. This strategy gives a rough idea of the returns produced from following purely the ADX signals. At first Heikin Ashi values were used for the calculation but the results show it's not that effective. The functionality to switch between calculation types has been left in, so we can uses HA candle data to generate signals from while looking at an OHLC chart, if we want to experiment. Due to the way strategies work, we are unable to get reliable results when running the strategy on the HA chart even if we are calculating the signals from the real OHLC values. It is best to always run strategies on standard charts.
When using this strategy, I look for confirmation of the signal based on stochastic (14:3:6) direction, reversal level of stochastic, and divergance, to add confidence and adjust position size accordingly. I am going to try and code some version of that in future updates, if anyone can help or has suggestions please drop me a message.
//// INDICATOR DETAILS
- The default settings are for optimized Daily charts, for 4 hour I would suggest a smoothing of 2.
- The default values used for calculation are the Real OHLC, we can change this to Heikin Ashi in the menu.
- The strategy enters a position when ADX crosses the threshold level, and closes the position when ADX starts to fall.
- There is a signal filter in the form of a 377 period Hull Moving Average, which the price must be above or bellow for long and short positions respectively.
- The strategy closes the position when a cross-under of the ADX and its 4 period EMA. This is an attempt to stay into positions longer as sometimes the ADX will fall for 1 bar and then keep rising, while the overall trend is strong. The downside to this is that we exit trades later and this affects our max drawdown.

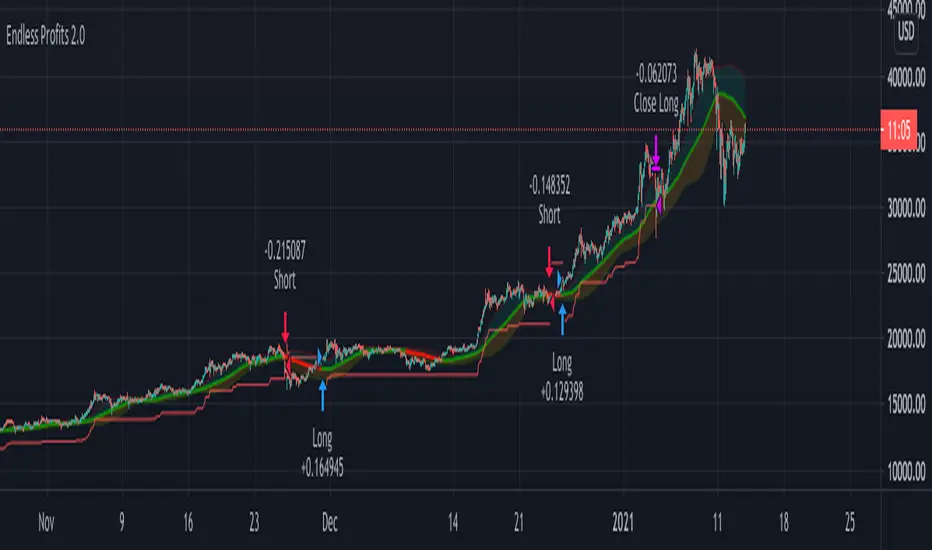
Profits Unlimited Pro Strategy** This is the backtesting (strategy) version of ~ Profits Unlimited Pro ~ proprietary script in TradingView. **
~ Profits Unlimited Pro Strategy ~
֎ Trading system script on tradingview that brings an easy approach to trading with a high profitability rate
֎ Our proprietary formula was developed over the course of the past two years through a combination of trial and error and algorithmic backtesting.
-- HOW IT WORKS --
֎ The algorithm starts with a proprietary script combining custom inputs with a formula that works with custom bollinger bands settings and specific RSI levels to results in deadly accurate signals for long and short entry points.
but that's not all...
֎ When we first developed our formula, we noticed that it produced a lot of accurate signals but also didn't fully understand the dynamics of market momentum and trending directions...
...so there were a lot of needless calls being made that were reducing profitability.
You see, most markets spend roughly 80% of the time trading sideways with no significant trend either up or down...
...And trading these sideways markets commonly result in what's called a "whipsaw"...
A whipsaw is when price is moving in one direction but then quickly pivots to move in the opposite direction resulting in a loss. And nobody wants to be stuck trading in a sideways market getting killed by whipsaws all day...
So what did we do to fix this?...
-- THE WINNING FORMULA --
֎ We added the Average Directional Index into our custom formula with a goal of teaching the algorithm to only trade during periods of strong momentum and trends whether up or down.
֎ We also added trend exhaustion levels to give clear indication for exit signals and help determine best times of getting out of a trade.
֎ Trend Exhaustion Levels work in conjunction with trailing stop loss % and both are customizable for ideal exits and profitability.
֎ The results are mind blowing!
-- WHO IT'S FOR --
֎ Optimized for crypto markets, to catch trend movements as soon as possible and maximize profitability
֎ It's A Swing Traders Dream.
-- What You Get --
֎ Sell & Buy alerts, Stop Loss alerts and always adding new features!
֎ Customizable settings.
֎ Chrome Extension in development for fine-tuning settings automatically(COMING SOON)
-You will be able to select an asset. push a button. and the extension will find the best settings for you!
֎ Users Facebook community for learning, sharing and direct support
If you’d like to test the trading script in TradingView, I can give you access to a 10 days trial.
Please send me PM in tradingview and I’ll activate it right away.
Thank you!
K-system A ver.1.0.2K-system A
------------------------------------
K-system A Function
------------------------------------
You can have entry alerts sent out automatically when you meet the conditions you specified.
You can have settlement alerts sent automatically when you meet the conditions you specified.
You can display three different moving averages and settlement lines.
------------------------------------
Entry conditions
------------------------------------
・Target price range: Enter the price range you want to buy.
・Target period range: Enter a target period of time to buy.
------------------------------------
Exit conditions
------------------------------------
・Excessive holding period: When the specified period is exceeded while the position is held.
・Loss cutting price: When the percentage of the price decline against the entry price is exceeded.
・Winning price: When the target profit is achieved.
・Trailing stop (2 steps)
・Percent trailing stop
------------------------------------
Line display on the chart
------------------------------------
・It is possible to automatic display three types of moving averages and the settlement line on the chart.
------------------------------------
How to use this strategy
------------------------------------
・If you want to use this strategy, please contact me via a personal message to qualify for access.
------------------------------------
------------------------------------
K-system A
------------------------------------
■K-system A 機能説明
------------------------------------
あなたが指定した条件を満たした時に、エントリーアラートを自動的に配信することが出来ます。
あなたが指定した条件を満たした時に、決済アラートを自動的に配信することが出来ます。
3種類の移動平均線と決済ラインを表示することが出来ます。
------------------------------------
■エントリー条件
------------------------------------
・価格指定:買いたい価格を入力
・期間指定:買うタイミングを狙う期間を入力
------------------------------------
■決済条件
------------------------------------
・保有期間超過:ポジションを保有しながら指定期間が超過した場合
・ロスカット価格:エントリー価格に対する価格の下落率を超えた場合
・利益確定:目標の利益を達成した場合
・トレーリングストップ(2段階)
・パーセントトレーリングストップ
------------------------------------
■チャートへのライン表示
------------------------------------
・3種類の移動平均線と決済ラインをチャート上に自動的に表示することが出来ます。
------------------------------------
■このストラテジーを使用するには
------------------------------------
このストラテジーを使用するにはプライベートメッセージを使用して、このストラテジーへのアクセス権を取得してください。

Bitcoin (BTC) Scalp / Short-term Short IndicatorThe purpose of this scalping Indicator is to help identifying Sell signals for short term trades on Bitcoin (Spot, Features, etc.) .
This script is working with more indicators and everything is balanced by hard work on (back)testing.
Result for users is a simple signal to SELL.
You can use it as easy indicator in your graph or create alerts.
I have the best results on 1min graph, with leverage and stop-loss feature.
This is my own version of scalping Sell Script / Indicator, which is a combination of few indicators, for example RSI , BB and price levels (actual and average) and works on standard candles.
SELL signal paints above the candle and you can set your target / trailing / stop-loss in the settings and check how it works in Strategy Tester.
Settings of this Indicator:
Take Profit
Stop Loss
Trailing Stop Loss
Trailing Stop Loss Offset
Initial Capital
Base Currency
Order size
Pyramiding
Commissions
Slippage
Average price lines (colors and visibility)
Plot background
These signals can be often observed at the beginning of a strong move, but there is a significant probability that these price levels will be revisited at a later point in time again.
Therefore these are interesting levels to place limit orders.
A Sell signal is defined as the last up candle before a sequence of down candles.
In my trading settings I have more but small positions, one safety limit order (for price averaging = better entry - easier close in profit) and stop-loss.
Sometimes trailing-profit feature have very nice profits.
Settings depends on your own money-management and free capital.
Don't ignore UP / DOWN trend. For UP trend I have an Indicator too (check my profile).
In addition to the upper/lower limits of each line, also average value is marked as this is an interesting area for price interaction and better view.
PM me to obtain access, more informations or support.
NOTICE: By requesting access to this script you acknowledge that you have read and understood that this is for research purposes only and I am not responsible for any financial losses you may incur by using this script.

Bitcoin (BTC) Scalp / Short-term Long IndicatorThe purpose of this scalping Indicator is to help identifying Buy signals for short term trades on Bitcoin (Spot, Features, etc.) .
This script is working with more indicators and everything is balanced by hard work on (back)testing.
Result for users is a simple signal to BUY .
You can use it as easy indicator in your graph or create alerts.
I have the best results on 1min graph, with leverage and stop-loss feature.
This is my own version of scalping Buy Script / Indicator, which is a combination of few indicators, for example RSI, BB and price levels (actual and average) and works on standard candles .
LONG signal paints below the candle and you can set your target / trailing / stop-loss in the settings and check how it works in Strategy Tester .
Settings of this Indicator:
Take Profit
Stop Loss
Trailing Stop Loss
Trailing Stop Loss Offset
Initial Capital
Base Currency
Order size
Pyramiding
Commissions
Slippage
Average price lines (colors and visibility)
Plot background
These signals can be often observed at the beginning of a strong move, but there is a significant probability that these price levels will be revisited at a later point in time again.
Therefore these are interesting levels to place limit orders.
A Buy signal is defined as the last down candle before a sequence of up candles.
In my trading settings I have more but small positions, one safety limit order (for price averaging = better entry - easier close in profit) and stop-loss.
Sometimes trailing-profit feature have very nice profits.
Settings depends on your own money-management and free capital.
In addition to the upper/lower limits of each line, also average value is marked as this is an interesting area for price interaction and better view.
PM me to obtain access, more informations or support.
NOTICE: By requesting access to this script you acknowledge that you have read and understood that this is for research purposes only and I am not responsible for any financial losses you may incur by using this script.

[SATS]Foreca$ter Backtester **This is Backesting version of Foreca$ter Indicator. Access of backtester will be gained together with access of Foreca$ter**
Foreca$ter is an indicator design for trend trading.
Description:
Foreca$ter is originally design for trend trading, but with the timeframe focus on lower timeframe eg: 15mins, 5mins and lower, it can be used as indicator scalping.
There are symbol in Foreca$ter indicator that preview on the where next possible Buy/Sell signal might be generated and pay attention on it.
In the setting, multiple signal can be toggle on to shows multiple signal that generated. It also provide the ability to set SL and multiple TP targets for alert setting.
The algorithm is based on multiple aspect to signal Buy and Sell signal. Below are the aspect behind.
-Determine support resistance on higher time frame using pivot level.
-Multiple EMAs cross are use for trend determination.
-On lower timeframe, breakout of support or resistance follow by trend confirmation to signal Buy and Sell
-The signals are ticker specified and there is fine tuned between different tickers and timeframe. Therefore it only works on the specified tickers and timeframe in the sysmbol.
User Manual:
Symbol: You must match the symbol with the pairs and timeframe for it to works. Eg: For "Binance: BTCUSDTPERP 15mins" you need to set the ticker as Binance: BTCUSDTPERP and set timeframe to 15mins
Show Info Panel: Toggle on and off of info panel.
Multiple Entry: Toggle on to generate signal whenever the condition are met. This give you next possible entry if you missed the current one.
Customizable stoploss and multiple take profit target
Alert for Buy/Sell, SL and multiple TP
Current support pairs:
-BTCUSDTPERP 15mins
-BNBUSDTPERP 15mins
-LINKUSDTPERP 15mins
-LINKUSDTPERP 5mins
-LINKUSDTPERP 3mins
Remarks:
- Foreca$ter is continuous develop on new pairs and on different timeframe.
DM us in TV or our Discord for access to the indicator.

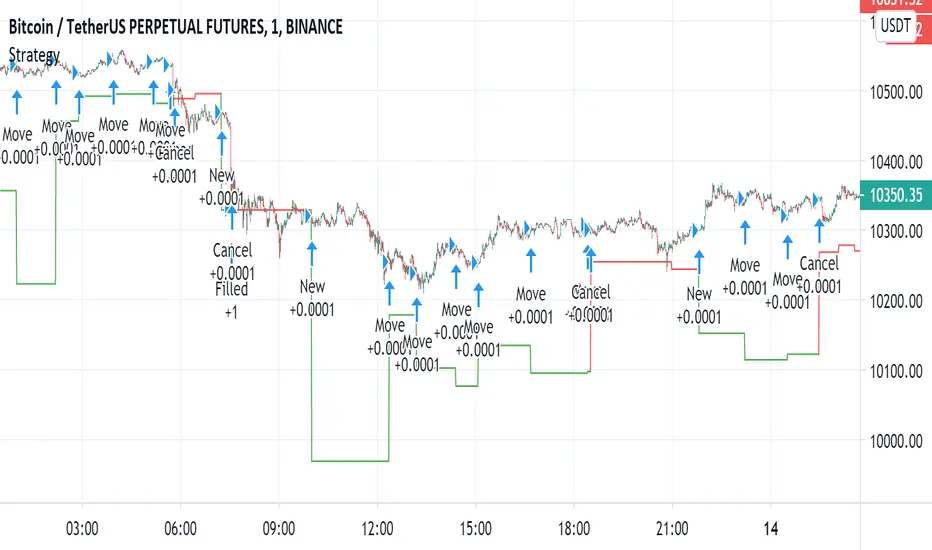
Automated - Fibs with Limit only ordersAutomated - Fibs with Limit only orders
This script was designed to demonstrate how you can use a single alert to move your limit orders around.
It is not meant to be traded live and has been built to work with Binance Futures Testnet.
You will notice a lot of plots with 5 different titles.
New = Place your limit buy at a fixed-price.
Move = Cancel the current limit buy and place it at the new fixed-price.
Filled = Cancel any limit closes and places them anew based on the new average and take profit.
Cancel = Cancels exisiting limit buys.
Cloes All = Limit close filled, no commands necessary.
The default quantity in the command is the minimum order size on Binance.
Settings
Live
- If enabled it will only place trades after the "Stat Timestamp + Start Delay" that you provide.
Start Timestamp
- Use something similar to epochconverter to get the current timestamp.
Start Delay
- Gives you 1 minute by default to start the script and create your alert before it begins looking for a new entry.
Leverage
- Default 1. Affects the "Take Profit and DCA When" Settings.
Take Profit %
- This is the percentage above the current average you'd like to place your position close at.
DCA When %
- The percentage below your last entry that you're willing to buy again.
Note: This strategy has no stop-loss and pyramiding is enabled. It is not built for, or recommended to run live.
I hope this opens some doors and helps advance your personal trading system.
Good luck and happy scripting!
Simple and efficient PSAR swing strategyThis is a strategy build inside tradingview, which I found it works great with swing/position trading.
It works based on parabolic sar indicator, when indicator is below the candle, is an uptrend and when its its above is a downtrend.
At the same time it's very nice, because it has a sort of stop loss which is dynamic, because it triggers when candle crosses with indicator, so you dont have to worry about stop loss or take profit .
The key here of course, is going to be the risk management, if you want to success with it, never trade more than 2% of you capital, and if you want you can always apply a rule inside the code to close all position if x % amount of equity was going down, although I recommend have patience and let the system do its job.
I recommend this strategy to be used with charts like 1 day or 1 week. If you need and want I can convert it to an indicator that uses alerts (although with strategy as well can be made to send alerts).
PS. When you add this strategy on chart, inside is has different versions, if you use first version(1), it uses the system I explain above. If you use the last one, its based on risk management when the stop loss is the difference between psar and the candle, but it still needs some adjustments to make.
Overall first one is atm much more profitable, but I believe that the version with risk management can be much better, but it need much more adjustments to make which I dont have the time at the moment for it.
Enjoy it .

TFs Double Stochastic StrategyThe Strategy script uses Stochastic indicators for entering and exiting a position.
How to use
The strategy works with most timeframes and instruments.
I'm also providing a "study" version of this script, which can be used for automation of the strategy via alerts.
The script is using a default commission of 0.075% which reflects Bitmex' Taker-Fees. This is just a default and can be modified in the strategy settings for each instrument individually.
List of parameters
"Stochastic Length" ... Number of bars for Stochastic indicators
"Stochastic Overbought" ... Stochastic overbought level
"Stochastic Overbought Down Trend" ... Stochastic overbought level for down trends
"Stochastic Oversold Up Trend" ... Stochastic oversold level for up trends
"Stochastic Oversold" ... Stochastic oversold level
"Stochastic Smooth K" ... Stochastic K smoothing
"Stochastic Smooth D" ... Stochastic D smoothing
"MA Filter Enabled" ... Enable an additional filter for entering a position; the entries only follow the overall trend
"Fast Period" ... Fast filter period
"Slow Period" ... Slow filter period
"Backtest ..." ... Backtest timeframe; area outside this timeframe will be grayed out
How to access
This strategy is a "Invite Only" script. Please use the link below or send me a message via Tradingview to obtain access to the strategy and study script.
For enabling the script in your Tradingview chart window, click on "Indicators" and select "Invite-Only Scripts".

T3 ICL MACD STRATEGY
Backtested manually and received approx 60% winrate. Tradingview strategy tester is skewed because this program does not specify when to sell at profit target or at a stop loss.
Uses 1 min for entry and a longer time frame for confirmation (5,10,15, etc..) (Not sure what the yellow arrows are in the picture but they can be ignored)
Ideal Long Entry - The algo uses T3 moving average (T3) and the Ichimoku Conversion Line (ICL) to determine when to enter a long or short position. In this case we are going to showcase what causes the algo to alert long. It first checks to see if the the ICL is greater than T3. Once that condition is met T3 must be green in order to enter long and finally the last closing price has to be greater than the ICL. You can use the MACD to further verify a long trend as well!
Ideal Short Entry - The algo uses T3 moving average (T3) and the Ichimoku Conversion Line (ICL) to determine when to enter a long or short position. In this case we are going to showcase what causes the algo to alert short. It first checks to see if the the ICL is less than T3. Once that condition is met T3 must be red in order to enter short and finally the last closing price has to be less than the ICL. You can use the MACD to further verify a long trend as well!

Combing in MACD and MTFHi all, I'm trying to wedge in the MACD into a multiple timeframe. Scope is to create:
1) an alert when the MACD across all timeframes is positive,
2) an alert when the MACD across all timeframes is negative, and
3) one when neither of them is applicable.
Would anyone be so kind to give it some thoughts, please?
//@version=2
strategy(" Easy MTF Strategy", overlay=false)
TF_1_time = input("3", "Timeframe 1")
TF_2_time = input("5", "Timeframe 2")
TF_3_time = input("15", "Timeframe 3")
TF_4_time = input("30", "Timeframe 4")
fastLen = input(title="Fast Length", type=integer, defval=12)
slowLen = input(title="Slow Length", type=integer, defval=26)
sigLen = input(title="Signal Length", type=integer, defval=9)
= macd(close, fastLen, slowLen, sigLen)
width = 5
upcolor = green
downcolor = red
neutralcolor = blue
linestyle = line
TF_1 = security(tickerid, TF_1_time, open) < security(tickerid, TF_1_time, close) ? true:false
TF_1_color = TF_1 ? upcolor:downcolor
TF_2 = security(tickerid, TF_2_time, open) < security(tickerid, TF_2_time, close) ? true:false
TF_2_color = TF_2 ? upcolor:downcolor
TF_3 = security(tickerid, TF_3_time, open) < security(tickerid, TF_3_time, close) ? true:false
TF_3_color = TF_3 ? upcolor:downcolor
TF_4 = security(tickerid, TF_4_time, open) < security(tickerid, TF_4_time, close) ? true:false
TF_4_color = TF_4 ? upcolor:downcolor
TF_global = TF_1 and TF_2 and TF_3 and TF_4
TF_global_bear = TF_1 == false and TF_2 == false and TF_3 == false and TF_4 == false
TF_global_color = TF_global ? green : TF_global_bear ? red : white
TF_trigger_width = TF_global ? 6 : width
plot(1, style=linestyle, linewidth=width, color=TF_1_color)
plot(5, style=linestyle, linewidth=width, color=TF_2_color)
plot(10, style=linestyle, linewidth=width, color=TF_3_color)
plot(15, style=linestyle, linewidth=width, color=TF_4_color)
plot(25, style=linestyle, linewidth=4, color=TF_global_color)
exitCondition_Long = TF_global_bear
exitCondition_Short = TF_global
longCondition = TF_global
if (longCondition)
strategy.entry("MTF_Long", strategy.long)
shortCondition = TF_global_bear
if (shortCondition)
strategy.entry("MTF_Short", strategy.short)
strategy.close("MTF_Long", when=exitCondition_Long)
strategy.close("MTF_Short", when=exitCondition_Short)

XProfit Strategy BacktesterHello,
This Script is a Backtesting Strategy tester of XProfit and allows users to clearly define a profitable strategy.
To Define a profitable strategy, there is the option to modify the parameters "XR" and "Sensitivity".
The Script in itself is build on ATR which gives Long or Short signal.
Note: The strategy script does not allow alerts. It does only allow backtesting.
How To Get Access: DM me for a Trial or use the links below this post to purchase the Indicator which will automatically come with XProfit
Happy Trading.

PowerBot Binary Backtest FrameworkHello Traders,
This is the backtest framework for testing the Powerbot algorithm before activating alerts which can be used for precise Trading.
Powerbot can be used across any timeframe and across any expiration based on the performance
This backtest comes with some features to help traders make a decision on the following:
When using the indicator itself.
1. We use our proprietary algorithm - "Powerbot binary algorithm script", which is Public but can only be accessed based on request. If you would like to use the algorithm please ensure you have tested different assets and varying expiration for your trades through the backtest - if you don't know how to do that please contact us by sending a message.
EXPLORE YOUR OPTIONS FOR TRADING THROUGH VARIED ITERATION.
2. You can choose any expiration time by changing the expiration time period from the 'settings' button, this will display new results. example; on a 5 minutes chart timeframe, 6 bars would be 30 minutes, which means 5 minutes times 6, which is 30 and minutes because your timeframe is set to minutes. Another example is that on a 1-hour timeframe, 12 bars would be 12 hours, given 1 * 12 is 12hours, because your timeframe is set to hours.
3. You can choose the trading session you want, please note that we have included the three most active sessions - ASIAN, EU/UK, & US Session, by default, the scripts checks for performance on 24/7, which means it does not omit trades outside of the trading session. The Tradingview time is in UTC (or GMT -4). The best times to trade are during sessions most active times.
This backtesting indicator is free to add to the chart if you would like to use the algorithm during your trading session you need to contact us. After which you can use the algorithm for as long as you want.
Please note that no signal can work in all timeframe across all markets that is why backtesting to search for algorithms with at least 50% performance ratio is excellent for trading. All you need is to diversify alerts across to assets or more to rake in profits.
If you require assistance in understanding what session would work best, you can send us a message to work through the process together.
Thank you for you support. This script is free to use to see potential of the indicator itself.
We are NOT allowed to advertise any script on sale based on tradingview house rules.
Wishing you all the best.

FRAMA - Supertrend strategyFRAMA Strategy
I found this strategy on internet, in a well-known forex forum.
I have translated the two indicators mentioned in that strategy (originally in mq4) in pine script.
Thanks to Fractured and Shizaru for the FRAMA snippets, to mejialucas for Supertrend snippet, to JayRogers for trade management snippet and to Trost for backtesting snippet.
I also added some code to have FRAME with a deiiferent timeframe
Indicators set-up:
FRAMA period 24 (it was originally 25 but it's better to use an even number)
FRAMA timefarme lower then chart timeframe (e.g. daily chart and weekly FRAMA)
Supertrend indicator as it is.
Of course, it is better to adapt above setting to traded instrument.
Long/Buy rules:
1 - Enter at crossover between FRAMA and its signal
2 - Option to filter entries based on supertrend signal
3 - Exit when Supertrend change direction;
4 - Exit long when short signal occurs;
Short/Sell rules:
1 - Enter at crossunder between FRAMA and its signal
2 - Option to filter entries based on supertrend signal
3 - Exit when Supertrend change direction;
4 - Exit short when long signal occurs;
VERY IMPORTANT NOTE: this is a trend following strategy, so the target is to stay in the trade as much as possible (drawdown my be high). If your trading style is more focused on scalping and/or pullbaks, this strategy is not for you.
Credits to who developed this startegy (google it).
Thanks to all pinescripters mentined in the code for their snippets.
I have also a study with alerts.
Please use comment section for any feedback or contact me if you need support.

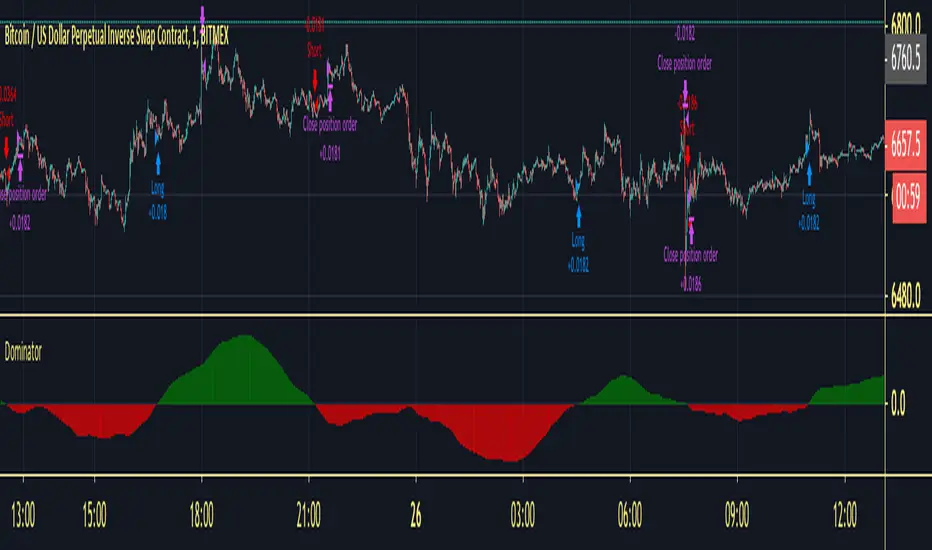
Dominator StrategyThis is the Strategy Version Of Dominator you can choose your take profit level and dates for backtesting calculates fee as well
Do investors appreciate a good animal mascot? It seems like it. Bull and bear markets are key investing lingo and symbols, capturing positive feelings (bull) or negative ones (bear). There’s no official rule, but a bull market tends to refer to a 20% increase in a market over time from its bottom, while a bear represents a 20% decrease from its top. In general, “bull” positivity or “bear” negativity can refer to upward or downward movements of almost anything, like individual stocks. And you’ll even notice investors saying they’re “bullish” on an industry with growth potential or “bearish” on a stock they think will drop .
Dominator will give you the calculation of the wave between Bull&bear
How to use :
Long Alert signal = Bull Wave on the market
Short Alert signal = Bear wave on the market
Apply these fundamentals to any time frame and you will be able to read the correction into the trend or even the trend reversals.
inwCoin Sto RSI Bullish/Bearish Divergence + Scalping StrategyStochastic RSI is well-known oscillator indicator for finding potential bottom/top within each timeframe.
Inspired by some dude from twitter that showing how his bot is working. So I tried to write this strategy to work with small timeframe.
After trial and error, I found out that if we take profit by using previous high of lookback period, we still able to make some profit with small TF.
How it work?
---------------
1) This strategy will find the STO RSI bullish or bearish divergence in 15 min timeframe, if found one, it will enter the trade long or short.
2) If price sideway and the candle since last entry is more than "Cooldown period", it will start looking for STO RSI bull/bear divergence again.
3) It will keep pyramid your entry to "max pyramid" option
4) If price close above or below previous high/low from "TP lookback period" option, it will take profit or take loss of that position.
Cautions
-----------
1) The result is good because in the pass 2 months, we enter bull trend for BTC and other crypto.. So chance that we able to close position with profit is alot higher than loss.
2) But if trend change. This scalping strategy is dangerous to use, because you will take loss down and your loss will build up every single day. ( Make sure to filter trend first )
3) I tried with bear trend with short trade, and it seem profitable. ( But you'll bankrupt if you run long scalp in downtrend, and vise versa )
Alert?
------
I also have alert version of this strategy, if you want to use, please let me know.

Volatility Traders Minds Strategy (VTM Strategy)Volatility Traders Minds Strategy (VTM Strategy)
I found this startegy on internet, with a video explaingin how it works.
Conditions for entry:
1 - Candles must to be above or bellow the 48 MA (Yellow line)
2 - Candles must to break the middle of bollinger bands
3 - Macd must to be above or bellow zero level;
4 - ADX must to be above 25 level
Credits to who developed this startegy (google it).
Thanks to all pinescripters mentined in the code for their snippets.
It could be improved with stop loss based on ATR etc.
I have also a study with alerts.
Please use comment section for any feedback or contact me if you need support.

Scalping with Bill Williams AlligatorScalping strategy based on Bill Williams Alligator technique but calculated with heikin ashi candles.
This strategy has to be applied to standard candles and low time frames (1min to 5min)
Thanks to all pinescripters mentined in the code for their snippets.
It could be improved with stop loss based on ATR etc.
I have also a study with alerts.
Please use comment section for any feedback or contact me if you need support.

Bollinger Bands BAT/USDT 30minThis is ready to use Bollinger Band strategy that was backtested on the data from the previous year 2019.
The main purpose of this strategy is to determine trades with the highest probability of success, to keep a consistent portfolio growth throughout the year. This strategy cherry-picks the most reliable points of entry on a particular timeframe (30m) for the particular asset (BAT/USDT). The backtest shows a great result of 78.95% profitability with the maximum drawdown of -4.02%. This is one of my strategies out of the group of automated strategies that helps to grow my portfolio steadily.
You are welcome to change inputs and backtest the following strategy. Any comments or ideas would be appreciated.
If you are happy with existing results and would like to automate the strategy, which can be done through alerts, then you need to convert it to study and add alerts in the code.
Let me know if you are interested in that and I will create a study based on this strategy.

Dominon StrategyFor Dominion Signals, an early strategy, everyone chooses their own TF for themselves, we recommend using from 5m, 1H shows itself well. Have a nice use. For trading with leverage, we recommend indicating the size of the order with leverage. For each tool, you need to select your own characteristics. This strategy will help you determine the best settings for our indicator, where you can set alerts.

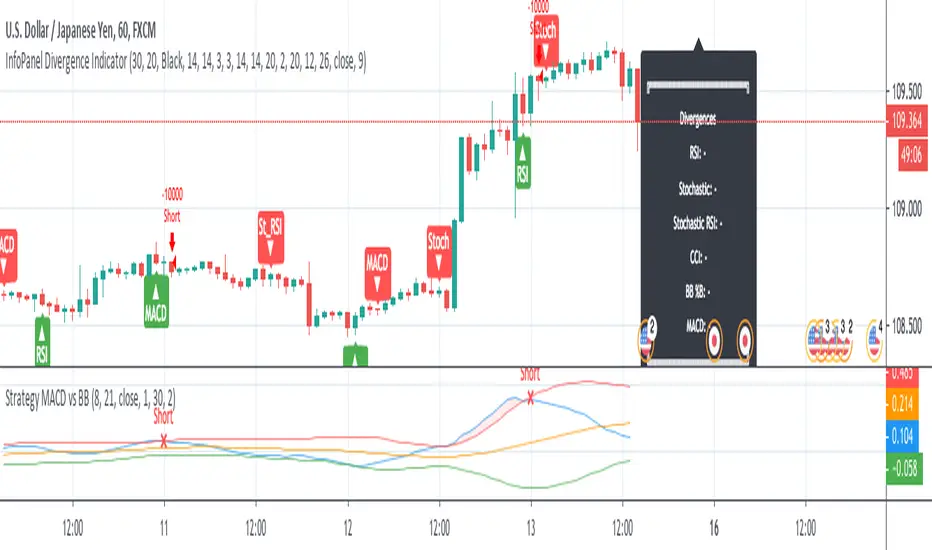
Strategy MACD vs BBStrategy based on MACD and Bollinger Bands, where BBs are calculatend from macd signal.
Strategy doesn't open at breakout of bands but it waits for a pullback.
Upper and lower bands are used as resistance and support.
There are various parameters that can be optimized.
I have also a study with alerts.
Please use comment section for any feedback or cointact me if you need support.