Profit-sync with Trexen StratThere are various scripts and indicators on Tradingview, but not many of them combine theories to improve the profitability of an indicator using settings from multiple time frames.
This script takes the Average True Range trailing exit idea to enter trades. Many other ideas have been tested to filter entry signals which may be weak or not profitable such as a second ATR with Higher TF, MFI/VFI, RSI , Momentum wavetrend, Weis Wave, MACD , Stochastic etc, but I felt the following works best:
- Over the ATR entries there is a directional filter very similar to Renko candles which can be set to a higher time frame, I use 4 hour with 15 min candles for example, this will only allow 15 min buy signals to execute if the 4 hour is also on the buy side.
- There is also a Trend directional filter which can be set to a higher/lower time frame, currently I am using this on allow setting to allow more trades
The higher both filter are, the more accurate the trades will be, but less frequent. The filters convert entry signals into exit signal which can be used as take profit point with alerts if there is a position open.
The overall theory is to follow trend and to exit with profit. I have tested different take profit alerts but think it’s better to either catch a whole price move or sell with a set trailing limit order at like 0.4/0.5%.
As I am trading BTC with a bot and not with TA I think it is good to get in on a trend reversal, follow the trend up and get out quick with profit. There is a lot of manipulation with crypto so things like Momentum indicators and money-flow may not represent what is actually happening in the market.
ابحث في النصوص البرمجية عن "alert"

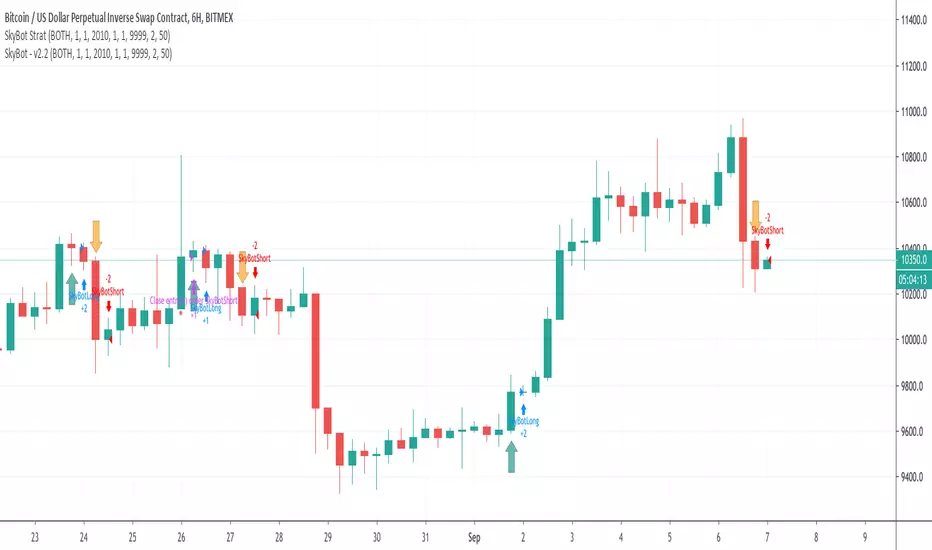
SkyBot Strategy - BTC and XBTUSD Trading Bot for CryptoThe SkyBot is written to provide a good balance between long-term trading and short-term for more action. It has been running for over a year before it was decided to share with the public.
SkyBot uses moving price action data from multiple time frames to determine when to go long or short. It also provides the user with the ability to use stop loss and take profit values to match whatever risk management rules you use in your trading.
SkyBot has simple to use alerts making it simple to use with many auto-trading offers.
SkyBot has been coded in the latest version of Pine (v4) and will be updated as new features, functionality, and support is released with Pine.
To get access to SkyBot, please signup here: cryptoscriptking.com
This is the indicator script that is intended to be used to get alerts for the purposes of automation. The strategy script is also included allowing you to do your own backtesting.
PD Crypto Performer PRO (Backtest)Description:
This is the backtesting version of the PD Crypto Performer Pro (Alert) . You can choose to backtest either one of the two strategies included, a trend-identifying swing strategy and a low risk scalping strategy. Both strategies assume the same capital amount invested ($10,000) each trade. You can also see how your capital grows over time by enabling the reinvesting proceeds option. For details, please check out this tutorial .
The backtesting results could be easily improved in live trading by utilizing the “Take Profit” signals and following the recommended methods of use below.
To assist the decision-making process, the code currently references BTCUSD. As a result, it is only suitable for crypto traders. However, we are working on the stock and forex versions, and the Performer will have these compatibilities soon.
Most importantly, our signals DO NOT REPAINT !
Recommended Use:
- Time Frame: 1HR
- Asset: Large cap crypto assets.
For lower risk tolerance, we recommend using the indicator on ETHUSD. For maximizing profits, we recommend using the indicator on BCHUSD.
- Always set stop loss according to your own risk tolerance
- Take profits along the way. Check out this video tutorial for when to reenter after our take profit signals.
Recommended Use for Advanced Traders:
- Position sizing:
Larger position if the 1HR signal is in the same direction compared to the 4HR trend.
Smaller position if the 1HR signal is in the opposite direction compared to the 4HR trend.
- Better entry/exit points:
Track the 1HR signal for the asset you are trading on other exchanges along with the BTCUSD 1HR signal. Sometimes, the signals from different exchanges occur with a 1-2 hour difference. You could use these earlier signals along with a lower time frame (eg. 15min) entry confirmation from your own exchange for better entry / exit points.
- Use “Take Profit” signals for counter trend scalps. Recover at the reentering opportunities . This works best with candlestick pattern confirmations.
Never use this if you suspect a flag / inverted flag pattern is forming.
Go to www.phi-deltalytics.com and sign up for a FREE trial today!
Let us know if you have any questions or recommendations. We are here for your success!
Disclaimer:
It should not be assumed that the methods, techniques, or indicators presented will be profitable or that they will not result in losses. Past results are not necessarily indicative of future results. This is not a solicitation of any order to buy or sell.

PD Crypto Performer (Backtest)Description:
This is the backtesting version of the PD Crypto Performer (Alert) . The strategy assumes the same capital amount invested ($10,000) each trade. You can also see how your capital grows over time by enabling the reinvesting proceeds option. For details, please check out this tutorial . The backtesting results could be easily improved in live trading by following the recommended methods of use below.
To assist the decision-making process, the code currently references BTCUSD. As a result, it is only suitable for crypto traders. However, we are working on the stock and forex versions, and the Performer will have these compatibilities soon.
Most importantly, our signals DO NOT REPAINT !
Recommended Use:
- Time Frame: 1HR
- Asset: Large cap crypto assets.
For lower risk tolerance, we recommend using the indicator on ETHUSD. For maximizing profits, we recommend using the indicator on BCHUSD.
- Always set stop loss according to your own risk tolerance
- Take profits along the way.
Recommended Use for Advanced Traders:
- Position sizing:
Larger position if the 1HR signal is in the same direction compared to the 4HR trend.
Smaller position if the 1HR signal is in the opposite direction compared to the 4HR trend.
- Better entry/exit points:
Track the 1HR signal for the asset you are trading on other exchanges along with the BTCUSD 1HR signal. Sometimes, the signals from different exchanges occur with a 1-2 hour difference. You could use these earlier signals along with a lower time frame (eg. 15min) entry confirmation from your own exchange for better entry / exit points.
Go to www.phi-deltalytics.com and sign up for a FREE trial today!
Let us know if you have any questions or recommendations. We are here for your success!
Disclaimer:
It should not be assumed that the methods, techniques, or indicators presented will be profitable or that they will not result in losses. Past results are not necessarily indicative of future results. This is not a solicitation of any order to buy or sell.

MoneyBible QTUMUSDT BacktesterMoneybible BINANCE:QTUMUSDT backtester on 15m candlestick . It will be re-optimized monthly.
The script is written in PineScript V.3, makes no use of the security() function and does not use the Trailing Stop-Loss function from TradingView. No repainting issue.
DM me for joining discord and getting a trial.
Alert script here :

MoneyBible ETHUSD BacktesterMoneybible BITMEX:ETHUSD backtester on 15m candlestick . It will be re-optimized monthly.
The script is written in PineScript V.3, makes no use of the security() function and does not use the Trailing Stop-Loss function from TradingView. No repainting issue.
Alert script here :

MoneyBible XBTUSD BacktesterMoneybible BITMEX:XBTUSD backtester on 10m candlestick . It will be re-optimized monthly.
The script is written in PineScript V.3, makes no use of the security() function and does not use the Trailing Stop-Loss function from TradingView. No repainting issue.
Alert script here :

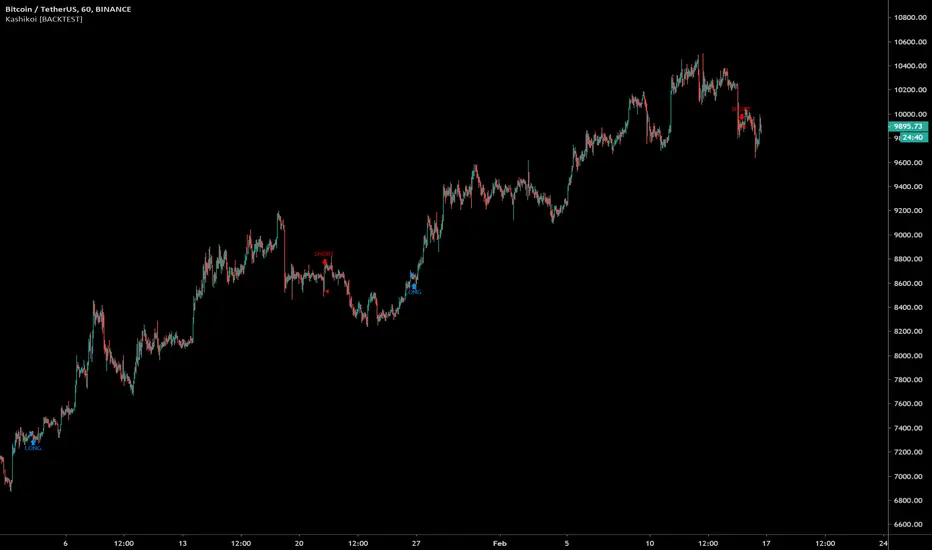
Kashikoi [BACKTEST]🔰 Kashikoi Anaraiza BACKTEST
📌This indicator is a tool to backtest the Kashikoi Anaraiza indicator which has the alerts. To see which custom strategies, indicators, settings, TP/SL performed in backtest.
📌Can test any combination of indicators and settings
🔹Trend Analyzer - Trend Reversals
🔹RyuKumo - BULL / BEAR
🔹EMAs / MAs
🔹Ichimoku - Breakouts / TK Crosses
🔹Breakouts S/R
🔹Pullbacks
🔹MACD
🔹RSI
🔹Stoch RSI
🔹Custom TP/SL %
🔹Trailing Stoploss
🔹Will add more features in future updates and as requested
📌Note: This is a tool to test various settings, to find optimal timeframes, TP/SL %, strategy parameters and testing. Which can save time from tediously manually testing. Past performance is not indicative of future results.
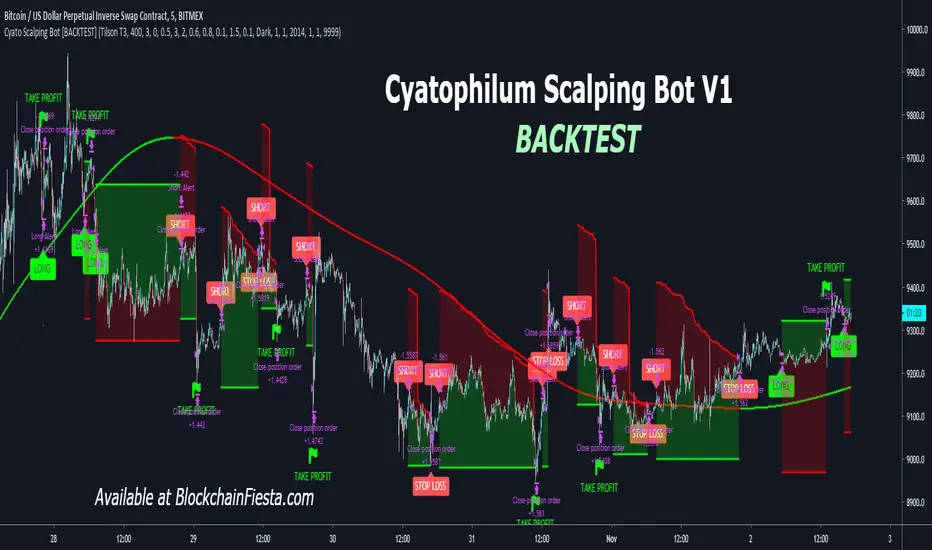
Cyatophilum Scalping Bot [BACKTEST]This indicator triggers Short or/and Long entries and exits.
Example with a Long trade:
The integrated stop loss will trigger an alert to exit the trade.
It is possible that a trend reverses during a trade.
In this case, the "LONG EXIT" alert will trigger at the same
time as the "SHORT ENTRY".
The Trend Detector feature, using EMA or Tilson T3 will filter trades that are against the main trend and thus increase profitability.
BONUS FEATURE
Trailing Take Profit with configurable % deviation.
SAMPLE USE CASES
ETH/BTC
ETH/USD
FOREX: GBP/USD
FOREX: XAU/USD
BTC/USDT
LTC/BTC
XRP/BTC
Read More
> Get access to the Cyatophilum Indicators <
[Long/Short] Range Filter-ADX-SAR [BACKTEST]Backtest of the same previous script with alerts.
Range Filter + ADX + SAR + Trailing Stop + Take Profit

Investing - Weekly EMA's mapped to Daily ChartWhen there isn't enough time in your day to day-trade, yet you want to utilise all the technical analysis skills you have... why not make a long term investing or swing trading indicator set to help you along the way!
So I did....
When it comes to long term investing and swing trading, I often find the weekly 12/26/52 EMA's do a great job in capturing the main market swings from bull to bear.
However, I like to use the Daily chart to see the candle patterns and shapes with more detail and divergences often show up better on the daily chart.
So I have decided to combine the two!
I have basically taken the EMA 12/26/52 from the weekly and transferred them over to the daily (mathematically they are not exact, but for me they are close enough).
I have also developed a simple scale in / scale out strategy for using these exponential moving averages. It isn't as simple as buying in on each signal, however I use my own special strategy to take advantage of the alerts.
Enjoy!


SampleInvitePublish - V1
This strategy is designed for trading stocks and crypto currencies on the long side.
It uses three different timeframes to determine the most profitable entry prices (Day, 4 hour and chart interval).
The strategy employs ten different setups to accommodate both range trading and trend following markets.
The system contains sophisticated algorithms that scale to varies chart intervals.
Tailored to perform best between 4 hours to as low as 10 minutes.
The entire system consists of three tools: HullbusterScope, HullbusterBacktest and HullbusterSignal.
Hullbuster scope is used to obtain configuration information about the market instrument which will be applied to the HullbusterBacktest.
Commit an iterative approach to the backtest tool until the simulated results match your entry and exit expectations .
Apply the HullbusterSignal to the chart and use the same backtest configuration to setup actual trading alerts.

THE PHOENIX v0.1 wSMDAS requested - Version of my Phoenix Script with both LONG and SHORTS, Backtest results will not be accurate unless you use margin trading.
------------------------------------------------------------------------------------------------------------------------------------------------------------------------------------
Implementation in TradingView of modified version of the "Weis Wave".
indicatior will generate Long and Close Long signals according to market trend.
(Learned the hard way that using short instead of close long to close long orders will seriously mess backtest results and create unrealistic expectations)
Added a customizable RATE OF CHANGE indicator that I called SMD (sideways market detection) to try and avoid trading on sideways market.
References: "Trades About To Happen" David H. Weis, Division 2 of the Richard D. Wyckoff Method of Trading in Stocks.
I've had best results on 2h and 4h charts, I would not recommend to go below 1h, my general rule is to run the backtest on regular candle and make sure the backtest gives goodd result, but I use the script with autoview on heikin ashi.
Backtesting: You can change the dates of the backtest as you please, the backtest runs with 1000USD and 100% of equity orders, 3 ticks slippage and 0.1% commission.
For Autoview users: Will upload LONG ALERT and CLOSE LONG ALERT studies separately as I find it easier to see whats going on on 2 seperate indicators.
NO, IT DOES NOT REPAINT.

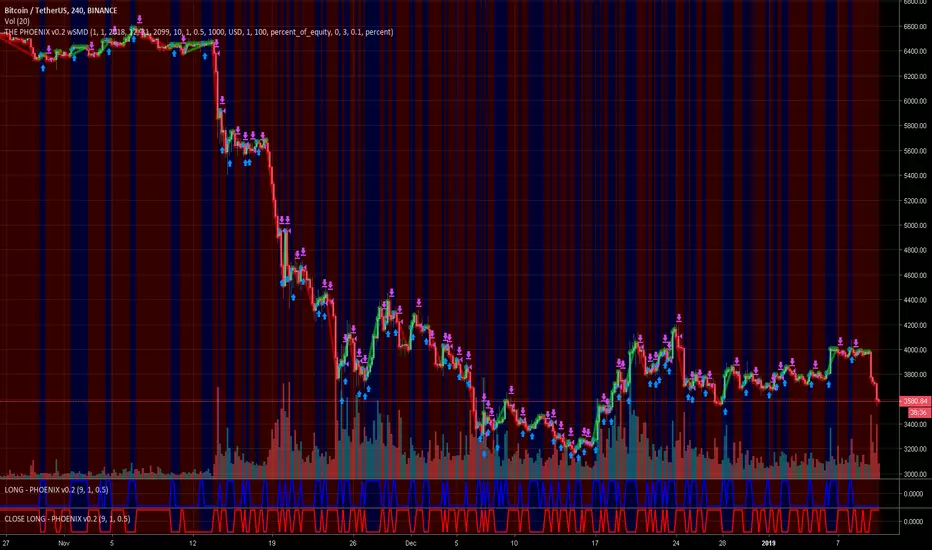
THE PHOENIX v0.2 wSMDThis is my first publication, since sept 2018 i tested/converted to strategy over 500 scripts, this is by far my most profitable script.
Implementation in TradingView of modified version of the "Weis Wave".
indicatior will generate Long and Close Long signals according to market trend.
(Learned the hard way that using short instead of close long to close long orders will seriously mess backtest results and create unrealistic expectations)
Added a customizable RATE OF CHANGE indicator that I called SMD (sideways market detection) to try and avoid trading on sideways market.
References: "Trades About To Happen" David H. Weis, Division 2 of the Richard D. Wyckoff Method of Trading in Stocks.
I've had best results on 2h and 4h charts, I would not recommend to go below 1h, my general rule is to run the backtest on regular candle and make sure the backtest gives goodd result, but I use the script with autoview on heikin ashi.
Backtesting: You can change the dates of the backtest as you please, the backtest runs with 1000USD and 100% of equity orders, 3 ticks slippage and 0.1% commission.
For Autoview users: Will upload LONG ALERT and CLOSE LONG ALERT studies separately as I find it easier to see whats going on on 2 seperate indicators.
NO, IT DOES NOT REPAINT.
-- Ultimate Crypto Trading Strategy -- Backtesting version** This is the backtesting (strategy) version of the ~ Ultimate Crypto Trading Strategy ~ script in TradingView. **
~ Ultimate Crypto Trading Strategy ~
֎ Trading system script on @tradingview that brings the easiest approach to trading with a high profitability rate
֎ Optimized for crypto markets, to catch trend movements as soon as possible and maximize profitability
֎ Sell & Buy alerts, Safeguard mode, Take Profits alerts, auto resistance-support and always adding new features!
֎ Customizable settings.
֎ Users Discord community for learning, sharing and direct support
֎ Ultimate Crypto Trading Strategy Tutorial Video: www.youtube.com www.youtube.com
֎ Safeguard feature (match multiple timeframes signals) explained: youtu.be youtu.be
If you’d like to test the trading script in TradingView, I can give you access to a 10 days trial.
Please send me a message in tradingview and I’ll activate it right away.
Thank you!

Up Down Strategy with MA Controla simple up down candle strategy with a built in MA control
alerts script:

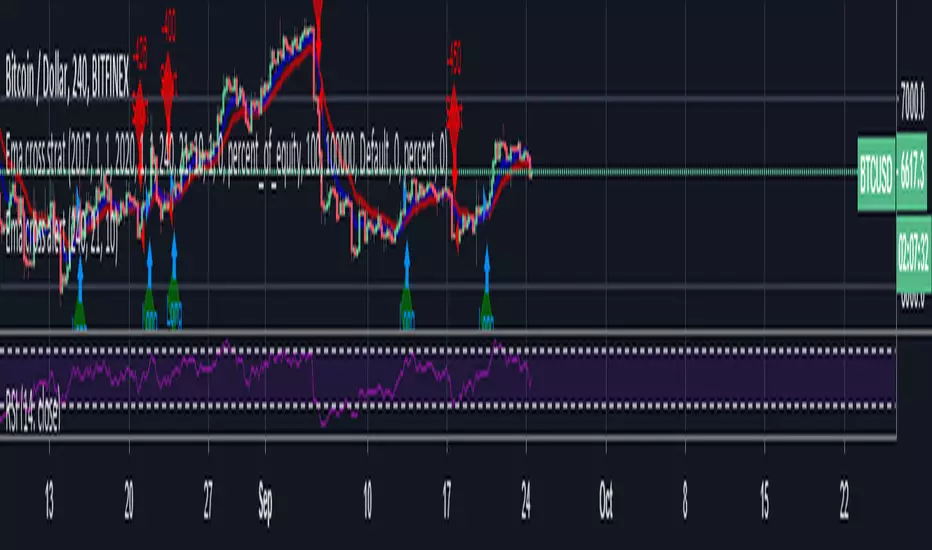
Ema cross strat / Turtle Trading This is just a simple EMA cross strategy which is meant to be similar to Turtle Trading Strategy.
It uses in default 4 Hour 21 / 10 EMA to long or short. This is not perfect but in the long run it will profit. Works best in bull market.
LINK TO ALERT :
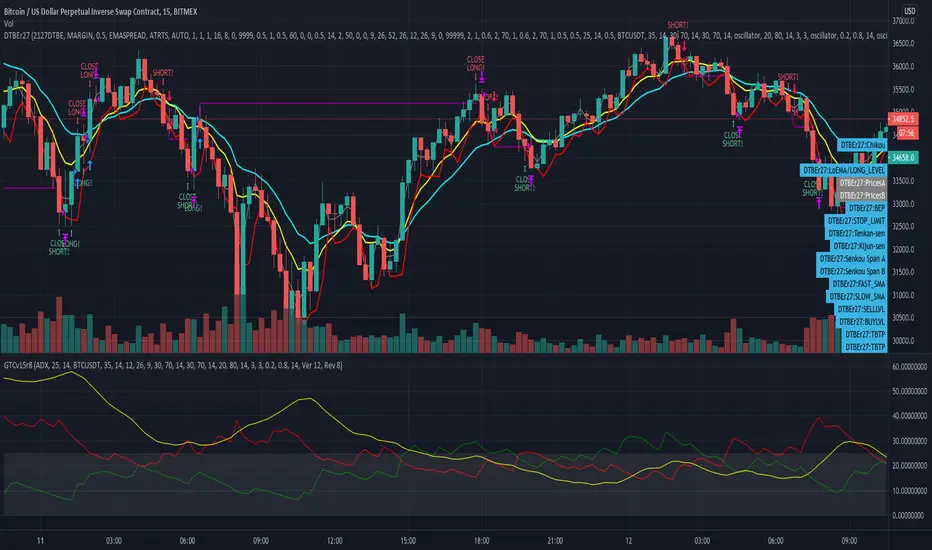
Gunbot Deluxe Tuners BERevision 18
Gunbot Deluxe Tuners BE (Black Edition) is the official Gunthy version of Gunbot Deluxe Tuners.
It is an all in one script simulation of Gunbot with the ability to optimize Gunbot settings through backtesting any combination of the script's included buy / sell strategies along with extra conditions and trailing options.
The companion script allows user to automatically send alerts directly to Gunbot through the Gunbot TradingView add-on.
Available only to verified Gunbot owners. No exceptions. Anyone interested in obtaining this script must contact either their official Gunbot reseller or me privately.
No public requests or donations for access to this script will be granted. No exceptions.
NOTICE: By requesting access to this script you acknowledge that you have read and understood that this is for research purposes only and neither I or Gunthy are responsible for any financial losses you may incur by using this script!
Scalping with Heikin Ashi candle pattern for BTCUSDThis strategy is based on a trading idea that works for me on crypto markets. I use this trading strategy manually from a couple of weeks.
It is based on 1 minute timeframe and heikin ashi candles.
Basically, the strategy places two pending orders in a certain moment of the market and scalp as many pips as possible. Then suddenly it exits before price correction.
The scope of this script is to back test the strategy on a larger period but due to trading view limitation it has to be done modifing the backtesting period manually.
If some of you want to test, please write in comment section.
Please use comment section for any feedback.
Next improvment (only to whom is interested to this script and follows me): study with alerts. Leave a comment if you want to have access to study.

Series of Heikin ashi candle strategySeries of Heikin ashi candle strategy, idea and rules:
After 2 consecutive heikin ashi candles of same color, place a buy stop order at high of last candle if green or a sell stop order at low of last candle if red.
Strategy follows the open order with trailing stop.
Use on charts with heikin ashi candles.
Good on lower timeframes and scalping.
Please use comment section for any feedback.
Next improvment (only to who is interested to this script and follows me): study with alerts. Leave a comment if you want to have access to study.
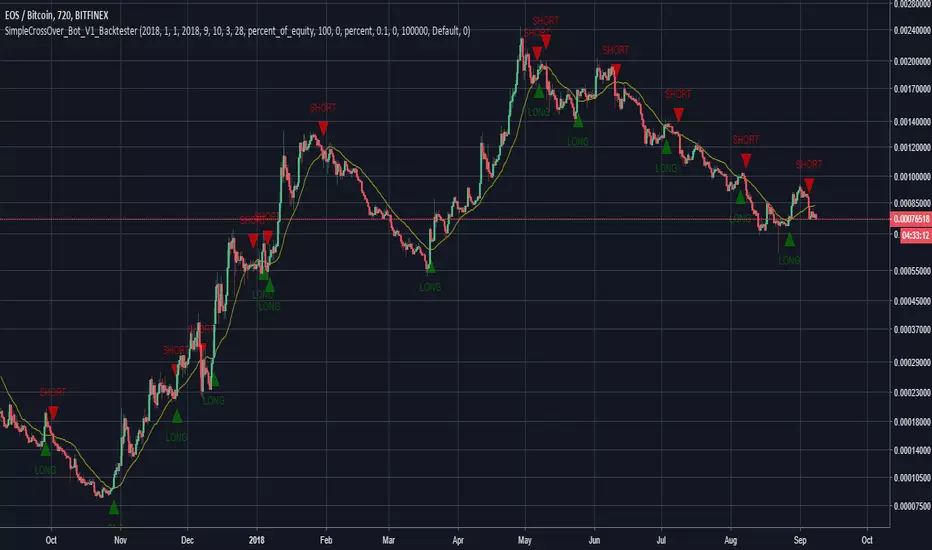
SimpleCrossOver_BotThis is a simple example of how you can compile your own strategy
This script contains the code for alerts and for backtesting.
In order to use the backtester, comment out the sections to be used for signals, and comment in the sections to be used on the back tester, and visa versa for using the script for alerts in order to automate your own bot.
Cyatophilum Trend Indicator [BACKTEST][STRATEGY]HOW IT WORKS
Based on my Cyatophilum Trend Indicator, this Strategy performs simple Buy and Sell orders when an alert from the Indicator triggers. The goal is to find the best Time Frame and Trend Parameter in order to make the most profit. The indicator turns the candles green for a Long trade/Buy and red for a Short trade/Sell.
ABOUT THE STRATEGY
The Net Profit (Gross profit - Gross loss) is calculated with a commission of 0.05% on each order.
Each trade is made with 1 BTC : The backtest buys 1 BTC and sells 1 BTC.
It clearly outperforms the Buy & Hold line, meaning it is more profitable to use this strategy than to just hold Bitcoin.
If you decided to Short or Long, profits can be higher, but trade at your own risk.
To use this strategy on a BTC market (for trading altcoins), change the default Order Size from 1 Contract to 100% of Equity.
MY PERSONNAL ADVICE
This is a Trend Indicator, meaning the least profitable trades are made during flat markets. Keep an eye on News and Volume to indentify a possible breakout and avoid trades during those flat periods. Do not trade during a Triangle since the commissions will rekt you.
Get This Indicator Today!
Purchase at blockchainfiesta.com
NOTE
If you purchase the Indicator you will get both the Alert Setup and the Backtest Strategy.
Find, discuss and request more backtesting on my discord!
discord.gg
