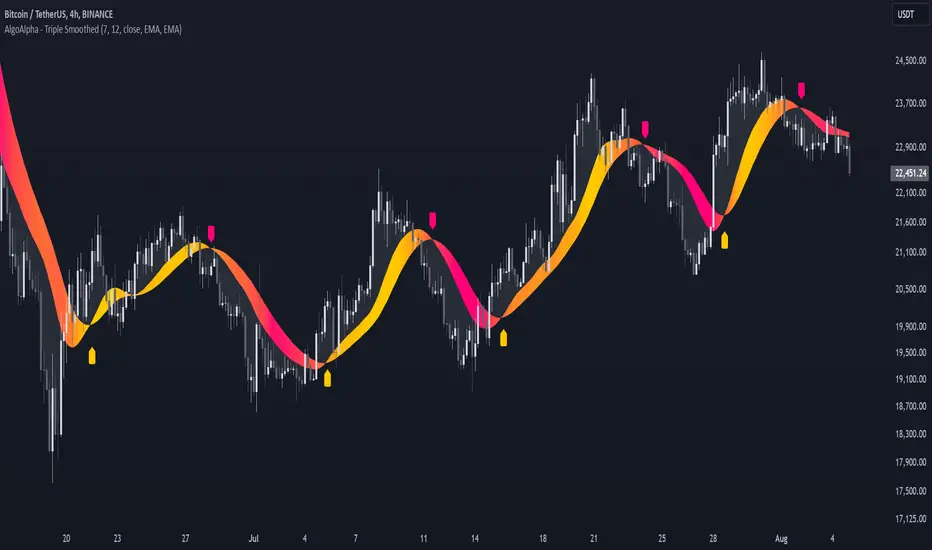
Triple Smoothed Signals [AlgoAlpha]Introducing the Triple Smoothed Signals indicator by AlgoAlpha, a powerful tool designed to help traders identify trend direction and market momentum with greater accuracy. By applying triple smoothing techniques to your chosen data source, this indicator filters out market noise, allowing you to focus on significant price movements. Perfect for traders looking to enhance their technical analysis and gain an edge in the markets.
Key Features
🎨 Customizable Moving Averages : Choose between EMA, SMA, RMA, or WMA for both the triple smoothing and the signal line to tailor the indicator to your trading style.
🛠 Adjustable Smoothing Lengths : Configure the main smoothing length and signal length to fit different timeframes and market conditions.
🌈 Dynamic Color Fills : Visual gradients and fills highlight trend strength and direction, making chart analysis more intuitive.
🔔 Alerts : Set alerts for bullish and bearish crossover signals to stay ahead of market moves without constant chart monitoring.
📈 Clear Signal Visualization : Bullish and bearish signals are plotted directly on your chart for easy interpretation and timely decision-making.
Quick Guide to Using the Triple Smoothed Signals Indicator
🛠 Add the Indicator : Add the indicator to your TradingView chart by clicking on the star icon to add it to your favorites. Customize the settings such as the main smoothing length, signal length, data source, and moving average types to match your trading strategy.
📊 Market Analysis : Monitor the crossovers between the triple smoothed moving average and the signal line. A bullish signal is generated when the signal line crosses under the triple smoothed MA, indicating a potential upward trend. Conversely, a bearish signal occurs when the signal line crosses over the triple smoothed MA, suggesting a possible downward trend.
🔔 Alerts : Enable notifications for reversal signals and trend shifts to stay informed about market movements without constantly monitoring the chart.
How It Works
The Triple Smoothed Signals indicator enhances trend detection by applying a triple smoothing process to your selected data source using the moving average type of your choice (EMA, SMA, RMA, or WMA). This triple smoothed moving average (v1) effectively reduces short-term fluctuations and noise, revealing the underlying market trend. A signal line (v2) is then calculated by smoothing the triple smoothed MA with a separate moving average, further refining the signal. The indicator calculates the normalized distance between the triple smoothed MA and the signal line over a specified period, which is used to create dynamic color gradients and fills on the chart. These visual elements provide immediate insight into trend strength and direction. Bullish and bearish signals are generated based on the crossovers between the signal line and the triple smoothed MA, and are plotted directly on the chart along with customizable alerts to assist traders in making timely decisions.
ابحث في النصوص البرمجية عن "algo"
Double Top/Bottom [AlgoAlpha]Introducing the Double Top/Bottom Indicator by AlgoAlpha, a powerful tool designed to identify key reversal patterns in the market with precision. This indicator meticulously detects double tops and double bottoms, helping traders recognize potential trend reversals and make informed trading decisions.
Key Features:
🔍 Pattern Detection : Accurately identifies double top and double bottom formations based on customizable time horizons.
🎨 Customizable Appearance : Choose your preferred colors for bullish and bearish trends to match your trading style.
📊 Signal Labels : Option to display only the second pivot of the double top/bottom for a cleaner chart view.
🔧 Flexible Settings : Adjust the time horizon to control the look-back period, allowing for detection of both short-term and long-term patterns.
📈 Visual Enhancements : Draws trend lines and fills between pivotal points to visually highlight potential reversal zones.
🔔 Alerts : Set up alerts for potential double top and double bottom formations to stay informed of key market movements.
How to Use the Double Top/Bottom Indicator :
🛠 Add the Indicator : Simply add the Double Top/Bottom Indicator to your TradingView chart from your favorites. Customize the time horizon and appearance settings to fit your trading preferences.
📊 Analyze Patterns : Watch for the identified double top and double bottom patterns along with the corresponding trend lines and filled areas to anticipate potential market reversals.
🔔 Set Alerts : Enable alerts to receive notifications when double top or double bottom patterns are detected, ensuring you never miss a critical trading opportunity.
How It Works : The indicator scans the price action for pivot highs and lows within a specified time horizon, identifying potential double top and double bottom patterns. It maintains a sequence of these pivots and verifies the formation of these patterns based on the relationship between consecutive pivots and the proximity to a defined limit. When a double top or double bottom is confirmed, the indicator marks the second pivot point with a label and draws trend lines to visualize the reversal pattern. Additionally, it provides alert conditions to notify traders of potential confirmations, enhancing decision-making without cluttering the chart.
⚠️ Important Reminder : The labels indicating double tops and bottoms appear with a delay and are intended to mark the formations after they have already formed. They are not meant to be used as real-time trading signals. While they align perfectly with pivot points in hindsight, please use them as markers for analysis rather than immediate trading triggers.

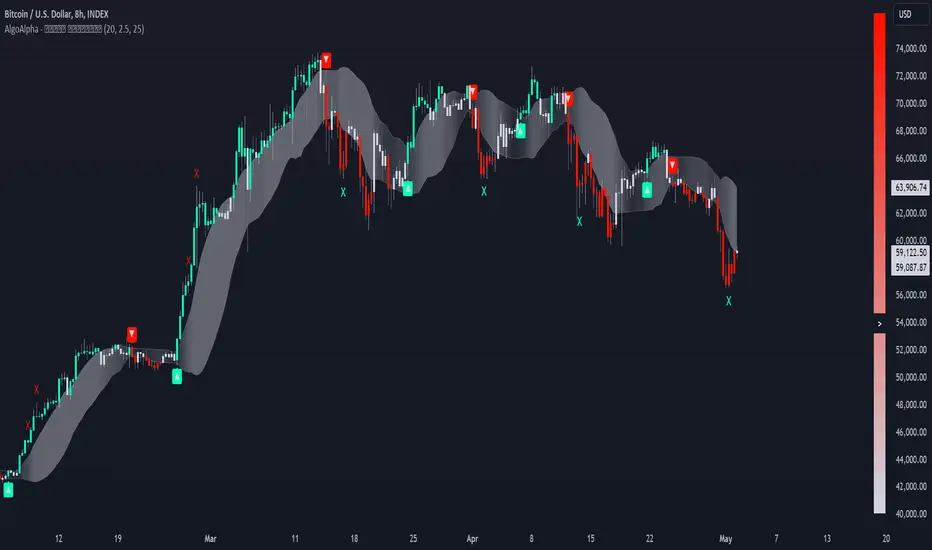
Reversal Signals [AlgoAlpha]📈🔄 Reversal Signals – Master Market Reversals with Precision! 🚀✨
Elevate your trading strategy with the Reversal Signals indicator by AlgoAlpha. This advanced tool is designed to pinpoint potential bullish and bearish reversals by analyzing price action and, optionally, volume confirmations. It seamlessly combines reversal detection with trend analysis, giving you a comprehensive view of market dynamics to make informed trading decisions.
Key Features
🔎 Price Action Reversal Detection : Identifies potential reversal points by comparing current price movements against historical candle patterns within a customizable lookback period.
📊 Volume Confirmation : Optionally integrates volume analysis to confirm the strength of reversal signals, enhancing their reliability.
📈 Stepped Moving Average Trend Indicator : Employs a stepped moving average that adjusts at set intervals to reflect underlying market trends.
⚙️ Customizable Settings : Tailor the indicator to your trading style with adjustable parameters for lookback periods, confirmation windows, moving average types, and more.
🎨 Visual Signals and Trend Coloring : Clear on-chart labels for reversal signals and color-coded trend areas to quickly identify bullish and bearish conditions.
🔔 Alerts for Key Market Events : Set up custom alerts for reversal signals and trend shifts to stay ahead of market movements.
Quick Guide to Using the Reversal Signals Indicator :
🛠 Add the Indicator : Add the indicator to your favorites by pressing the star icon. Customize settings like Candle Lookback, Confirm Within, and Use Volume Confirmation to fit your trading style.
📊 Market Analysis : Observe the "𝓡" labels on the chart indicating bullish and bearish reversal signals. Look for labels below the bars for bullish signals and above the bars for bearish signals. Use the color-filled areas between the stepped moving average and the center line to assess market trends.
🔔 Alerts : Enable notifications for reversal signals and trend shifts to stay informed about market movements without constantly monitoring the chart.
How It Works
The Reversal Signals indicator operates by conducting a thorough analysis of price action over a user-defined lookback period. For a bullish reversal, the indicator checks if the current closing price is lower than the lows of the preceding candles within the lookback window, suggesting a potential oversold condition. If this criterion is met, it marks the candle as a potential reversal point and waits for confirmation within a specified number of subsequent candles. Confirmation occurs when the price rises above the high of the identified candle, signaling a bullish reversal. An optional volume confirmation can be enabled to ensure that the reversal is supported by higher-than-average trading volume, adding an extra layer of validation to the signal. The process is mirrored for bearish reversals, where the indicator looks for the closing price exceeding previous highs and awaits confirmation of a downward move.
Complementing the reversal signals, the indicator features a stepped moving average that serves as a dynamic trend indicator. This moving average updates at intervals defined by the MA Step Period and shifts direction based on price crossings. If the price remains above the stepped MA, it indicates a bullish trend, coloring the area between the MA and the center line in green. Conversely, if the price falls below the stepped MA, a bearish trend is signaled, and the area is shaded red. This visual representation helps traders quickly assess the prevailing market trend and align their trading decisions accordingly.
Experience a new level of market insight with the Reversal Signals indicator. Add it to your TradingView chart today and enhance your ability to detect and act on key ma

Zero Lag Trend Signals (MTF) [AlgoAlpha]Zero Lag Trend Signals 🚀📈
Ready to take your trend-following strategy to the next level? Say hello to Zero Lag Trend Signals , a precision-engineered Pine Script™ indicator designed to eliminate lag and provide rapid trend insights across multiple timeframes. 💡 This tool blends zero-lag EMA (ZLEMA) logic with volatility bands, trend-shift markers, and dynamic alerts. The result? Timely signals with minimal noise for clearer decision-making, whether you're trading intraday or on longer horizons. 🔄
🟢 Zero-Lag Trend Detection : Uses a zero-lag EMA (ZLEMA) to smooth price data while minimizing delay.
⚡ Multi-Timeframe Signals : Displays trends across up to 5 timeframes (from 5 minutes to daily) on a sleek table.
📊 Volatility-Based Bands : Adaptive upper and lower bands, helping you identify trend reversals with reduced false signals.
🔔 Custom Alerts : Get notified of key trend changes instantly with built-in alert conditions.
🎨 Color-Coded Visualization : Bullish and bearish signals pop with clear color coding, ensuring easy chart reading.
⚙️ Fully Configurable : Modify EMA length, band multiplier, colors, and timeframe settings to suit your strategy.
How to Use 📚
⭐ Add the Indicator : Add the indicator to favorites by pressing the star icon. Set your preferred EMA length and band multiplier. Choose your desired timeframes for multi-frame trend monitoring.
💻 Watch the Table & Chart : The top-right table dynamically updates with bullish or bearish signals across multiple timeframes. Colored arrows on the chart indicate potential entry points when the price crosses the ZLEMA with confirmation from volatility bands.
🔔 Enable Alerts : Configure alerts for real-time notifications when trends shift—no need to monitor charts constantly.
How It Works 🧠
The script calculates the zero-lag EMA (ZLEMA) by compensating for data lag, giving traders more responsive moving averages. It checks for volatility shifts using the Average True Range (ATR), multiplied to create upper and lower deviation bands. If the price crosses above or below these bands, it marks the start of new trends. Additionally, the indicator aggregates trend data from up to five configurable timeframes and displays them in a neat summary table. This helps you confirm trends across different intervals—ideal for multi-timeframe analysis. The visual signals include upward and downward arrows on the chart, denoting potential entries or exits when trends align across timeframes. Traders can use these cues to make well-timed trades and avoid lag-related pitfalls.

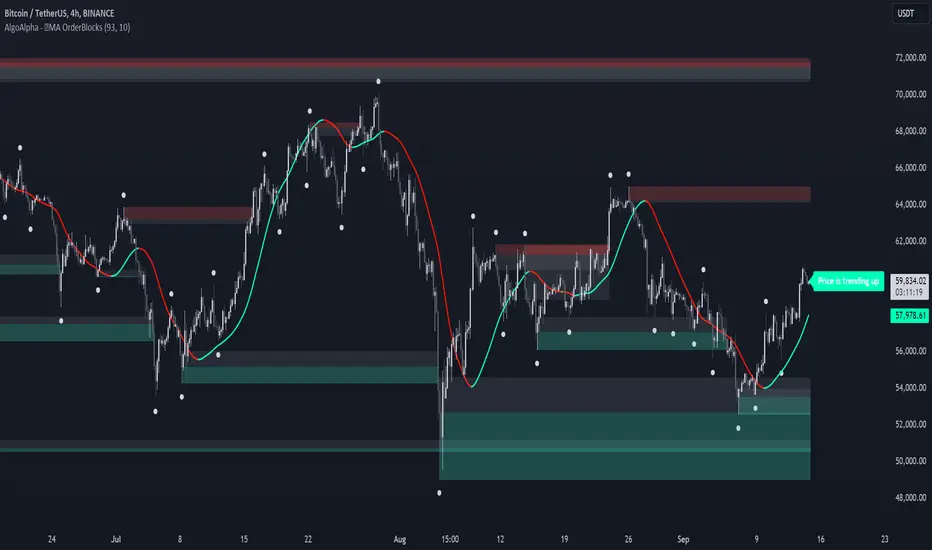
MA OrderBlocks [AlgoAlpha]🟨 HMA OrderBlocks by AlgoAlpha is a powerful tool designed to help traders visualize key pivot zones and order blocks based on the Hull Moving Average (HMA). By dynamically identifying bullish and bearish pivot points, this script provides insights into potential price reversals and trend continuations. With customizable settings, it allows traders to tweak the behavior of the indicator to match their strategies. Plus, it comes packed with built-in alerts for trend changes, making it easier to spot potential trade opportunities.
Key Features :
📊 Trend Detection : Utilizes Hull Moving Average to detect the current trend.
🟢🔴 Bullish & Bearish Zones : Automatically plots bullish and bearish order blocks, using customizable colors for clear visual cues.
🎯 Pivot Points : Detects and marks pivot highs and lows, helping traders spot key price reversals.
🚨 Alerts : Built-in alert system for when the price approaches key bullish or bearish zones, or when the trend changes.
🔨 Customizable MA: Choose from various moving averages (SMA, HMA, EMA, etc.) to suit your strategy.
How to Use :
⭐ Add the Indicator : Add the indicators to favourites by pressing the star icon. Once added, configure settings like the Hull MA period and pivot detection period.
📈 Analyze the Chart : Watch for the plotted order blocks and pivot points to identify possible price action strategies.
🔔 Enable Alerts : Set up alerts to be notified of potential trend reversals or when the price nears a bullish/bearish block.
How It Works :
The script starts by calculating the Hull Moving Average (HMA) based on the user-defined length, which is used to determine the market trend direction. It compares the current HMA value with the previous one to confirm whether the price is trending upwards or downwards. Once a trend change is detected, it plots bullish or bearish order blocks based on recent pivot highs and lows. These zones are extended in real-time as long as they remain invalidated. Zones are invalidated are invalidated when price completely closes through them. If the price gets close to a zone in the opposing direction, a warning system alerts the user that the block may not hold. Additionally, customizable alerts trigger whenever the price trend shifts or the price gets near important bullish/bearish blocks. The script’s logic ensures that order blocks are cleared if price violates them, keeping the chart clean and updated.
Ranges and Breakouts [AlgoAlpha]💥 Ranges and Breakouts by AlgoAlpha is a dynamic indicator designed for traders seeking to identify market ranges and capitalize on breakout opportunities. This tool automatically detects ranges based on price action over a specified period, visualizing these ranges with shaded boxes and midlines, making it easy to spot potential breakout scenarios. The indicator includes advanced features such as customizable pivot detection, internal range allowance, and automatic trend color changes for quick market analysis.
Key Features
💹 Dynamic Range Detection : Automatically identifies market ranges using customizable look-back and confirmation periods.
🎯 Breakout Alerts : Get alerted to bullish and bearish breakouts for potential trading opportunities.
📊 Visual Aids : Displays pivot highs/lows within ranges and plots midlines with adjustable styles for easier market trend interpretation.
🔔 Alerts : Signals potential take-profit points based on volatility and moving average crossovers.
🎨 Customizable Appearance : Choose between solid, dashed, or dotted lines for midlines and adjust the colors for bullish and bearish zones.
How to Use
⭐ Add the Indicator : Add the indicator to favorites by pressing the star icon. Adjust the settings like the look-back period, confirmation length, and pivot detection to match your trading strategy.
👀 Monitor the Chart : Watch for new ranges to form, highlighted by shaded boxes on the chart. Midlines and range bounds will appear to help you gauge potential breakout points.
⚡ React to Breakouts : Pay attention to color changes and alert signals for bullish or bearish breakouts. Use these signals to enter or exit trades.
🔔 Set Alerts : Customize alert conditions for new range formations, breakout signals, and take-profit levels to stay on top of market movements without constant monitoring.
How It Works
The indicator detects price ranges by analyzing the highest and lowest prices over a specified period. It confirms a range if these levels remain unchanged for a set number of bars, at which point it visually marks the range with shaded boxes. Pivots are identified within these ranges, and a midline is plotted to help interpret potential breakouts. When price breaks out of these defined ranges, the indicator changes the chart's background color to signal a bullish or bearish trend. Alerts can be set for range formation, breakouts, and take-profit opportunities, helping traders stay proactive in volatile markets.

Hullinger Percentile Oscillator [AlgoAlpha]🚀 Introducing the Hullinger Percentile Oscillator by AlgoAlpha! 🚀
This versatile Pine Script™ indicator is designed to help you identify swing trends and potential reversals with precision. Whether you're looking to catch market swings or spot divergences, the Hullinger Percentile Oscillator offers a comprehensive suite of features to enhance your trading strategy.
Key Features
🎯 Customizable Hullinger Settings: Adjust the main length, source, and standard deviation multipliers to fine-tune the indicator to your preferred trading style.
🔄 Dynamic Oscillator Modes: Switch between "Swing" mode for trend identification and "Contrarian" mode for reversal spotting, adapting the indicator to your market view.
📉 Divergence Detection: The indicator includes parameters to control the sensitivity and confirmation of divergence signals, helping to filter out noise and highlight significant market moves.
🌈 Color-Coded Visuals: Easily distinguish between bullish and bearish signals with customizable color settings for a clear visual representation on your chart.
🔔 Alert Integration: Stay ahead of the market with built-in alerts for key conditions, including strong and weak reversals, as well as bullish and bearish swings.
Quick Guide to Using the Hullinger Percentile Oscillator
Maximize your trading edge with the Hullinger Percentile Oscillator by following these steps! 📈✨
🛠 Add the Indicator: Add the indicator to favorites by pressing the star icon ⭐. Customize settings like Main Length, Oscillator Mode, and Appearance to fit your trading needs.
📊 Market Analysis: Use "Swing" mode to track trends and "Contrarian" mode to spot reversals. Watch for divergence signals to catch potential trend changes.
🔔 Alerts: Set up alerts to be notified of significant market movements without constantly monitoring your chart.
How It Works
The Hullinger Percentile Oscillator calculates its signals by applying a modified standard deviation approach to the Hull Moving Average (HMA) of a selected price source. It creates both inner and outer bands based on different multipliers. The oscillator then measures the position of the price relative to these bands, smoothing the result for swing trend detection. Depending on the chosen mode, the oscillator either highlights swing trends or potential reversals. Divergences are detected by comparing recent pivot highs and lows in both price and the oscillator, allowing you to spot bullish or bearish divergence setups. Alerts are triggered based on key crossovers or when specific conditions are met, ensuring that you are always informed of crucial market developments.

Hullinger Bands [AlgoAlpha]🎯 Introducing the Hullinger Bands Indicator ! 🎯
Maximize your trading precision with the Hullinger Bands , an advanced tool that combines the strengths of Hull Moving Averages and Bollinger Bands for a robust trading strategy. This indicator is designed to give traders clear and actionable signals, helping you identify trend changes and optimize entry and exit points with confidence.
✨ Key Features :
📊 Dual-Length Settings : Customize your main and TP signal lengths to fit your trading style.
🎯 Enhanced Band Accuracy : The indicator uses a modified standard deviation calculation for more reliable volatility measures.
🟢🔴 Color-Coded Signals : Easily spot bullish and bearish conditions with customizable color settings.
💡 Dynamic Alerts : Get notified for trend changes and TP signals with built-in alert conditions.
🚀 Quick Guide to Using Hullinger Bands
1. ⭐ Add the Indicator : Add the indicator to favorites by pressing the star icon. Adjust the settings to align with your trading preferences, such as length and multiplier values.
2. 🔍 Analyze Readings : Observe the color-coded bands for real-time insights into market conditions. When price is closer to the upper bands it suggests an overbought market and vice versa if price is closer to the lower bands. Price being above or below the basis can be a trend indicator.
3. 🔔 Set Alerts : Activate alerts for bullish/bearish trends and TP signals, ensuring you never miss a crucial market movement.
🔍 How It Works
The Hullinger Bands indicator calculates a central line (basis) using a simple moving average, while the upper and lower bands are derived from a modified standard deviation of price movements. Unlike the traditional Bollinger Bands, the standard deviation in the Hullinger bands uses the Hull Moving Average instead of the Simple Moving Average to calculate the average variance for standard deviation calculations, this give the modified standard deviation output "memory" and the bands can be observed expanding even after the price has started consolidating, this can identify when the trend has exhausted better as the distance between the price and the bands is more apparent. The color of the bands changes dynamically, based on the proximity of the closing price to the bands, providing instant visual cues for market sentiment. The indicator also plots TP signals when price crosses these bands, allowing traders to make informed decisions. Additionally, alerts are configured to notify you of crucial market shifts, ensuring you stay ahead of the curve.

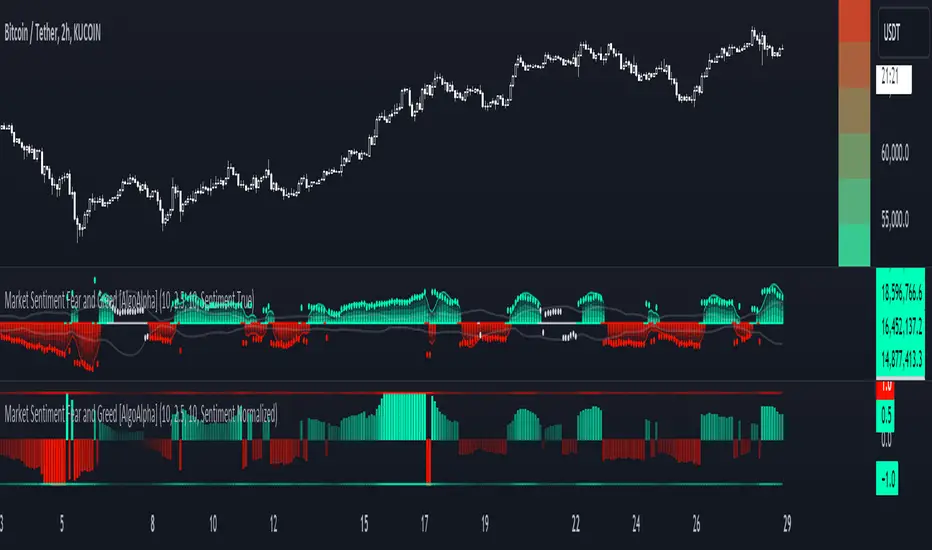
Market Sentiment Fear and Greed [AlgoAlpha]Unleash the power of sentiment analysis with the Market Sentiment Fear and Greed Indicator! 📈💡 This tool provides insights into market sentiment, helping you make informed trading decisions. Let's dive into its key features and how it works. 🚀✨
Key Features 🎯
🧠 Sentiment Analysis : Calculates market sentiment using volume and price data. 📊
📅 Customizable Lookback Window : Adjust the lookback period to fine-tune sensitivity. 🔧
🎨 Bullish and Bearish Colors : Visualize trends with customizable colors. 🟢🔴
🚀 Impulse Detection : Identifies bullish and bearish impulses for trend confirmation. 🔍
📉 Normalized Sentiment Index : Offers a normalized view of market sentiment. 📊
🔔 Alerts : Set alerts for key sentiment changes and trend impulses. 🚨
🟢🔴 Table Visualization : Displays sentiment strength using a gradient color table. 🗂️
How to Use 📖
Maximize your trading potential with this indicator by following these steps:
🔍 Add the Indicator : Search for "Market Sentiment Fear and Greed " in TradingView's Indicators & Strategies. Customize settings like the lookback window and trend breakout threshold to suit your trading strategy.
📊 Monitor Sentiment : Watch the sentiment gauge and plot changes to detect market sentiment shifts. Use the Normalized Sentiment Index for a more balanced view.
🚨 Set Alerts : Enable alerts for sentiment flips and trend impulses to stay ahead of market movements.
How It Works ⚙️
The indicator calculates market sentiment by averaging the volume and closing prices over a user-defined lookback period, creating a sentiment score. It differentiates between bullish and bearish sentiment by evaluating whether the closing price is higher or lower than the opening price, summing the respective volumes. The true sentiment is determined by comparing these summed values, with a positive score indicating bullish sentiment and a negative score indicating bearish sentiment. The indicator further normalizes this sentiment score by dividing it by the EMA of the highest high minus the lowest low over double the lookback period, ensuring values are constrained between -1 and 1. Bullish and bearish impulses are identified using Hull Moving Averages (HMA) of the positive and negative sentiments, respectively. When these impulses exceed a calculated threshold based on the standard deviation of the sentiment, it indicates a significant trend change. The script also includes a gradient color table to visually represent the strength of sentiment, and customizable alerts to notify users of key sentiment changes and trend impulses.
Unlock deeper insights into market sentiment and elevate your trading strategy with the Market Sentiment Fear and Greed Indicator! 📈✨
Visible Range Support and Resistance [AlgoAlpha]🌟 Introducing the Visible Range Support and Resistance 🌟
Discover key support and resistance levels with the innovative "Visible Range Support and Resistance" indicator by AlgoAlpha! 🚀📈 This advanced tool dynamically identifies significant price zones based on the visible range of your chart, providing traders with crucial insights for making informed decisions.
Key Features:
Dynamic support and resistance levels based on visible chart range 📏
User-defined resolution for tailored analysis 🎯
Clear visual representation of significant key zones 🖼️
Easy integration with any trading strategy 💼
How to Use:
🛠 Add the Indicator : Add the indicator to favourites. Adjust settings like resolution and horizontal extension to suit your trading style.
📊 Market Analysis : Identify key support and resistance zones based on the highlighted areas. These zones indicate significant price levels where the market may react.
How it Works:
The indicator segments the price range into user-defined resolutions, analyzing the highest and lowest points to establish boundaries. It calculates the frequency of price action within these segments, highlighting key levels where price movements are least concentrated (areas where price tends to pivot). Customizable settings like resolution and horizontal extension allow for tailored analysis, while the intuitive visual representation makes it easy to spot potential support and resistance zones directly on your chart.
By leveraging this indicator, you can gain deeper insights into market dynamics and improve your trading strategy with data driven support and resistance analysis. Happy trading! 💹✨

Trend Strength Signals [AlgoAlpha]🌟Introducing the Trend and Strength Signals indicator by AlgoAlpha ! This tool is designed to help you identify trends and gauge market strength with precision and ease. 📈🚀
🛠 Customizable Parameters : Adjust the period, standard deviation multiplier, gauge size, and colors to fit your trading style.
📊 Trend Detection : Visualize trends with clear color-coded signals for uptrends and downtrends.
📈 Strength Gauge : Assess market strength with a dynamic gauge that adapts to the current price action.
🔔 Alerts : Set alerts for bullish and bearish trend crossovers and take profit points to stay ahead of the market.
🎨 Visual Enhancements : Enjoy a clutter-free chart with the integration of plot shapes, color fills, and gradient gauges.
🚀 Quick Guide to Using the Trend and Strength Signals Indicator
Maximize your trading with the Trend and Strength Signals indicator by following these streamlined steps! 🎯✨
🛠 Add the Indicator : Add the indicator to your favorites. Customize settings like period, standard deviation multiplier, and colors to fit your trading style.
📊 Market Analysis : Observe the color-coded candles and gauge to understand market trend direction and strength. Use the alerts for key trading signals.
🔔 Alerts : Enable notifications for trend crossovers and take profit points to catch trading opportunities without constantly monitoring the chart.
⚙️ How it works
This indicator calculates the moving average and standard deviation of the closing price over a customizable period to identify the upper and lower bounds. When the price crosses these bounds, it signals an uptrend or downtrend. The gauge measures market strength by comparing the price to the moving average and scaling it over a customizable range, while the underlying logic uses concepts from the Bollinger Bands, this indicator gives a unique perspective on price behavior through added features and signals derived from it.
Unleash the power of trend and strength analysis with this comprehensive indicator! Happy trading! 🚀📈✨
Net Buying/Selling Flows Toolkit [AlgoAlpha]🌟📊 Introducing the Net Buying/Selling Flows Toolkit by AlgoAlpha 📈🚀
🔍 Explore the intricate dynamics of market movements with the Net Buying/Selling Flows Toolkit designed for precision and effectiveness in visualizing money inflows and outflows and their impact on asset prices.
🔀 Multiple Display Modes : Choose from "Flow Comparison", "Net Flow", or "Sum of Flows" to view the data in the most relevant way for your analysis.
📏 Adjustable Unit Display : Easily manage the magnitude of the values displayed with options like "1 Billion", "1 Million", "1 Thousand", or "None".
🔧 Lookback Period Customization : Tailor the sum calculation window with a configurable lookback period, applicable in "Sum of Flows" mode.
📊 Deviation Thresholds : Set up lower and upper deviation thresholds to identify significant changes in flow data.
🔄 Reversal Signals and Deviation Bands : Enable signals for potential reversals and visualize deviation bands for comparative analysis.
🎨 Color-coded Visualization : Distinct colors for upward and downward movements make it easy to distinguish between buying and selling pressures.
🚀 Quick Guide to Using the Net Buying/Selling Flows Toolkit :
🔍 Add the Indicator : Add the indicator to you favorites. Customize the settings to fit your trading requirements.
👁️🗨️ Data Analysis : Compare the trend of Buying and Selling to help indicate whether bulls or bears are in control of the market. Utilize the different display modes to present the data in different form to suite your analysis style.
🔔 Set Alerts : Activate alerts for reversal conditions to keep abreast of significant market movements without having to monitor the charts constantly.
🌐 How It Works :
The toolkit processes volume data on a lower timeframe to distinguish between buying and selling pressures based on intra-bar price closing higher or lower than it opened. It aggregates these transactions and finds the net selling and buying that took place during that bar, offering a clearer view of market fundamentals. The indicator then plots this data visually with multiple modes including comparisons between buying/selling and the net flow of the asset. Deviation thresholds help in identifying significant changes, allowing traders to spot potential buying or selling opportunities based on the money flow dynamics. The "Sum of Flows" mode is unique from other trend following indicators as it does not determine trend based on price action, but rather based on the net buying/selling. Therefore in some cases the "Sum of Flows" mode can be a leading indicator showing bullish/bearish net flows even before the prices move significantly.
Embark on a more informed trading journey with this dynamic and insightful tool, tailor-made for those who demand precision and clarity in their trading strategies. 🌟📉📈

Institutional Activity Index [AlgoAlpha]🌟 Introducing the Institutional Activity Index by AlgoAlpha 🌟
Welcome to a powerful new indicator designed to gauge institutional trading activity! This cutting-edge tool combines volume analysis with price movement to derive a unique index that shines a spotlight on potential institutional moves in the market. 🎯📈
Key Features:
🔍 Normalization Period : Adjust the look-back period for normalization to tailor the sensitivity to your trading strategy.
📊 Moving Average Types : Choose from SMA, HMA, EMA, RMA, WMA, or VWMA to smooth the index and pinpoint trends.
🌈 Color-Coded Trends : Instant visual feedback on index trend direction with customizable up and down colors.
🔔 Alerts : Set alerts for when the index shows increasing activity, decreasing activity, or has reached a peak.
Quick Guide to Using the Institutional Activity Index:
1. 📝 Add the Indicator: Add the indicator to favorites. Adjust the normalization period, MA type, and peak detection settings to match your trading style.
2. 📈 Market Analysis: Similar to volume that reflects the amount of collective trading activity, this index reflects an estimate of the amount of trading activity by institutions. A higher value means that institutions are trading the asset more, this can mean selling or buying as the indicator does not indicate direction . Look out for peak signals, which may indicate that institutions have already secured positions in preparation for a move in price.
3. 🔔 Set Alerts: Enable alerts to notify you when there is a significant change in the activity levels or a new peak is detected, allowing for timely decisions without constant monitoring.
How It Works: 🛠
It is common knowledge that institutions trade with high amounts of capital, but employ tactics so as to not move the price significantly when entering on positions. This can be done by entering in times of high liquidity so that when an institution buys, there are enough sellers to cancel out the price movements and prevent a huge pump in price and vice versa. The Institutional Activity Index calculates liquidity by measuring the volume relative to the price range (close-open). This value is smoothed using median and a user defined moving average type and period, enhancing its clarity. If normalization is enabled, the index is adjusted relative to its range over a user-defined period, making the data comparable across different conditions.
Embrace this innovative tool to enhance your trading insights and strategies! 🚀✨

Crypto Realized Profits/Losses Extremes [AlgoAlpha]🌟🚀 Introducing the Crypto Realized Profits/Losses Extremes Indicator by AlgoAlpha 🚀🌟
Unlock the potential of cryptocurrency markets with our cutting-edge On-Chain Pine Script™ indicator, designed to highlight extreme realized profit and loss zones! 🎯📈
Key Features:
✨ Realized Profits/Losses Calculation: Uses real-time data from the blockchain to monitor profit and loss realization events.
📊 Multi-Crypto Compatibility: The Indicator is compatible on other Crypto tickers besides Bitcoin.
⚙️ Customizable Sensitivity: Adjust the look-back period, normalization period, and deviation thresholds to tailor the indicator to your trading style.
🎨 Visual Enhancements: Choose from a variety of colors for up and down trends, and toggle extreme profit/loss overlay for easy viewing.
🔔 Integrated Alerts: Set up alerts for high and extreme profit or loss conditions, helping you stay ahead of significant market movements.
🔍 How to Use:
🛠 Add the Indicator: Add the indicator to favorites. Customize settings like period lengths and deviation thresholds according to your needs.
📊 Market Analysis: Monitor the main oscillator and the bands to understand current profit and loss extremes in the market. When the oscillator is at the upper band, this means that the market is doing really well and traders/investors will be likely to take profit and cause a reversal. The opposite is true when the oscillator reaches the lower band. The main oscillator can also be used for trend analysis.
🔔 Set Alerts: Configure alerts to notify you when the market enters a zone of high profit or loss, or during trend changes, enabling timely decisions without constant monitoring.
How It Works:
The indicator calculates a normalized area under the RSI curve applied on on-chain data regarding the number of wallets in profit. It employs a custom "src" variable that aggregates data from the blockchain about profit and loss addresses, adapting to intraday or longer timeframes as needed. The main oscillator plots this normalized area, while the upper and lower bands are plotted based on a deviation metric to identify extreme conditions. Colored fills between these bands visually denote these zones. For interaction, the indicator plots bubbles for extreme profits or losses and provides optional bar coloring to reflect the current market trend.
🚀💹 Enjoy a comprehensive, customizable, and visually engaging tool that helps you stay ahead in the fast-paced crypto market!

Candlestick Reversal and Trend Signals [AlgoAlpha]🚀 Unleash your charting capabilities with the Candlestick Reversal and Trend Signals indicator by AlgoAlpha, your go-to tool for spotting pivotal market movements! This script enhances your trading experience by identifying key candlestick patterns and trend changes, perfect for traders aiming for precision in their technical analysis.
🛠 Key Features:
- 🔄 Multi-Timeframe Analysis : Leverages a timeframe multiplier to analyze levels on higher timeframes, enhancing the depth and applicability of insights.
- 🧩 Diverse Pattern Detection : Capable of detecting a wide array of patterns including Bull/Bear Engulfings, Dojis, Haramis, Piercing Lines, Dark Cloud Covers, and Morning/Evening Stars, each contributing to a robust trading strategy.
- 🔍 Dynamic Trend Filters : Utilizes three exponential moving averages (EMAs) and volume filters to decisively confirm trend directions and strength, providing a clearer picture of market dynamics.
- ⚙️ Customizable Settings : Features adjustable settings for filter period, signal thresholds, and appearance, allowing for a tailored analysis experience to fit individual trading styles.
- 📉 Swing Levels Identification : Marks significant high and low swing points on the chart, highlighting potential pivot points and trend reversals for strategic trading decisions.
📈 Quick Guide to Using the Candlestick Reversal and Trend Signals Indicator
1. 🛠 Add the Indicator : Add the indicator to your favorites. Adjust the settings to match your analysis needs.
2. 📊 Analysis : Keep an eye out for the specific symbols plotted on your chart that indicate various candlestick patterns. Use these signals to enhance your market analysis.
3. 🔔 Set Alerts : Enable alerts for the patterns you are most interested in to get notified of potential trading opportunities without needing to monitor the charts constantly.
Embark on your enhanced trading journey with this powerful tool! 🚀✨ Happy trading!
🧐 How It Works:
The Candlestick Reversal and Trend Signals indicator operates by integrating several candlestick patterns and trend analysis features to assist in making informed trading decisions. Initially, it gathers user-defined settings like the period for filtering, signal thresholds, and the desired patterns to detect. It analyzes candlestick formations such as Bull/Bear Engulfings, Dojis, Haramis, and more, by comparing the current candlestick's attributes (such as body length and direction) with previous data to identify potential market reversals or confirmations. The indicator enhances its accuracy through additional filters like volume ratios and exponential moving averages (EMAs) that help validate the strength and direction of trends. By marking these patterns and trends visually on the chart, it provides clear signals that aid traders in identifying significant market movements efficiently. The script is then complemented with the 3 EMA indicator for trend detection and swing levels for added confluence.

Smart Money Liquidity Heatmap [AlgoAlpha]🌟📈 Introducing the Smart Money Liquidity Heatmap by AlgoAlpha! 🗺️🚀
Dive into the depths of market liquidity with our innovative Pine Script™ indicator designed to illuminate the trading actions of smart money! This meticulously crafted tool provides an enhanced visualization of liquidity flow, highlighting the dynamics between smart and retail investors directly on your chart! 🌐🔍
🙌 Key Features of the Smart Money Liquidity Heatmap:
🖼️ Visual Clarity: Uses vibrant heatmap colors to represent liquidity concentrations, making it easier to spot significant trading zones.
🔧 Customizable Settings: Adjust index periods, volume flow periods, and more to tailor the heatmap to your trading strategy.
📊 Dynamic Ratios: Computes the ratio of smart money to retail trading activity, providing insights into who is driving market movements.
👓 Transparency Options: Modify color intensity for better visibility against various chart backgrounds.
🛠 How to Use the Smart Money Liquidity Heatmap:
1️⃣ Add the Indicator:
Add the indicator to favourites. Customize settings to align with your trading preferences, including periods for index calculation and volume flow.
2️⃣ Market Analysis:
Monitor the heatmap for high liquidity zones signalled by the heatmap. These are potential areas where smart money is actively engaging, providing crucial insights into market dynamics.
Basic Logic Behind the Indicator:
The Smart Money Liquidity Heatmap utilizes the Smart Money Interest Index Indicator and operates by differentiating between the trading behaviors of informed (smart money) and less-informed (retail) traders. It calculates the differences between specific volume indices—Positive Volume Index (PVI) for retail investors and Negative Volume Index (NVI) for institutional players—and their respective moving averages, highlighting these differences using the Relative Strength Index (RSI) over user-specified periods. This calculation generates a ratio that is then normalized and compared against a threshold to identify areas of high institutional trading interest, visually representing these zones on your chart as vibrant heatmaps. This enables traders to visually identify where significant trading activities among smart money are occurring, potentially signalling important buying or selling opportunities.
🎉 Elevate your trading experience with precision, insight, and clarity by integrating the Smart Money Liquidity Heatmap into your toolkit today!

Rolling Point of Control (POC) [AlgoAlpha]Enhance your trading decisions with the Rolling Point of Control (POC) Indicator designed by AlgoAlpha! This powerful tool displays a dynamic Point of Control based on volume or price profiles directly on your chart, providing a vivid depiction of dominant price levels according to historical data. 🌟📈
🚀 Key Features:
Profile Type Selection: Choose between Volume Profile and Price Profile to best suit your analysis needs.
Adjustable Lookback Period: Modify the lookback period to consider more or less historical data for your profile.
Customizable Resolution and Scale: Tailor the resolution and horizontal scale of the profile for precision and clarity.
Trend Analysis Tools: Enable trend analysis with the option to display a weighted moving average of the POC.
Color-Coded Feedback: Utilize color gradients to quickly identify bullish and bearish conditions relative to the POC.
Interactive Visuals: Dynamic rendering of profiles and alerts for crossing events enhances visual feedback and responsiveness.
Multiple Customization Options: Smooth the POC line, toggle profile and fill visibility, and choose custom colors for various elements.
🖥️ How to Use:
🛠 Add the Indicator:
Add the indicator to favorites and customize settings like profile type, lookback period, and resolution to fit your trading style.
📊 Market Analysis:
Monitor the POC line for significant price levels. Use the histogram to understand price distributions and locate major market pivots.
🔔 Alerts Setup:
Enable alerts for price crossing over or under the POC, as well as for trend changes, to stay ahead of market movements without constant chart monitoring.
🛠️ How It Works:
The Rolling POC indicator dynamically calculates the Point of Control either based on volume or price within a user-defined lookback period. It plots a histogram (profile) that highlights the level at which the most trading activity has occurred, helping to identify key support and resistance levels.
Basic Logic Overview:
- Data Compilation: Gathers high, low, and volume (if volume profile selected) data within the lookback period.
- Histogram Calculation: Divides the price range into bins (as specified by resolution), counting hits in each bin to find the most frequented price level.
- POC Identification: The price level with the highest concentration of hits (or volume) is marked as the POC.
- Trend MA (Optional): If enabled, the indicator plots a moving average of the POC for trend analysis.
By integrating the Rolling Point of Control into your charting toolkit, you can significantly enhance your market analysis and potentially increase the accuracy of your trading decisions. Whether you're day trading or looking at longer time frames, this indicator offers a detailed, customizable perspective on market dynamics. 🌍💹

Liquidation Levels with Liquidity Sweeps/Breakouts [AlgoAlpha]🌊📈 Dive into the depths of market liquidity with "Liquidation Levels with Liquidity Sweeps/Breakouts" - your ultimate tool for navigating the turbulent waters of trading! 🧹💹 Crafted by the wizards at AlgoAlpha, this Pine Script™ masterpiece illuminates the unseen liquidity levels and sweeps, guiding you through the financial seas with insight. 🚀🔍
Key Features:
🕒 Timeframe Flexibility: Customize your analysis with a TimeFrame Multiplier, allowing the indicator to operate on higher timeframes for broader market insight.
💥 Dynamic Volume Threshold: Set your sensitivity to breakouts with the High Volume Threshold, ensuring you catch significant market movements while avoiding fakeouts.
👀 Visibility Controls: Toggle the display of swept liquidity and highlight liquidity breakouts with customizable background colors for clear, actionable insights.
🎨 Custom Appearance: Personalize your chart with bullish, bearish, and breakout colors to match your trading style.
How to Use the Liquidity Levels with Liquidation Sweeps Indicator:
Maximize your trading efficiency with the Liquidity Levels with Liquidation Sweeps Indicator by following these simple steps! 🚀🌟
⚙️ Customize Settings: Access the indicator settings to personalize the TimeFrame Multiplier, High Volume Threshold, and Relative Volume Period. Tailor these settings to match your trading strategy and chart preferences.
👁️ Analyze Liquidity Levels: Monitor the chart for liquidity levels and sweeps. Bullish sweeps are marked with green labels, bearish sweeps with red, and breakouts highlighted by the chart background.
🔔 Set Alerts: Enable alert conditions for liquidity breakouts and sweeps within the indicator's settings. This feature allows you to receive real-time notifications, helping you to act promptly on trading opportunities.
How It Works:
The heart of this indicator lies in its ability to track and highlight liquidity levels derived from swing pivots, and sweeps across multiple timeframes. By calculating relative volume against a user-defined threshold, it identifies strong volume movements indicative of liquidity breakouts, this helps filter out fake-outs. When a liquidity level is breached but not completely mitigated, it's either marked as a bullish or bearish sweep, which come with the option to show an estimate of the number of liquidations during the sweep.
if peakform and peakprinted != 1
aR.push(line.new(bar_index-mult, h.get(1), bar_index+1, h.get(1), color = red))
aRv.push(h.get(1))
peakprinted := 1
if valleyform and valleyprinted != 1
aS.push(line.new(bar_index-mult, l.get(1), bar_index+1, l.get(1), color = green))
aSv.push(l.get(1))
valleyprinted := 1

Reversal and Breakout Signals [AlgoAlpha]🚀🌟 Introducing the Reversal and Breakout Signals by AlgoAlpha 🌟🚀
This innovative tool is crafted to enhance your chart analysis by identifying potential reversal and breakout opportunities directly on your charts. It's designed with both novice and experienced traders in mind, providing intuitive visual cues for better decision-making. Let's dive into the key features and how it operates:
### Key Features:
🔶 Dynamic Period Settings: Customize the sensitivity of the indicator with user-defined periods for both the indicator and volume strength.
📊 Volume Threshold: Set a threshold to define what constitutes strong volume, enabling the identification of significant market movements.
💡 Trend Coloring: Option to color candles during trends, making it easier to visualize bullish and bearish market conditions.
🌈 Customizable Visuals: Choose your preferred colors for bullish, bearish, and breakout signals, personalizing the chart to your liking.
🚨 Advanced Alert System: Configure alerts for reversal and breakout signals, ensuring you never miss a potential trading opportunity.
### How to Use:
To maximize the effectiveness of the Reversal and Breakout Signals tool, follow these steps:
1. 🔧 Set Up Your Preferences:
- Adjust the Indicator Period and Volume Strength Period to match the timeframe of your trading strategy. This fine-tuning allows the indicator to better align with your specific market analysis needs.
- Define the Strong Volume Threshold to distinguish between ordinary and significant volume movements. This helps in identifying breakout or reversal signals with higher confidence.
2. 🎨 Customize Visuals:
- Choose colors for Bullish , Bearish , and Breakout Signals to visually differentiate between different types of market activities. This customization facilitates quicker decision-making while scanning charts.
3. 🔍 Reversal Signals:
- Bullish Reversal : Look for a triangle below the bar indicating a potential upward movement. It's identified when the price dips below the lower level but closes above it, suggesting a rejection of lower prices.
- Bearish Reversal : A triangle above the bar signals a potential downward movement. This occurs when the price spikes above the upper level but closes below, indicating a rejection of higher prices.
4. 📈 Trend and Breakout Signals:
- Diamonds represent breakout signals. A bullish breakout is marked below the bar when the price closes above the upper level, suggesting strong buying pressure. Conversely, a bearish breakout above the bar indicates strong selling pressure as the price closes below the lower level.
- The tool also features a Trend Tracker that highlights the current market trend using the Hull Moving Average (HMA). This can help you stay aligned with the overall market direction for your trades.
By integrating these steps into your trading strategy, the Reversal and Breakout Signals tool can provide actionable insights to help identify potential entry and exit points, enhancing your trading decisions with visual cues and alerts for market reversals and breakouts.
### How It Works:
The core logic revolves around calculating weighted moving averages of high and low prices over a user-defined period, identifying the highest and lowest points within this period to establish potential breakout or breakdown levels while reducing the amount of noise, hence the use of moving averages.
1. Weighted Moving Averages Calculation:
sh = ta.wma(high, len)
sl = ta.wma(low, len)
h = ta.highest(sh, len)
l = ta.lowest(sl, len)
2. Breakout and Reversal Detection:
The script then employs logic to detect bullish and bearish breakouts and reversals based on the closing price's position relative to these levels, combined with volume analysis to confirm the strength of the move.
if not (h < h or h > h )
hstore := h
if not (l < l or l > l )
lstore := l
bullishbreakout := (breakout or ((breakout or breakout or breakout or breakout ) and candledir == 1)) and strongvol and not (bullishbreakout or bullishbreakout or bullishbreakout )
bearishbreakout := (breakdown or ((breakdown or breakdown or breakdown or breakdown ) and candledir == -1)) and strongvol and not (bearishbreakout or bearishbreakout or bearishbreakout )
3. Visual Indicators and Alerts:
Visual cues such as triangle shapes for reversals and diamonds for breakouts, along with colored bars, make it easy to spot these opportunities. Additionally, alerts can be set up for these events, ensuring traders can react promptly to potential trading setups.
plotshape(bullishrej and not (state ==- 1) ? low * 0.9995 : na, " Bullish Reversal ", shape.triangleup, location.belowbar, color.new(green, 0), size = size.tiny, text = "𝓡", textcolor = color.gray)
plotshape(bearishrej and not (state == 1) ? high * 1.0005 : na, " Bearish Reversal ", shape.triangledown, location.abovebar, color.new(red, 0), size = size.tiny, text = "𝓡", textcolor = color.gray)
plotshape(bullishbreakout ? low * 0.999 : na, " Bullish Breakout ", shape.diamond, location.belowbar, color.new(yellow, 0), size = size.tiny, text = "𝓑", textcolor = color.gray)
plotshape(bearishbreakout ? high * 1.001 : na, " Bearish Breakout ", shape.diamond, location.abovebar, color.new(yellow, 0), size = size.tiny, text = "𝓑", textcolor = color.gray)
This script is a versatile tool designed to aid in the identification of key reversal and breakout points, helping traders to make informed decisions based on technical analysis. Its customization options allow for a tailored analysis experience, fitting the unique needs and strategies of each trader.

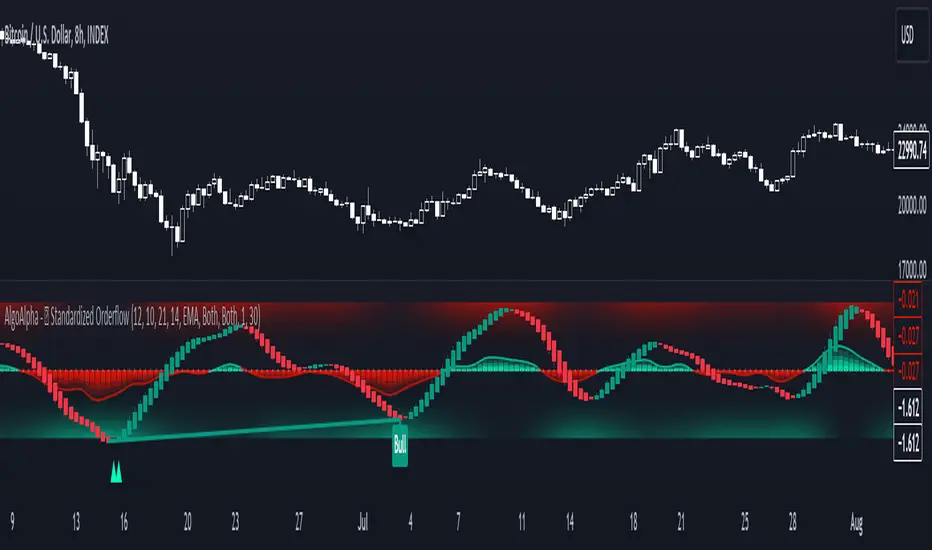
Standardized Orderflow [AlgoAlpha]Introducing the Standardized Orderflow indicator by AlgoAlpha. This innovative tool is designed to enhance your trading strategy by providing a detailed analysis of order flow and velocity. Perfect for traders who seek a deeper insight into market dynamics, it's packed with features that cater to various trading styles. 🚀📊
Key Features:
📈 Order Flow Analysis: At its core, the indicator analyzes order flow, distinguishing between bullish and bearish volume within a specified period. It uses a unique standard deviation calculation for normalization, offering a clear view of market sentiment.
🔄 Smoothing Options: Users can opt for a smoothed representation of order flow, using a Hull Moving Average (HMA) for a more refined analysis.
🌪️ Velocity Tracking: The indicator tracks the velocity of order flow changes, providing insights into the market's momentum.
🎨 Customizable Display: Tailor the display mode to focus on either order flow, order velocity, or both, depending on your analysis needs.
🔔 Alerts for Critical Events: Set up alerts for crucial market events like crossover/crossunder of the zero line and overbought/oversold conditions.
How to Use:
1. Setup: Easily configure the indicator to match your trading strategy with customizable input parameters such as order flow period, smoothing length, and moving average types.
2. Interpretation: Watch for bullish and bearish columns in the order flow chart, utilize the Heiken Ashi RSI candle calculation, and look our for reversal notations for additional market insights.
3. Alerts: Stay informed with real-time alerts for key market events.
Code Explanation:
- Order Flow Calculation:
The core of the indicator is the calculation of order flow, which is the sum of volumes for bullish or bearish price movements. This is followed by normalization using standard deviation.
orderFlow = math.sum(close > close ? volume : (close < close ? -volume : 0), orderFlowWindow)
orderFlow := useSmoothing ? ta.hma(orderFlow, smoothingLength) : orderFlow
stdDev = ta.stdev(orderFlow, 45) * 1
normalizedOrderFlow = orderFlow/(stdDev + stdDev)
- Velocity Calculation:
The velocity of order flow changes is calculated using moving averages, providing a dynamic view of market momentum.
velocityDiff = ma((normalizedOrderFlow - ma(normalizedOrderFlow, velocitySignalLength, maTypeInput)) * 10, velocityCalcLength, maTypeInput)
- Display Options:
Users can choose their preferred display mode, focusing on either order flow, order velocity, or both.
orderFlowDisplayCond = displayMode != "Order Velocity" ? display.all : display.none
wideDisplayCond = displayMode != "Order Flow" ? display.all : display.none
- Reversal Indicators and Divergences:
The indicator also includes plots for potential bullish and bearish reversals, as well as regular and hidden divergences, adding depth to your market analysis.
bullishReversalCond = reversalType == "Order Flow" ? ta.crossover(normalizedOrderFlow, -1.5) : (reversalType == "Order Velocity" ? ta.crossover(velocityDiff, -4) : (ta.crossover(velocityDiff, -4) or ta.crossover(normalizedOrderFlow, -1.5)) )
bearishReversalCond = reversalType == "Order Flow" ? ta.crossunder(normalizedOrderFlow, 1.5) : (reversalType == "Order Velocity" ? ta.crossunder(velocityDiff, 4) : (ta.crossunder(velocityDiff, 4) or ta.crossunder(normalizedOrderFlow, 1.5)) )
In summary, the Standardized Orderflow indicator by AlgoAlpha is a versatile tool for traders aiming to enhance their market analysis. Whether you're focused on short-term momentum or long-term trends, this indicator provides valuable insights into market dynamics. 🌟📉📈
BTC Supply in Profits and Losses (BTCSPL) [AlgoAlpha]Description:
🚨The BTC Supply in Profits and Losses (BTCSPL) indicator, developed by AlgoAlpha, offers traders insights into the distribution of INDEX:BTCUSD addresses between profits and losses based on INDEX:BTCUSD on-chain data.
Features:
🔶Alpha Decay Adjustment: The indicator provides the option to adjust the data against Alpha Decay, this compensates for the reduction in clarity of the signal over time.
🔶Rolling Change Display: The indicator enables the display of the rolling change in the distribution of Bitcoin addresses between profits and losses, aiding in identifying shifts in market sentiment.
🔶BTCSPL Value Score: The indicator optionally displays a value score ranging from -1 to 1, traders can use this to carry out strategic dollar cost averaging and reverse dollar cost averaging based on the implied value of bitcoin.
🔶Reversal Signals: The indicator gives long-term reversal signals denoted as "▲" and "▼" for the price of bitcoin based on oversold and overbought conditions of the BTCSPL.
🔶Moving Average Visualization: Traders can choose to display a moving average line, allowing for better trend identification.
How to Use ☝️ (summary):
Alpha Decay Adjustment: Toggle this option to enable or disable Alpha Decay adjustment for a normalized representation of the data.
Moving Average: Toggle this option to show or hide the moving average line, helping traders identify trends.
Short-Term Trend: Enable this option to display the short-term trend based on the Aroon indicator.
Rolling Change: Choose this option to visualize the rolling change in the distribution between profits and losses.
BTCSPL Value Score: Activate this option to show the BTCSPL value score, ranging from -1 to 1, 1 implies that bitcoin is extremely cheap(buy) and -1 implies bitcoin is extremely expensive(sell).
Reversal Signals: Gives binary buy and sell signals for the long term

Amazing Oscillator (AO) [Algoalpha]Description:
Introducing the Amazing Oscillator indicator by Algoalpha, a versatile tool designed to help traders identify potential trend shifts and market turning points. This indicator combines the power of the Awesome Oscillator (AO) and the Relative Strength Index (RSI) to create a new indicator that provides valuable insights into market momentum and potential trade opportunities.
Key Features:
Customizable Parameters: The indicator allows you to customize the period of the RSI calculations to fine-tune the indicator's responsiveness.
Visual Clarity: The indicator uses user-defined colors to visually represent upward and downward movements. You can select your preferred colors for both bullish and bearish signals, making it easy to spot potential trade setups.
AO and RSI Integration: The script combines the AO and RSI indicators to provide a comprehensive view of market conditions. The RSI is applied to the AO, which results in a standardized as well as a less noisy version of the Awesome Oscillator. This makes the indicator capable of pointing out overbought or oversold conditions as well as giving fewer false signals
Signal Plots: The indicator plots key levels on the chart, including the RSI threshold(Shifted down by 50) at 30 and -30. These levels are often used by traders to identify potential trend reversal points.
Signal Alerts: For added convenience, the indicator includes "x" markers to signal potential buy (green "x") and sell (red "x") opportunities based on RSI crossovers with the -30 and 30 levels. These alerts can help traders quickly identify potential entry and exit points.

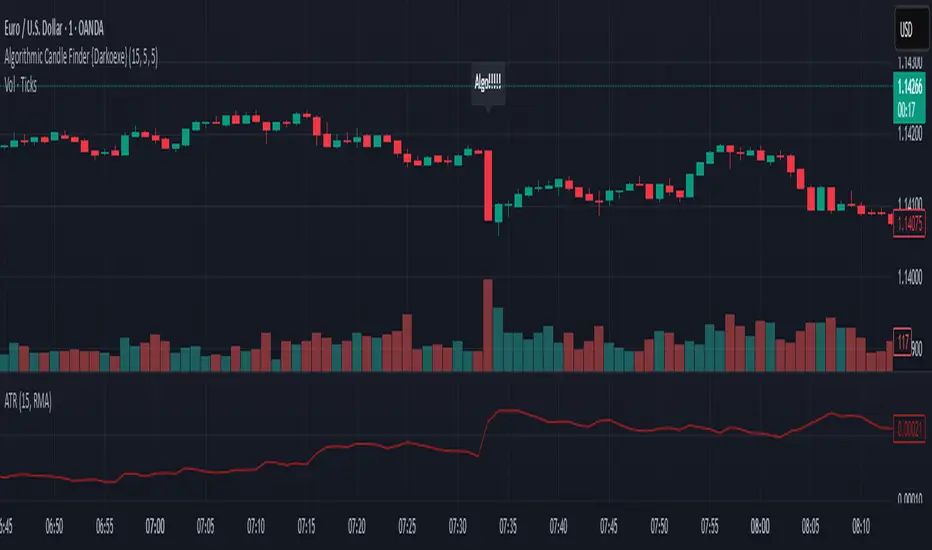
Algorithmic Candle Finder {Darkoexe}Algorithmic Candle Finder Indicator
Algorithmic candles are candles whose size and direction are significantly influenced by institutions or large players using market algorithms. These entities can move large amounts of capital in or out of the market, creating price moves that are often difficult for retail traders to predict or react to.
This can make short-term retail trading risky and inconsistent, especially when unaware of such institutional activity. The goal of this indicator is to help identify such candles, allowing traders to avoid trading during times of potential algorithmic influence.
Detection Criteria:
A candle is marked as algorithmic if either of the following conditions are met:
Size-Based Detection: If the current candle’s size exceeds the Average True Range (ATR) of the previous candle multiplied by the ATR factor input.
Volume-Based Detection: If the current candle’s volume exceeds the average volume of recent candles (e.g., last N candles) multiplied by the volume factor input.
When a candle is deemed algorithmic, a label saying "Algo!!!!!" will appear on the chart above the candle where the condition occurred.
Usage:
Use this indicator to study which times of day algorithmic candles frequently appear. This can help you adjust your strategy to avoid trading during these unpredictable moments.
Analogy:
Think of the market like the game Agar.io: small players (retail traders) collect small pellets to grow, while larger players (institutions) devour smaller ones. The small players must avoid the big ones to survive. Likewise, in trading, retail traders should aim to avoid high-impact algorithmic activity that could “consume” their trades.