My exponential moving averages - Suri's EMAs
It's not an indication of anything here, it's just part of my operating in a simple and summarized way, I hope it helps someone.
Suri's EMA's indicator is nothing more than a set of exponential moving averages (EMA). They are 12, 26, 50 and 200.
Attention to the use of the indicator, it is just an INDICATOR, it should not be taken as the main point of your entry, but to guide you in your entries in favor of the trend, whether intra-day or swing.
Created for clear, monochrome screens. Make your adjustments.
Color condition, candles turn green when their close is above EMA 12 and 26.
Color condition, candles turn red when their close is below EMA 12 and 26.
Condition for colors, MME12,26,50 and 200 will turn green with price working above it.
Condition for colors, MME12, 26, 50 and 200 will turn red with price working below it.
Indication for use in time-frames = 5m, 15m, 60m, 240m. (higher hit rates)
How to use the indicator, MME 12 and 26, are the most important and led you to more entries, but we should not only consider them, we have to analyze the whole context to then make a decision.
Indicator was nicknamed by me by "Pullback Pick", it works in a simple way:
In an uptrend or downtrend, the price usually tends to return in the averages or the averages go up to the price, that being said, it is easy to observe that where the price returns would be a pullback from the last movement, so when returning to the averages, the candle that shows strength in favor of this trend, in the EMA's region, becomes a possible entry, with its stop below or above this "pullback" formed, because the stop goes there, because usually when the price returns on the EMAs they tend to to hold and replay the price in favor of the trend.
My observations:
I like to enter when the price returns to the averages smoothly, without much movement, when it touches the average 12 or 26 it is an entry, but an entry without confirmation, the gain is greater, but the chance of being stopped is higher, I like it when the price is close to the 12 and 26 averages and leaves a small candle or doji on this pullback, my entry goes to the breakout of this candle and the stop behind the candle.
THERE IS NO MIRACLE, THERE IS NO 100% HIT RATE, SO USE STOP.
Aaaaaaaaaa I was forgetting.... and the target???
As it is a trend following setup, it is cool to leave a trailing stop or update the stop as new bottoms or tops are formed.
Targeting in 1v1 is good, setup pays a lot!
Targeting in 2x1 is too good, setup pays well!
Making a target in 3x1 is more than good, setup pays sometimes, then from now on, it depends on where you are entering this "PULLBACK", if it is in the first wave, in the second, if you are going to lateralize, the market is SOVEREIGN, put in the pocket that is no longer on the market, oh it's yours!
That's it, doubts, send it there, suggestion, opinion, whatever you want.
Added a symbol at the crossing of the 12 and 26 moving averages.
I am so sorry, but i dont speak english, use google translate.
Português.
Não se trata de indicação de nada aqui, é apenas parte do meu operacional de maneira simples e resumida, espero que ajude alguém.
Indicador Suri's EMA's, nada mais é do que um conjunto de médias móveis exponenciais(MME). São elas 12, 26, 50 e 200.
Atenção para o uso do indicador, ele é apenas um INDICADOR, não deve ser tomado como o ponto principal de sua entrada, mas sim de te balizar nas suas entradas a favor da tendência, seja ela intra-day ou swing.
Criado para telas claras e monocromáticas. Façam seus ajustes.
Condição para as cores, candles ficam verdes quando o fechamento dele é acima das MME 12 e 26.
Condição para as cores, candles ficam vermelhos quando o fechamento dele é abaixo das MME 12 e 26.
Condição para as cores, MME12,26,50 e 200 ficará verde com preço trabalhando acima dela.
Condição para as cores, MME12, 26, 50 e 200 ficará vermelho com preço trabalhando abaixo dela.
Indicação para uso nos time-frame = 5m, 15m, 60m, 240m.(taxas de acerto maior)
Como utilizar o indicador, MME 12 e 26, são as mais importantes e te levaram a mais entradas, porém não devemos levar apenas elas em consideração, temos que analisar todo o contexto para então tomar decisão.
Indicador foi apelidado por mim por " Pega Pullback", ele funciona de uma maneira simples:
Em tendência de alta ou de baixa, o preço geralmente tende a retornar nas médias ou as médias irem até o preço, dito isso é fácil de se observar que onde o preço retorna seria um pullback do último movimento, portanto ao retornar nas médias, o candle que mostra força a favor dessa tendência, na região das EMA's, se torna uma possível entrada, com o seu stop abaixo ou acima desse "pullback" formado, porque o stop vai nesse local, porque geralmente quando o preço retorna nas EMAs elas tendem a segurar e voltar a jogar o preço a favor da tendência.
Minhas observações:
Eu gosto de entrar quando o preço retorna nas médias de maneira suave, sem muito movimento, quando toca na média 12 ou 26 é uma entrada, porém uma entrada sem confirmação, o ganho é maior, porém a chance de ser stopado é mais alta, eu gosto quando o preço fica perto das médias 12 e 26 e deixa um candle pequeno ou doji nesse pullback, minha entrada vai no rompimento desse candle e o stop atrás do candle.
Não existe MILAGRE, NÃO EXISTE TAXA DE ACERTO DE 100%, POR ISSO USE STOP.
Aaaaaaaaaa ia me esquecendo.... e o alvo???
Por ser um setup seguidor de tendência, o legal é deixar um trailing stop ou ir atualizando o stop conforme novos fundos ou topos são formados.
Realizar alvo no 1x1 é bom, setup paga muito!
Realizar alvo no 2x1 é bom de mais, setup paga bem!
Realizar alvo no 3x1 é mais do que bom, setup paga as vezes, ai daqui pra frente, depende de onde você está entrando nesse "PULLBACK", se é na primeira onda, na segunda, se vai lateralizar, o mercado é SOBERANO, põe no bolso que não é mais do mercado, ai é teu!
É isso, dúvidas, manda ai, sugestão, opinião, o que quiser.
Adicionado um símbolo no cruzamento das médias móveis 12 e 26.
ابحث في النصوص البرمجية عن "averages"

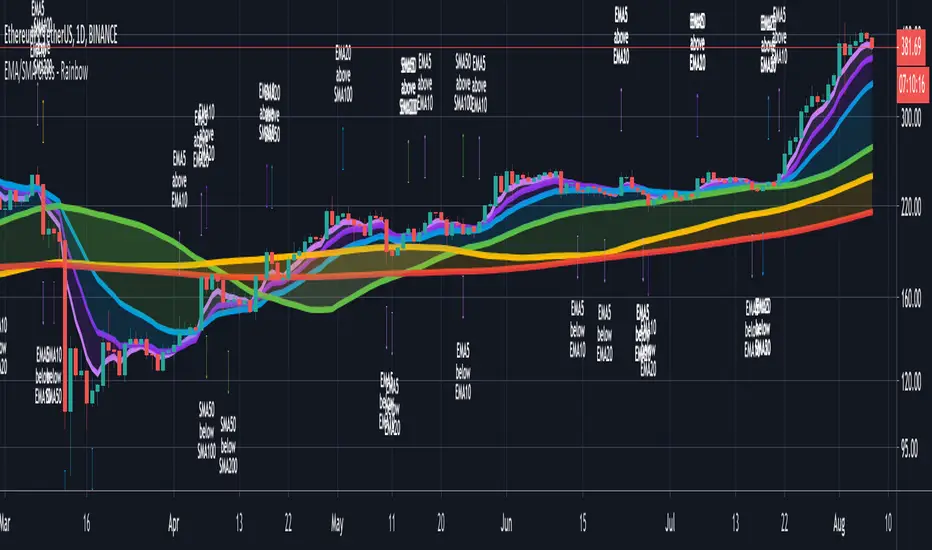
CryptoSignalScanner - Advanced Moving Averages - Cross & RainbowDESCRIPTION:
With this script you can plot 6 moving averages.
You can decide which Moving Average you want to show or hide.
For every plot you can decide to display the Simple Moving Average ( SMA ) or Exponential Moving Average ( EMA ).
It provides CrossOver and CrossUnder labels when loading the script. Those labels you can show or hide.
You have the possibility to show or hide the rainbow colors. This rainbow function gives you a clear view of the current trend.
HOW TO USE:
• When one Moving Average crosses above another Moving Average it signals an uptrend.
• When one Moving Average crosses below another Moving Average it signals a downtrend.
• The higher to length of the Moving Average the stronger the trend.
FEATURES:
• You can show/hide the preferred Moving Averages.
• You can set the length, type and source for every Moving Average.
• You can show/hide the rainbow colors.
• You can show/hide the CrossUp labels.
• You can show/hide the CrossDown labels.
• You can set alerts for every Moving Average.
• Etc...
DEFAULT SETTINGS:
• MA1 => EMA5
• MA2 => EMA10
• MA3 => EMA20
• MA4 => SMA50
• MA5 => SMA100
• MA6 => SMA200
Simple Moving Average vs. Exponential Moving Average:
SMA and EMA are calculated differently. The exponential moving average ( EMA ) focuses more on recent prices than on a long series of data points, as the simple moving average required.
The calculation makes the EMA quicker to react to price changes and the SMA react slower. That is the main difference between the two.
One is not necessarily better than another. It comes down to personal preference. Plot an EMA and SMA of the same length on a chart and see which one helps you make better trading decisions.
Moving Average Trading Strategies:
The first strategy is a price crossover, when the price crosses above or below a moving average, it signals a potential change in trend.
The second strategy applies when one moving averages crosses another moving average.
• When the short-term MA crosses above the long-term MA, it signals a buy signal.
• When the short-term MA crosses below the long-term MA, it signals a sell signal.
REMARKS:
• This advice is NOT financial advice.
• We do not provide personal investment advice and we are not a qualified licensed investment advisor.
• All information found here, including any ideas, opinions, views, predictions, forecasts, commentaries, suggestions, or stock picks, expressed or implied herein, are for informational, entertainment or educational purposes only and should not be construed as personal investment advice.
• We will not and cannot be held liable for any actions you take as a result of anything you read here.
• We only provide this information to help you make a better decision.
• While the information provided is believed to be accurate, it may include errors or inaccuracies.
If you like this script please donate some coins to share your appreciation.
Good Luck,
SEOCO
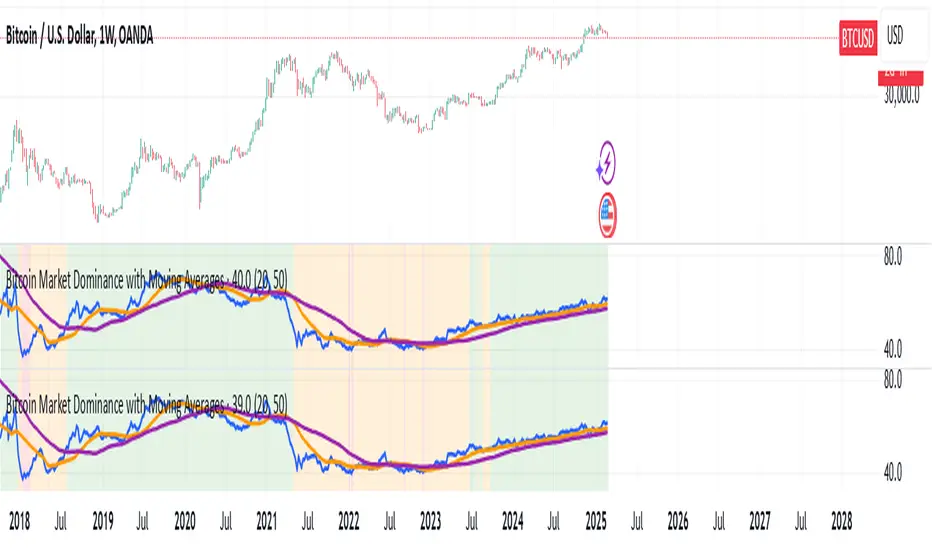
Bitcoin Market Dominance with Moving AveragesBitcoin Market Dominance with Moving Averages
This Pine Script indicator tracks Bitcoin market dominance by calculating the percentage of Bitcoin's market capitalization relative to the total cryptocurrency market cap.
Features:
✅ Real-time BTC Dominance Calculation: Displays the percentage of Bitcoin’s market share.
✅ Moving Averages: Includes two customizable moving averages for trend analysis.
✅ Visual Alerts: Background colors indicate different dominance levels:
Green: BTC dominance is above 50% (strong BTC market control).
Red: BTC dominance is below 40% (altcoins gaining strength).
Orange: BTC dominance is between 40%-50% (neutral zone).
This tool helps traders analyze Bitcoin’s influence on the crypto market and identify key dominance trends.
ROC with AveragesMain Idea
This script provides traders with a comprehensive view of market momentum by calculating the Rate of Change (ROC) and categorizing its impact into averages of positive, negative, and total values.
Key Features
Rate of Change (ROC) Calculation: Measures the percentage change in closing prices over a user-defined period.
Categorical Averages:
Positive Average: Average ROC for upward movements.
Negative Average: Average ROC for downward movements.
Total Average: Aggregate average across all movements.
Dynamic Visualization: Plots ROC alongside its categorized averages for better trend analysis.
Benefits
Simplifies the evaluation of market trends by breaking down data into actionable insights.
Helps traders identify the strength of upward or downward movements.
Offers a clear visual representation for quick decision-making.
This structure highlights the purpose and value of the script while aligning with the Minto Pyramid Principle. Let me know if you'd like further refinements!
الفكرة الرئيسية
يوفر هذا السكربت للمتداولين رؤية شاملة لزخم السوق من خلال حساب معدل التغير (ROC) وتصنيفه إلى متوسطات القيم الإيجابية والسلبية والإجمالية.
المميزات الرئيسية
حساب معدل التغير (ROC): يقيس النسبة المئوية للتغير في أسعار الإغلاق خلال فترة محددة يختارها المستخدم.
المتوسطات التصنيفية:
المتوسط الإيجابي: متوسط معدل التغير للحركات الصعودية.
المتوسط السلبي: متوسط معدل التغير للحركات الهبوطية.
المتوسط الإجمالي: متوسط إجمالي يشمل جميع الحركات.
تصور ديناميكي: يعرض معدل التغير إلى جانب المتوسطات المصنفة لتسهيل تحليل الاتجاهات.
الفوائد
يبسط تقييم اتجاهات السوق من خلال تقسيم البيانات إلى رؤى قابلة للتنفيذ.
يساعد المتداولين على تحديد قوة الحركات الصعودية أو الهبوطية.
يقدم تمثيلاً بصرياً واضحاً لاتخاذ قرارات سريعة ودقيقة.

Moving AveragesWhile this "Moving Averages" indicator may not revolutionize technical analysis, it certainly offers a valuable and efficient solution for traders seeking to streamline their chart analysis process. This all-in-one tool addresses a common frustration among traders: the need to constantly search for and compare different types and lengths of moving averages.
Key Features
The indicator allows for the configuration of up to 5 moving averages simultaneously, providing a comprehensive view of price trends. Users can choose from 7 types of moving averages for each line, including SMA, EMA, WMA, VWMA, HMA, SMMA, and TMA. This variety ensures that traders can apply their preferred moving average types without the need for multiple indicators.
Each moving average can be fully customized in terms of length, color, line style, and thickness, allowing for clear visual differentiation. However, what sets this indicator apart is its "Smart Opacity" feature. When activated, this option dynamically adjusts the transparency of the moving average lines based on their direction, with ascending lines appearing more opaque and descending lines more transparent. This subtle yet effective visual cue aids in quickly identifying trend changes and potential trading signals.
Advantages
The primary benefit of this indicator lies in its convenience. By consolidating multiple moving averages into a single, customizable tool, it saves traders valuable time and reduces chart clutter. The Smart Opacity feature, while not groundbreaking, does offer an intuitive way to visualize trend strength and direction at a glance.
Moreover, the indicator's flexibility makes it suitable for various trading styles and experience levels. Whether you're a novice trader learning to interpret basic trend signals or an experienced analyst fine-tuning a complex strategy, this tool can adapt to your needs.
In conclusion, while this "Moving Averages" indicator may not be a game-changer in the world of technical analysis, it represents a thoughtful refinement of a fundamental trading tool. By focusing on user convenience and visual clarity, it offers a practical solution for traders looking to optimize their chart analysis process and make more informed trading decisions.

Session Moving AveragesAdds EMAs and SMAs to chart using 8am-8pm EST values. Completely configurable in settings.
Some platforms allow users to configure what time frame they would like to view market data. One popular selection is 8am-8pm EST as 8am is when institutional orders go through. An argument can be made that price action before 8am EST is not valid yet moving averages will use that data.
This matters less for shorter moving averages such as a 9 or 20 ema, but it dramatically changes the 200 or the 50 sma for example.
This script allows you to ignore that pre-market data (or any data you choose to configure in the settings) and select up to 3 moving averages (either Exponential or Simple) for a set time.
By default the moving averages include the 9-ema (gray), 20-ema (green), and 200-sma (purple) and is set to 8am-8pm EST
This is configurable in the settings including the time frame you would like the moving averages to start using market data.
By default the script will use your charts timeframe. You are able to use multi-time frames with this script just scroll down to "timeframe", then click "chart" in settings... this will then allow you to select a timeframe.
A popular choice is 5-minute value of 8am-8pm EST moving averages. This means regardless of the time frame you are on (sub 1-minute, 1-minute, etc.) the script will display 5-minute data.
Final note: In settings you are able to turn on/off shapes (the gray lines at the bottom) which shows when the data is being used. This can be helpful on certain tickers that trade continuously such as /ES or /NQ.

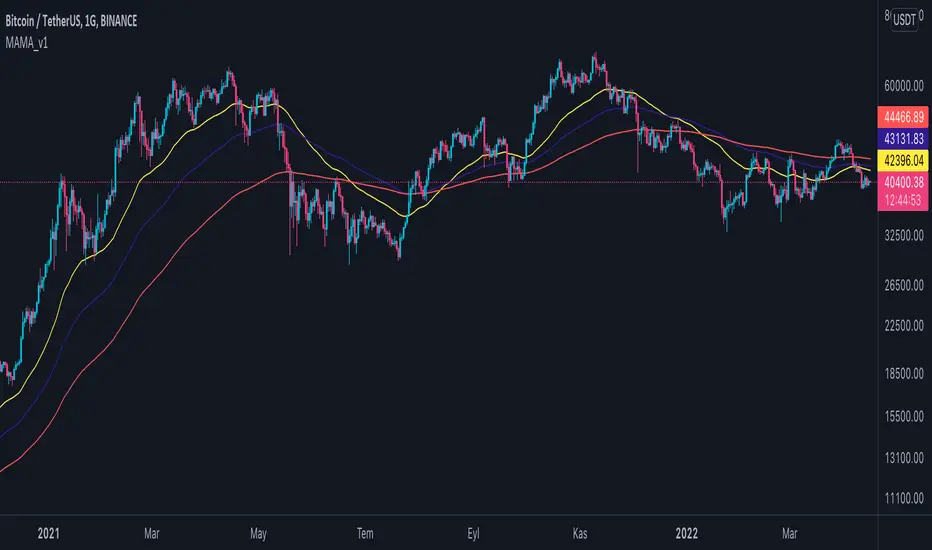
Multi Adjustable Moving Averages(MAMA) with Auto FibonacciMulti Adjustable Moving Averages(MAMA) with Auto Fibonacci
There are 10 moving averages in this indicator. There are 8 different types of moving averages to choose from.
You can also easily set the desired periods, colors and line thicknesses for each moving average from the first page.
It contains Auto Fibonacci as it is used a lot with moving averages. Those who want can easily add from the interface.
Below are the types of moving averages included;
SMA : Simple Moving Average
EMA : Exponential Moving Average
WMA : Weighted Moving Average
TMA : Triangular Moving Average
VAR : Variable Index Dynamic Moving Average a.k.a. VIDYA
WWMA : Welles Wilder's Moving Average
ZLEMA : Zero Lag Exponential Moving Average
TSF : True Strength Force
Alert ;
You can set an alarm on the cross(over or under) of the moving averages you want.
Periodic Moving AveragesIndicator plots three simple moving averages (MA) that are reset at the beginning of period, specified by a user.
Red MA is based on highs
Blue MA is based on close
Green MA one is based on lows.
Moving averages often act as support /resistance levels. They can also help to identify intraday trend. It is important to realize that none of the moving averages is universal as price behavior changes from day to day. On the chart I’ve highlighted several occurrences when one of MAs (different ones) provided support for price.
Parameters:
PERIOD – period for which MAs are plotted. They are reset at the beginning of each period. Period cannot be lower than chart’s timeframe
LENGTH – length of moving averages. If set to 0 then parameter is ignored and MAs are calculated on all bars, available in the period
VWAP? – if checked then moving averages will be calculated as volume weighted price
Disclaimer
This indicator should not be used as a standalone tool to make trading decisions but only in conjunction with other technical analysis methods.

Moving Averages Proximity Oscillator [LuxAlgo]This indicator returns the percentage or count of prices greater than simple moving averages with periods in a user set range, as well as the moving average period that is the closest to price values.
Settings
Minimum Length: Minimum SMA period
Maximum Length: Maximum SMA period
Smooth: Control the degree of smoothness of the indicator outputs
Normalized: Normalize the indicator outputs in a range (0, 100)
Src: Input source of the indicator
Usage
The indicator returns two outputs.
The "Price Above MA's" output returns for a current price value the number of times this one is greater than simple moving averages with periods ranging from Minimum Length to Maximum Length . This oscillator can be expressed as a percentage if Normalized is selected.
This oscillator allows identifying the direction of an underlying trend in the price. Higher Minimum Length and Maximum Length settings will return indications regarding longer term price variations, while shorter ranges will return less detailed outputs. This can be seen in the chart above where Minimum Length = 80 to Maximum Length = 100 .
The "Proximity Index" output on the other end does not return information regarding the direction of an underlying trend but the period of the simple moving average with periods ranging from Minimum Length to Maximum Length that is the closest to the current price value.
For various simple moving averages of differing periods, we can see that SMA's with shorter periods will tend to stay closer to the price, when price start reverting it will reach higher periods moving averages.
As such, this second indicator output can help identify the start of new trends, with higher values indicating price is reverting toward longer-term moving averages, suggesting a new trend forming.

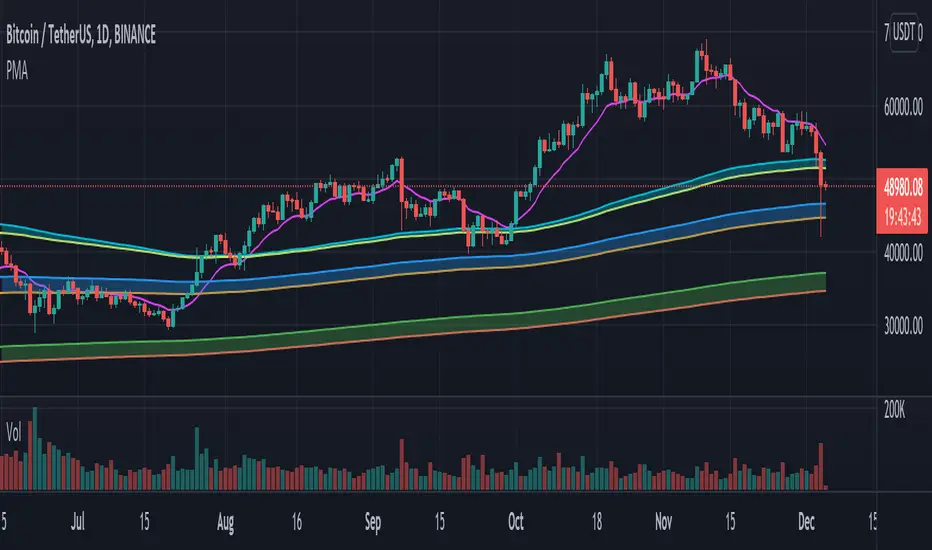
Pulu's Moving AveragesPulu's Moving Averages
This script allows you to customize sets of moving averages. It is configured default as 3 Vegas tunnels + an MA12. You can re-configure it for any of your moving average studies. At the first release, it supports up to 7 moving averages, many parameters, and eight types of algorithms:
ALMA, Arnaud Legoux Moving Average
EMA, Exponential Moving Average
RMA, Adjusted exponential moving average (aka Wilder’s EMA)
SMA, Simple Moving Average
SWMA, Symmetrically-Weighted Moving Average
VWAP, Volume-Weighted Average Price
VWMA, Volume-Weighted Moving Average
WMA, Weighted Moving Average
If you are looking for only 3 moving averages, there is another script "Pulu's 3 Moving Averages".
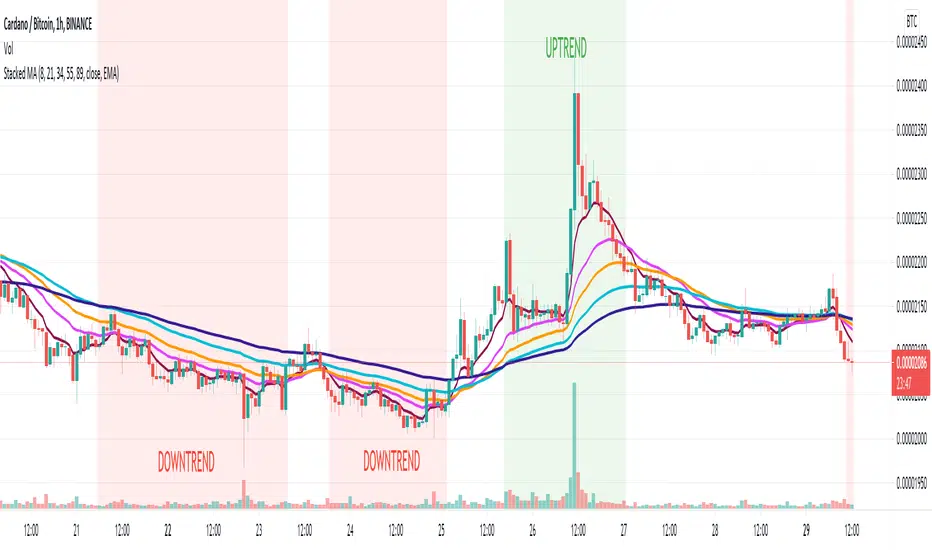
Stacked Moving AveragesThe Stacked Moving Averages indicator lets you see if a ticker is in an uptrend, downtrend, or no trend based on the condition of the moving averages. If the moving averages are stacked such that MA1>MA2>MA3>MA4>MA5, then that is described as an uptrend. If the moving averages are stacked such that MA5>MA4>MA3>MA2>MA1, then that is defined as a downtrend.
The moving averages can be SMA, EMA, or DEMA, and it’s possible to view all the moving average series in the chart or hide all series and only see if there is an uptrend or downtrend according to the condition.
Note: If length 4 OR length 5 is zero the MA4 OR MA5 will be ignored.
Point and Figure (PnF) Moving Averages HistogramThis is live and non-repainting Point and Figure Chart Moving Average Histogram tool. The script has it’s own P&F engine and not using integrated function of Trading View.
Point and Figure method is over 150 years old. It consist of columns that represent filtered price movements. Time is not a factor on P&F chart but as you can see with this script P&F chart created on time chart.
P&F chart provide several advantages, some of them are filtering insignificant price movements and noise, focusing on important price movements and making support/resistance levels much easier to identify.
Moving averages on Point & Figure charts are based on the average price of each column while bar chart moving averages are based closing price. Average Price means (ClosePrice + OpenPrice) / 2.
Because of there is double smoothing, you should use shorter lengths for moving averages. Double smoothing means: using average price smooths once, using length greater than 2 smooths price second time.
If you are new to Point & Figure Chart then you better get some information about it before using this tool. There are very good web sites and books. Please PM me if you need help about resources.
Options in the Script
Box size is one of the most important part of Point and Figure Charting. Chart price movement sensitivity is determined by the Point and Figure scale. Large box sizes see little movement across a specific price region, small box sizes see greater price movement on P&F chart. There are four different box scaling with this tool: Traditional, Percentage, Dynamic (ATR), or User-Defined
4 different methods for Box size can be used in this tool.
User Defined: The box size is set by user. A larger box size will result in more filtered price movements and fewer reversals. A smaller box size will result in less filtered price movements and more reversals.
ATR: Box size is dynamically calculated by using ATR, default period is 20.
Percentage: uses box sizes that are a fixed percentage of the stock's price. If percentage is 1 and stock’s price is $100 then box size will be $1
Traditional: uses a predefined table of price ranges to determine what the box size should be.
Price Range Box Size
Under 0.25 0.0625
0.25 to 1.00 0.125
1.00 to 5.00 0.25
5.00 to 20.00 0.50
20.00 to 100 1.0
100 to 200 2.0
200 to 500 4.0
500 to 1000 5.0
1000 to 25000 50.0
25000 and up 500.0
Default value is “ATR”, you may use one of these scaling method that suits your trading strategy.
If ATR or Percentage is chosen then there is rounding algorithm according to mintick value of the security. For example if mintick value is 0.001 and box size (ATR/Percentage) is 0.00124 then box size becomes 0.001.
And also while using dynamic box size (ATR or Percentage), box size changes only when closing price changed.
Reversal : It is the number of boxes required to change from a column of Xs to a column of Os or from a column of Os to a column of Xs. Default value is 3 (most used). For example if you choose reversal = 2 then you get the chart similar to Renko chart.
Source: Closing price or High-Low prices can be chosen as data source for P&F charting.
Options for P&F Bollinger Bands:
MA Type: MA type can be EMA or SMA
MA Source: Moving averages on P&F charts are based on the average price of each column. Bar chart moving averages are based on each close price. Average price means “(ClosePrice + OpenPrice) / 2”. You can choose Close Price or Average Price as source. Default is Average Price.
Fast MA Length : Length of Fast Moving average, shorter length than Slow MA
Slow MA Length : Length of Slow Moving average, greater length than Slow MA
There are alerts when Fast MA Crossed over/under Slow MA conditions. While adding alert “Once Per Bar Close” option should be chosen.

RSI with Moving Averages[UO] EnhancedWhat This Indicator Does
Displays the RSI (Relative Strength Index) with two customizable moving averages to help identify trend direction and momentum shifts.
Key Features
RSI Line: Shows momentum (overbought above 70, oversold below 30)
Two Moving Averages: Smooth RSI signals and show trend direction
Color-Coded Fills: Visual areas between lines indicate bullish/bearish conditions
Support/Resistance Lines: Bull market support (40) and bear market resistance (60)
Customization Options
Moving Average Types: Choose SMA or EMA for each line
Periods: Adjust RSI (14), First MA (13), Second MA (33)
Visual Elements: Toggle background shading and fills on/off
Colors & Styles: Customize all line colors and widths in Style tab
How to Read It
Green Fill: Second MA below first MA (bullish momentum)
Red Fill: Second MA above first MA (bearish momentum)
RSI Above 70: Potentially overbought
RSI Below 30: Potentially oversold
Perfect for traders wanting enhanced RSI analysis with flexible moving average confirmation signals.

MMA, Mid-Price Moving Averages (Open + Close Based MAs)📝 Script Description
This script introduces a custom set of moving averages based on the mid-price, calculated as the average of the open and close prices:
Mid Price = (Open + Close) / 2
Instead of traditional close-based MAs, this approach reflects the average sentiment throughout the trading session, offering a smoother and more realistic view of price action.
🔍 Key Features:
✅ Gap-aware smoothing
Captures opening gaps, offering a better representation of intraday shifts.
✅ Reduced noise
Less vulnerable to sharp closing moves or one-off spikes, making it easier to identify true trend breaks or supports.
✅ Closer to actual flow
Reflects a more natural midline of price movement, ideal for traders who prioritize clean, sustained trends.
✅ Better support/resistance alignment
Especially useful for identifying stable uptrends and minimizing false breakout signals.
📐 Included Moving Averages:
MA 5
MA 10
MA 20
MA 60
MA 120
MA 200
(All based on mid-price, not close)
🎯 Recommended For:
Traders seeking smoother and more reliable trendlines
Those who want a more realistic depiction of support and resistance
Ideal for filtering out noisy movements while focusing on clean, straight-moving charts

6 Moving Averages Difference TableIndicator Summary: 6 Moving Averages Difference Table (6MADIFF)
This TradingView indicator calculates and plots up to six distinct moving averages (MAs) directly on the price chart. Users have extensive control over each MA, allowing selection of:
Type: SMA, EMA, WMA, VWMA, HMA, RMA
Length: Any positive integer
Color: User-defined
Visibility: Can be toggled on/off
A core feature is the on-chart data table, designed to provide a quick overview of the relationships between the MAs and the price. This table displays:
$-MA Column: The absolute difference between the user-selected Input Source (e.g., Close, Open, HLC3) and the current value of each MA.
MA$ Column: The actual calculated price value of each MA for the current bar.
MA vs. MA Matrix: A grid showing the absolute difference between every possible pair of the calculated MAs (e.g., MA1 vs. MA2, MA1 vs. MA3, MA2 vs. MA5, etc.).
Customization Options:
Input Source: Select the price source (Open, High, Low, Close, HL2, HLC3, OHLC4) used for all MA calculations and the price difference column.
Table Settings: Control the table's visibility, position on the chart, text size, decimal precision for displayed values, and the text used for the column headers ("$-MA" and "MA$").
Purpose:
This indicator is useful for traders who utilize multiple moving averages in their analysis. The table provides an immediate, quantitative snapshot of:
How far the current price is from each MA.
The exact value of each MA.
The spread or convergence between different MAs.
This helps in quickly assessing trend strength, potential support/resistance levels based on MA clusters, and the relative positioning of short-term versus long-term averages.

Daily Moving Averages on Intraday ChartsThis moving average script displays the chosen 5 daily moving averages on intraday (minute) charts. It automatically adjusts the intervals to show the proper moving averages.
In a day there are 375 trading minutes from 9:15 AM to 3:30PM in Indian market. In 5 days there are 1875 minutes. For other markets adjust this data accordingly.
If 5DMA is chosen on a five minute chart the moving average will use 375 interval values (1875/5 = 375) of 5minute chart to calculate moving average. Same 5DMA on 25minute chart will use 75 interval values (1875/25 = 75).
On a 1minute chart the 5DMA plot will use 1875 interval values to arrive at the moving average.
Since tradingview only allows 5000 intervals to lookback, if a particular daily moving average on intraday chart needs more than 5000 candle data it won't be shown. E.g 200DMA on 5minute chart needs 15000 candles data to plot a correct 200DMA line. Anything less than that would give incorrect moving average and hence it won't be shown on the chart.
MA crossover for the first two MAs is provided. If you want to use that option, make sure you give the moving averages in the correct order.
You can enhance this script and use it in any way you please as long as you make it opensource on TradingView. Feedback and improvement suggestions are welcome.
Special thanks to @JohnMuchow for his moving averages script for all timeframes.

Moving Averages w/Signals [CSJ7]Unlock the power of three dynamic moving averages: Fast, Medium, and Slow. Choose between the reliability of Simple or the responsiveness of Exponential MAs. Plus, with our tailored Buy and Sell signals based on user-defined crossing scenarios, you're equipped with a clear roadmap in the ever-changing landscape of the markets.
1. Spot Trends with Ease: Our color-coded system makes identifying the market's direction intuitive. Green signals bullish momentum, while red indicates bearish movements.
2. Precision Signals: Navigate the markets confidently with our Buy and Sell signals, designed to highlight potential entry and exit points.
3. Gauge Trend Strength: The color intensity between the Medium and Slow MAs offers a visual cue on the trend's strength, ensuring you're always in the know.
Limitations:
- Inherent Lag: As with all moving average tools, there's a natural delay. But it's this reflective nature that offers valuable insights.
- Stay Alert in Sideways Markets: During consolidative phases, the indicator might produce occasional false signals. Always cross-reference with other tools.
- Customization is Key: The tool's true potential shines when you adjust the settings to align with your trading style and strategy.
4. How to Use:
Quick Setup: Select your preferred MA type, set the lengths, and define your ideal crossover scenarios. It's that simple!
Interpreting Signals: A green triangle below the price suggests a potential buying zone, while a red triangle above hints at a selling opportunity.
Trend Insights: The color gradient between the Medium and Slow MAs offers a visual representation of the trend's vigor. The more vibrant, the stronger the trend.
Elevate your trading strategy with the Moving Averages w/Signals & AutoTrade . With clarity and precision, it's the companion every trader deserves.

Planetary Tunings Moving AveragesThe Pine Script "Planetary Tunings Moving Averages" is a unique tool that plots moving averages (MAs) on a chart, representing the wavelengths of different planets as derived from the book Quadrivium. These wavelengths, also referred to as 'planetary tunings', are related to the orbital resonance of each planet.
Each planetary tuning value is first transformed into a whole number by multiplying it by 1000 and removing the decimal. This whole number is then used as the length parameter for a Simple Moving Average (SMA) function. This function calculates the average of the closing prices over the defined number of periods, thereby creating a moving average line on the chart.
The moving average lines are color-coded according to the planet they represent, allowing for quick and easy interpretation. For example, Mercury's moving average line is blue, Venus's line is orange, and so forth. These colors can be adjusted directly in the Pine Script code if desired.
Additionally, the script computes the mean of all these moving averages and plots it on the chart. This line provides an overall trend line, summarizing the collective behavior of all the planetary tuning moving averages.
The drawings in the chart are fib channels and fib circles that I use to capture liquidity in time.
Please note that this script is written for Pine Script Version 4. It's crucial to ensure your TradingView platform is compatible with this version. For any issues or further clarification, consider referring to TradingView's Pine Script documentation or its community forums.

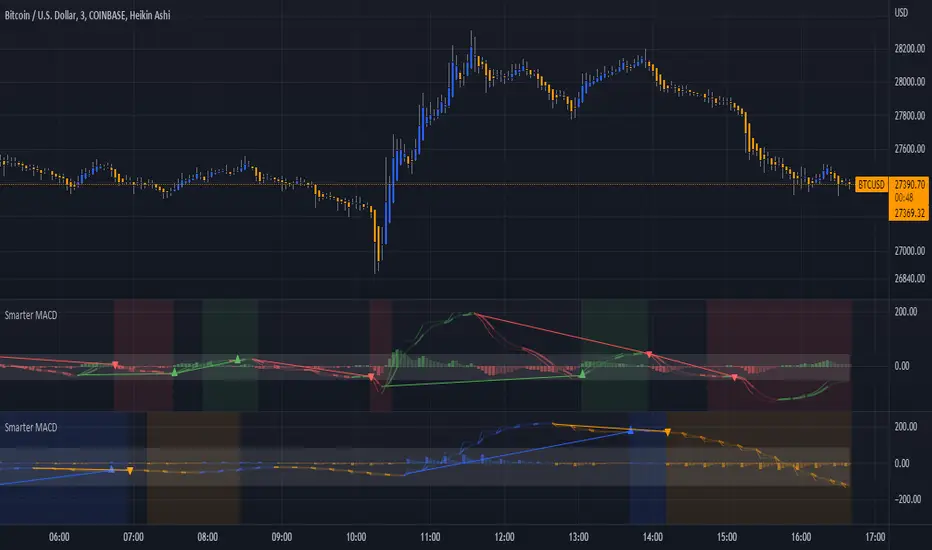
Smarter MACDA classic MACD with average peak and dip lines. The lighter green and red horizontal lines are the average peak and dip of the entire span, respectively. The second, bolder of the two lines are the averages of the peaks and dips above and below the overall peak and dip averages. The filled in color is to help visualize these averages and possible trade setups. Rework of the MACD + Averages script.
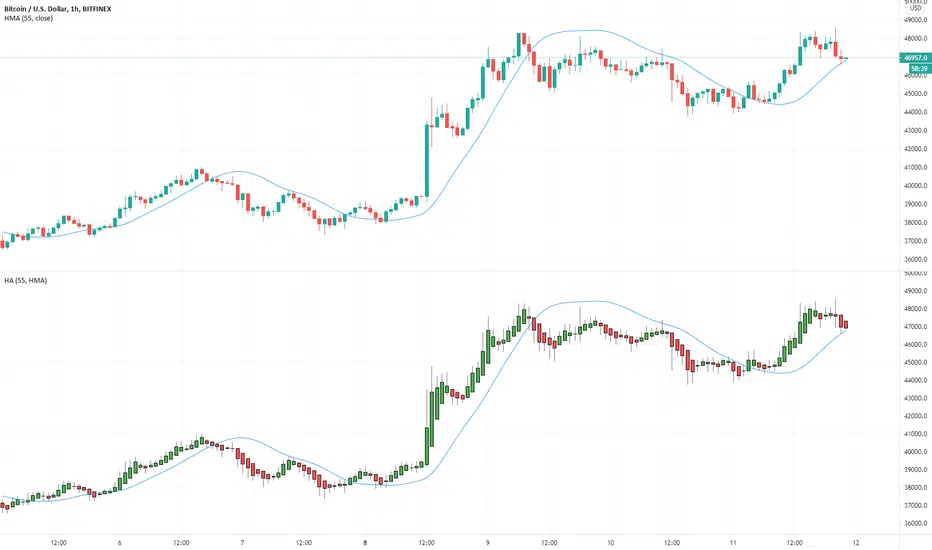
Multiple Moving Averages for Heikin Ashi I want to give credits to @QuantNomad, i got the heikin ashi part of the script from this open script /0iKy7lyG-QuantNomad-Heikin-Ashi-PSAR-Strategy/;
and to the other guy that provided a 17 type of moving average script open source but i forgot his name, if someone remember please tell me.
My idea was to see how the different types of moving averages behaves in a Heinkin Ashi chart, you can change to more than 15 types of Moving Average and use it the way you want it.
For the source of the moving averages i used a simple moving average of 1 period using the high of the heikin ashi candle, low of it and divided by 2 as the source of the different types of moving averages.
Different types of Moving Averages
Moving Average Types
SMA ---> Simple
WMA ---> Weighted
VWMA ---> Volume Weighted
EMA ---> Exponential
DEMA ---> Double EMA
ALMA ---> Arnaud Legoux
HMA ---> Hull MA
SMMA ---> Smoothed
LSMA ---> Least Squares
KAMA ---> Kaufman Adaptive
TEMA ---> Triple EMA
ZLEMA ---> Zero Lag
FRAMA ---> Fractal Adaptive
VIDYA ---> Variable Index Dynamic Average
JMA ---> Jurik Moving Average
T3 ---> Tillson
TRIMA ---> Triangular
The type of moving average you select will appear in a separated chart with Heikin Ashi candles, like in the image above.
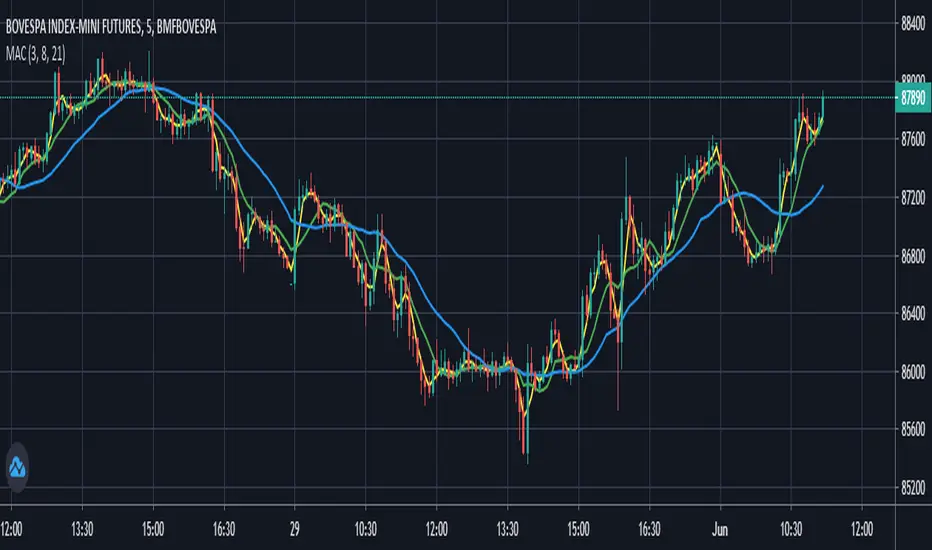
Moving Averages Convergence (Agulhada do Didi)The script is based on a strategy developed by Odir “Didi” Aguiar called “Agulhada do Didi”.
It consists in the use of 3 moving averages:
SMA 3
SMA 8
SMA 21
Strategy:
When the averages come together, preferably they pass through a candle, there is a signal. The crossing of the short average (3) with the long average (21) provides us with a confirma-tion of the entry.
Buy:
The average of 3 periods comes out on top, 8 goes in the middle and 21 goes down.
Sell:
Average of 21 periods comes out on top, 8 in the middle and 3 down.
6 Simple Blue & 5 Exponential Yellow Moving Averages6 simple and 5 exponential Moving Averages in one indicator.
I made this because its not always easy to tell what average the price might be bouncing off from when you only have a couple at a time.
For some reason, the defaults aren't working.
To fix this, just open the configuration for the indicator after the first time that you load it.
Then check/uncheck the box and set the time period.
If anyone knows how I can fix this in the code, please let me know.
Blue indicators are simple and the Yellow are exponential.
Thinner more transparent lines are shorter term averages and Thicker lines are longer term averages.
I modeled it after the source of several other scripts which had less averages
Weekly Moving Averages (MAs) to Intraday ChartThis indicator overlays key weekly timeframe moving averages onto your intraday chart, allowing you to visualize important long-term support and resistance levels while trading shorter timeframes. The indicator includes:
330-period Simple Moving Average (white): Ultra long-term trend indicator
200-period Simple Moving Average (fuchsia): Major long-term trend indicator often watched by institutional traders
100-period Simple Moving Average (purple): Medium-to-long term trend indicator
50-period Exponential Moving Average (blue): Medium-term trend indicator, more responsive to recent price action
21-period Exponential Moving Average (teal): Short-to-medium term trend indicator
9-period Exponential Moving Average (aqua): Short-term trend indicator, highly responsive to recent price movements
This multi-timeframe approach helps identify significant support/resistance zones that might not be visible on your current timeframe. When price interacts with these weekly moving averages during intraday trading, it often signals important areas where institutional orders may be placed.
The indicator uses color-coding with increasing line thickness to help you quickly distinguish between different moving averages. Consider areas where multiple MAs cluster together as particularly strong support/resistance zones.
Perfect for day traders and swing traders who want to maintain awareness of the bigger picture while focusing on shorter-term price action.
